DOI: 10.7508/pj.2017.02. 003
Print ISSN: 2383-451X Online ISSN: 2383-4501 Web Page: https://jpoll.ut.ac.ir, Email: [email protected]
Simulation of groundwater quality parameters using ANN and
ANN+PSO models (Case study: Ramhormoz Plain)
Soltani Mohammadi, A.*, Sayadi Shahraki, A. and Naseri, A.A.
Irrigation and Drainage Department, Faculty of Water Sciences Engineering, Shahid Chamran University , Ahvaz, Iran
Received: 15 Aug. 2016 Accepted: 7 Oct. 2016
ABATRACT: One of the main aims of water resource planners and managers is to estimate and predict the parameters of groundwater quality so that they can make managerial decisions. In this regard, there have many models developed, proposing better management in order to maintain water quality. Most of these models require input parameters that are either hardly available or time-consuming and expensive to measure. Among them, the Artificial Neural Network (ANN) Models, inspired from human brain, are a better choice. The present study has simulated the groundwater quality parameters of Ramhormoz Plain, including Sodium Adsorption Ratio (SAR), Electrical Conductivity (EC),and Total Dissolved Solids (TDS), via ANN and ANN+ Particle Swarm Optimization (PSO) Models and at the end has compared their results with the measured data. The input data for TDS quality parameter is consisted of EC, SAR, pH, SO4, Ca, Mg, and Na, while for SAR, it includes TDS, pH, Na, and Hco3, and as for EC, it involves So4, Ca, Mg, SAR, and pH; all of them, gathered from 2009 to 2015. Results indicate that the highest prediction accuracy for SAR, EC, and TDS is related to the ANN + PSO model with the tangent sigmoid activation function so that both MAE and RMSE statistics have the minimum and R2 the maximum value for the model. Also the highest prediction accuracy is respectively related to EC, TDS, and SAR parameters. Considering the high efficiency of artificial neural network model, by training the PSO algorithm, it can be used in order to make managerial decisions and ensure monitoring and cost reduction results.
Keywords: artificial neural network, particle swarm optimization algorithm, Ramhormoz, water quality.
INTRODUCTION
Increasing water demand in different regions, especially in arid and semi-arid areas, shows the necessity of optimal management of water resources more than before. In most regions of Iran, groundwater resources are the only source of drinking and agricultural water. Generally, the quality of groundwater is affected by two factors: human activities including agriculture, and natural factors
Corresponding Author E-mail :[email protected]
water resources is a key point for optimal planning, management, and utilization of water resources. Salinity and the value of sodium are the most important quality criteria to classify agricultural water. Not only do they affect the plant growth, but they also determine the degree of water appropriateness for irrigation as well as its impact on soil permeability. Salinity is measured by Electrical Conductivity (EC), while sodium is measured by Sodium Absorption Ratio (SAR) (Alizadeh, 2001). Due to the importance of the quality parameters, aforementioned, their measurement is essential for agricultural purposes. Measuring a considerable number of these parameters is expensive, time-consuming, and in need of high accuracy; therefore, indirect ways appear to predict these parameters, more than before. To manage water quality, numerous models have been developed that require several input parameters such as hydrology, meteorology data, etc.; all of them, difficult to get access to or expensive and time consuming to measure (Kuo et al., 2004, Noorani & Salehi, 2004). Accordingly, achieving reliable methods to predict the quality parameters of groundwater is very important in order to plan timely and accurate utilization of water resources.
As a result, Artificial Neural Network (ANN) has received much attention from a great number of researchers (Noori et al., 2011). Use of ANN in hydrological studies during the recent decade indicates that these models are greatly able to discover inter-data relations and recognize the patterns. Success of neural network models to estimate different parameters of water resources has always been emphasized by various researchers (Kuo et al., 2004). Musavi-Jahromi and Golabi (2008) predicted the parameters TDS, EC, and SAR in case of Karun River, using ANN Model with accuracy, greater than 90%. Najah et al. (2009) emphasized the high ability of neural networks to predict the
water quality parameters TDS, EC, and turbidity of Johor River in Malaysia. Mirzavand et al. (2015) simulated the groundwater quality parameters of Kashan plain, using artificial neural model with great accuracy. The high efficiency of the wavelet-neural networks hybrid models in forecasting the water quality parameters SAR, EC, and TDS has been reported by Banejad et al. (2013). The neural network method with backward error propagation training sometimes may decrease the accuracy of the simulation; therefore, to solve this problem the neural network model with Particle Swarm Optimization (PSO) algorithm training is being used as well. PSO+ANN method has been successfully used by many researchers in water resources management (Wenxian & Hongxiang, 2010). Ahmadi et al. (2015) predicted the water table depth of Najafabad plain by applying particle SWARM optimization algorithm. Their results showed that PSO model is greatly accurate when predicting the fluctuations of water table and can be used as a simulating model to predict and simulate different scenarios, related to water resources. Hence, the main objective of the present study is to simulate water quality parameters of Ramhormoz plain, namely SAR, EC, and TDS, by means of ANN and ANN+PSO models in the MATLAB environment software and ultimately to compare their results with the measured data.
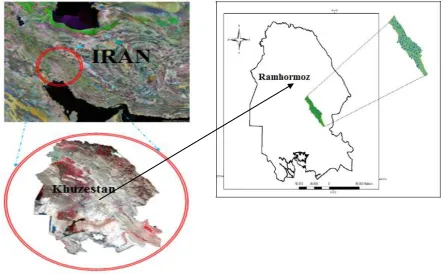
MATERIALS AND METHODS Study area
province. A’ala River, the main source of water in the area, is located in the middle of the plain flowing from the northeast to the south of the plain, where it joins the Maroun River and forms the Jarahi River. Figure 1shows the plain area.
Artificial Neural Network Model (ANN) The key element in this model is the new structure of data processing system, consisted of a large number of elements (neurons) with strong internal communications that work harmoniously together to solve specific problems. Processing the experimental data, artificial neural networks transfer the knowledge or the law behind the data to the network structure; a process called training. Using computer programming knowledge, data structures can be designed to act as neurons. It then can be trained by creating a network of interconnected artificial neurons, generating a training algorithm for the network, and applying the algorithm to the network.
In general, a neural network is made up of three layers: The input layer only
receives the data and acts the same as independent variable. Thus the number of input layer neurons is determined based on the nature of the problem, depending on the number of independent variables. The output layer acts similar to a dependent variable, the number of its neurons depending on the number of dependent variables. But the hidden layer, unlike the input and output ones, represents nothing and is only an intermediate result in the process of calculating the output value.
The customary architecture of the ANNs is composed of three layers. Theoretical works and many experimental results have shown that a single hidden layer is sufficient for ANNs to approximate any complex nonlinear function. A major reason for this is that intermediate cells, connected to output cells indirectly, will undergo very small weight changes and will learn very slowly (Noori et al., 2010). The current study uses a model based on a feedforward neural network with a single hidden layer.
The design and implementation stages of neural network model are as below:
1. Measuring and standardization of neural network model input data 2. The model designation, specifying the
architecture, the number of layers (in this study, three-layer model is used) and determining the appropriate activation function for the intended neural network model (tangent sigmoid and logarithmic sigmoid are used as the activation function for hidden and output layers respectively). 3. Training the network using a part of the data (to determine the amount of weights and biases).
4. Testing and evaluating the network by means of the remaining data 5. Displaying the output and simulation
results of the model.
This study has considered 85% and 15% of the data for training and model validation, respectively.
Table 1presents the sensitivity of ANN model to quantify the data.
Table 1. The sensitivity of ANN model
The percentage of training data 70 80 85 Determination coefficient between
measurements and simulations 85 14 83
According to Table 1, the highest accuracy of simulation models for the training one occurs when 85% of the data are involved, as increased percentage of the training data leads to higher accuracy of the simulation model.
Training is a problem while using ANN which is trained by backward error propagation method. By using Particle Swarm Optimization Algorithm (PSO) method, the present study has attempted to resolve this problem.
Particle Swarm Optimization Algorithm (PSO)
The principle of this algorithm is based on the fact that swarm members in a search space are adopted towards the past successful regions and are also affected by the success of the neighboring members. In a more explicit manner, this can be stated as follows:
Each swarm member is called a "particle", showing a potential solution. Within the search space it changes the location and updates its velocity, based on the flight experience of not only itself but also its neighboring particles, helping it to gain a better position. Particle i is shown as Xi=(xi1, xi2,…, xiD). The situation with the best fitting function will be recorded as the best current position. This position is considered as Pi=(pi1, pi2,…, piD) and the corresponding fitting function is called and recorded as Pbesti. The best general position in the swarm is related to the best fitting function. Titled Gbest, it is recorded as Pg=(pg1, pg2,…, pgD). Velocity or the rate of position change for particle i is shown as Vi=(vi1, vi2,…, viD). During the replication process, velocity and position of the particle i will be updated in accordance with Equations (1)-(3).
1
0, 1
.
0, 2
.
id id id id gd id
V t K V t rand φ P t X t rand φ P t X t (1)
1
1
1, 2,,id id id
X t X t V t d D (2)
2 2 2 4 K
φ φ φ (3)
in which φ= φ1+ φ2. K is the contraction factor, being a function of φ1 and φ2 that are constant acceleration values showing the weight of particles' random acceleration with the tendency to the best personal and
global position. The functions rand(0, φ1) and rand(0, φ2) produce random numbers in the range of [0, φ1] and [0, φ2] respectively. According to Equation (2), the current flight velocity of the particles
includes three parts: The first one indicates the particle's previous velocity, while the second and third ones show the single particle and swarm model. In single particle model, each member is separate, using personal thoughts and experiences independently; while in the swarm model, members move towards success, based on
the effective experiences of their neighbors (Eberhart & Shi, 2000). Although PSO Algorithm is able to find the area of feasible solution quickly, though the convergence rate will be severely reduced getting to this area. To solve this problem, Equation (1) is amended as follows.
1
1
0, 1
.
2
0, 2
.
id id id id gd id
V t ω V t c rand φ P t X t c rand φ P t X t (4)
In the above equation, ω, c1 and c2 represent the inertia weight, a positive parameter called cognitive parameter, and another positive parameter called social parameter respectively.
The use of inertia weight parameter leads to a compromise between global and local discovery capabilities of the category. An inertia weight of considerable size acts as a stimulus for the enlargement of the particles' velocity vector throughout the solution spaces (moving towards solution spaces of the search space not experienced previously), while a smaller one narrows the solution spaces in the already-small current area. In fact, lower weight causes the search to continue with higher accuracy in areas, experienced in the past. Properly selecting ω ensures an optimum balance established between local and global
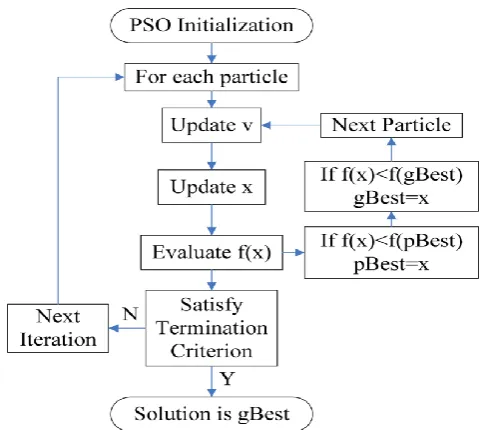
solution spaces, consequently increasing the algorithm's efficiency. Thereby the amount of ω is predetermined as equal to one at the beginning of the search, to gradually move towards zero. Figure 2 shows the flowchart of PSO algorithm.
Input parameters of the models
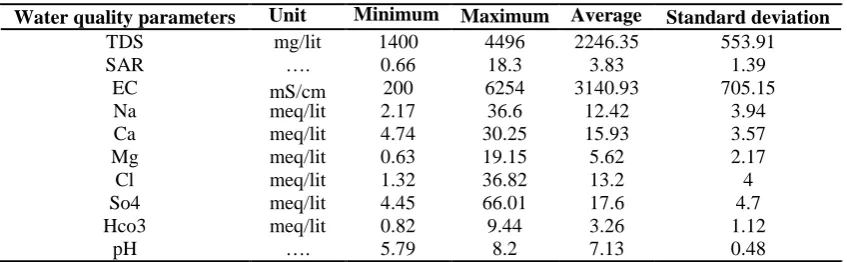
This study has used water quality data of Ramhormoz plain between the years 2009 and 2015 so that it could model the parameters of SAR, EC, and TDS. Input data of ANN and ANN+PSO models for TDS quality parameter consisted of EC, SAR, pH, So4, Ca, Mg, and Na. For SAR they included TDS, pH, Na, and Hco3, and for EC they contained So4, Ca, Mg, SAR, and pH. Table 2shows the input characteristics of quality parameters.
Soltani Mohammadi, A. et al.
Table 2. Descriptive statistics of the groundwater parameters of Ramhormoz plain
Water quality parameters Standard deviation
TDS mg/lit 1400 4496 2246.35 553.91
SAR …. 0.66 18.3 3.83 1.39
EC 200 6254 3140.93 705.15
Na meq/lit 2.17 36.6 12.42 3.94
Ca meq/lit 4.74 30.25 15.93 3.57
Mg meq/lit 0.63 19.15 5.62 2.17
Cl meq/lit 1.32 36.82 13.2 4
So4 meq/lit 4.45 66.01 17.6 4.7
Hco3 meq/lit 0.82 9.44 3.26 1.12
pH …. 5.79 8.2 7.13 0.48
Model evaluation criteria
To determine the models' accuracy, the values of Root Mean Square Error (RMSE), Mean Absolute Error (MAE), and Determination Coefficient (R2) have been used:
21
observed predictedRMSE y y
n (5)
1 100
observed predictedMAE * y y
n (6)
2 2 1
predicted observed observed predicted y y R y y n (7)In the equation above ypredicted, yobserved and n represent predicted values, observed values, and the number of data, respectively. The closer the values of RMSE and MAE to zero and the value of R2 to one, the more accurate the model.
RESULTS AND DISCUSSION
According to Musavi-Jahromi and Golabi (2008) and Banejad et al. (2013) the choice of SO42-, pH, HCO32-, Na+, Mg2+, Ca2+, TDS, SAR, and EC has led to good results when modeling the quality of the parameters discussed. Thus, different combinations of these parameters were used as the inputs of the models. All calculations of the present study have been conducted in MATLAB and Excel. The models’ outputs have been obtained for two activation functions with respect to the parameters SAR, EC, and TDS. Afterwards based on the model evaluation criteria, the scenario with the least amount of error in
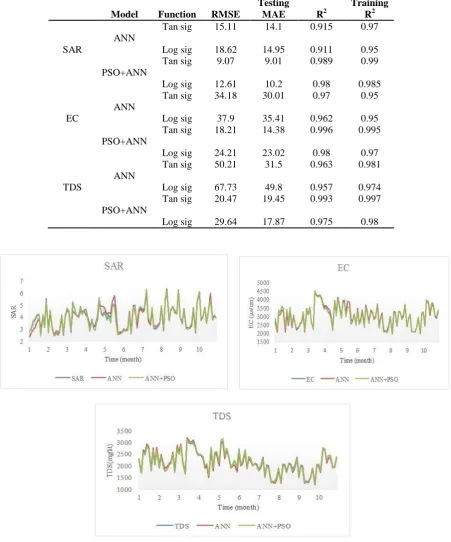
training and test period was selected as the optimal structure. RMSE, MAE and R2 values of the three mentioned parameters measured by ANN and ANN+PSO models with tangent sigmoid and logarithmic sigmoid activation functions are shown in Table 3.
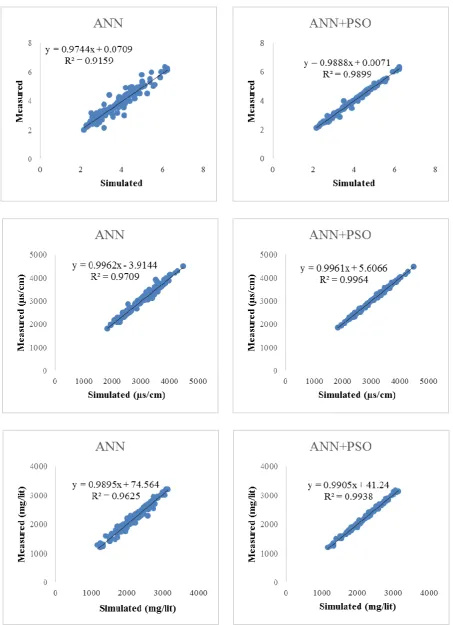
According to Table 3, in both ANN and ANN+PSO models, the simulation accuracy of SAR, TDS, and EC in tangent sigmoid activation function is higher than the logarithmic sigmoid activation function. Comparing the results of ANN and ANN+PSO models, one can find that the simulation accuracy of the latter is greater, thus the ANN+PSO model with the tangent sigmoid activation function is the optimal model to estimate the parameters of SAR, EC, and TDS. Figure 3shows the changes in SAR, EC, and TDS, using the models and measured values.
As Figure 3shows, the estimations of ANN+PSO model has the greatest correlation with the measured values, which is because of the training. In fact, in the ANN, the backward error propagation method has been used for the training phase, which usually gives relatively good results for prediction, though it has some disadvantages, e.g. trapping in local optimum and slow convergence rate. The other neural model to apply Particle Swarm Optimization Algorithm for training functions based on searching. It also can partly try further random selection of the points by a stochastic method. In this model particles try to choose and update
Unit Minimum Maximum Average
the most optimal points in each iteration, depending on their position and velocity; therefore, simulation results are highly accurate.
Figure 4 shows a comparison between measured and predicted values of SAR, EC, and TDS, using ANN and ANN+PSO models.
Table 3. The results of ANN and ANN + PSO models for simulation of SAR, EC, and TDS
Testing Training Model Function RMSE MAE R2 R2
Tan sig 15.11 14.1 0.915 0.97 ANN
SAR Log sig 18.62 14.95 0.911 0.95
Tan sig 9.07 9.01 0.989 0.99 PSO+ANN
Log sig 12.61 10.2 0.98 0.985 Tan sig 34.18 30.01 0.97 0.95 ANN
EC Log sig 37.9 35.41 0.962 0.95
Tan sig 18.21 14.38 0.996 0.995 PSO+ANN
Log sig 24.21 23.02 0.98 0.97 Tan sig 50.21 31.5 0.963 0.981 ANN
TDS Log sig 67.73 49.8 0.957 0.974
Tan sig 20.47 19.45 0.993 0.997 PSO+ANN
Log sig 29.64 17.87 0.975 0.98
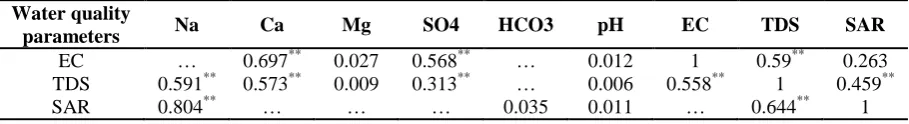
Table 4. Correlations of EC,TDS,andSAR with other input parameters
Water quality
parameters Na Ca Mg SO4 HCO3 pH EC TDS SAR
EC … 0.697** 0.027 0.568** … 0.012 1 0.59** 0.263
TDS 0.591** 0.573** 0.009 0.313** … 0.006 0.558** 1 0.459**
SAR 0.804** … … … 0.035 0.011 … 0.644** 1
This figure determines the value of R2 statistics and fitting equation among the points, according to which, in relation to ANN+PSO model with tangent sigmoid activation function, the highest determination coefficient and the highest a coefficient have been estimated respectively for the quality parameters of EC, TDS, and SAR. The analysis of correlation of input variables and the target variable is very worthwhile, since it provides helpful information about the dependency of each input parameter to the target parameter.
Table 4 demonstrates the correlation between EC, TDS, and SAR as well as input parameters of each model.
According to Table 4, the highest correlation of EC with 0.99 level of reliability is related to Ca, TDS, and So4. The highest correlation of TDS is related to Na, Ca, EC, SAR, and So4, while the highest correlation of SAR is related to Na and TDS.
CONCLUSION
The present study used ANN and ANN+PSO models to simulate groundwater quality parameters of EC, TDS, and SAR in Ramhormoz plain, located in Khuzestan Province, Iran. The models were tested and validated based on the measured data. Results indicate that ANN+PSO model is able to simulate groundwater quality parameters in high volume, requiring measurements, along with expensive and time-consuming laboratory work.
Acknowledgement
The corresponding author thankfully acknowledges Shahid Chamran University of Ahvaz for financial support in form of grant for project number 1265.
REFERENCES
Affadi, A., Watanabe, K. and Tirtomihardjo, H. (2007). Application of an artificial neural network to estimate groundwater level fluctuation, J. of Spatial Hydrology, 7(2), 23-46.
Ahmadi, Z., Zekri, M. and Beyjami, A. (2015). Predict the depth of the groundwater table using particle swarm optimization. In: Proceedings of 10th International Congress of Civil Engineering, 5-7 May, Tabriz, Abstract. [in Persian]
Alizadeh, A. (2001). Principles of applied hydrology. 3Th ed. Mashhad: Astan Qods Razavi Publishing. [in Persian]
Banejad, H., Kamali, M., Amirmoradi, K. and Olyaie, F. (2013). Forecasting some of the qualitative parameters of rivers using Wavelet Artificial Neural Network hybrid (W-ANN) model (Case of study: Jajroud river of Tehran and Gharaso river of Kermanshah). J. of Health and Environ., 6(3), 277-294. [in Persian]
Eberhart, R. and Shi, Y. (2000). Comparing inertia weights and constriction factors in particle swarm, in: Proceedings of the Congress on Evolutionary Computation, 16-19 Jul 2000, La Jolla, 84-88.
Kuo, Y.M., Liu, C.W. and Lin, K.H. (2004). Evaluation of the ability of an artificial neural network model to assess the variation of groundwater quality in an area of blackfoot disease in Taiwan. Water Research, 38(1), 148-158.
Mirzavand, M., Sadati Nrjad, M. and Akbari, M. (2015). Simulation changes in groundwater quality with artificial neural network model (Case study: Kashan aquifer). Iranian J. of Natural Resources, 68 (1), 159-171. [in Persian]
Musavi-Jahromi, S.H. and Golabi, M. (2008). Application of artificial neural networks in the river water quality modeling: Karoon river. Iran. J. of Appl. Sci., 8, 2324-2328.
Najah, A., Elshafie, A., Karim, O.A. and Jaffar, O. (2009). Prediction of Johor river water quality parameters using artificial neural networks. European J. of Scientific Research, 28(3), 422-435.
" BY 4.0) -Creative Commons Attribution 4.0 International (CC "
Pollution is licensed under a
methods compare. Proceedings of 4Th National Congress on Civil Engineering; Tehran. [in Persian]
Noori, R., Karbassi, A.R., Moghaddamnia, A., Han, D., Zokaei-Ashtiani, M.H., Farokhnia, A. and Ghafari Gousheh, M. (2011). Assessment of input variables determination on the SVM model performance using PCA, Gamma test and forward selection techniques for monthly stream flow prediction. J. of Hydrol., 401(3-4), 177-189.
Noori, R., Khakpour, A., Omidvar, B. and Farokhnia, A. (2010). Comparison of ANN and principal component analysis-multivariate linear
regression models for predicting the river flow based on developed discrepancy ratio statistic. Expert Systems with Applications, 37(8), 5856-5862.
Velayati, S. (2008). Hydrogeological formations in soft and hard. 1ed Edition, University of Mashhad Press, 396p. [in Persian]
Wenxian, G. and Hongxiang, W. (2010). PSO optimizing neural network for the Yangtze river sediment entering estuary prediction. Sixth International Conference on Natural Computation.