DATA DRIVEN DEEP LEARNING MODEL FOR
PERFORMANCE ANALYSIS OF INDIAN CRICKET
Jalem Raj Rohit, Desidi Siva Prakash, Gatla Rajasekhar Reddy
[email protected], [email protected], [email protected] Centre of Systems Science
Indian Institute of Technology Jodhpur
V.V.M.S Chandramouli
Assistant Professor, Centre of Systems Science Indian Institute of Technology Jodhpur
ABSTRACT
In this paper we analyse the statistical behaviour and prediction analysis of performance of the Indian cricket players and the whole team. This is a refined work of existing models in the domain of cricket analytics. We propose a multi layered neural network architecture as a model and employed the Deep learning technique for estimation of the performance of individual players and the entire Indian cricket team. We design the data driven pipelines where the data is first cleaned and then by using statistical analysis, we estimate the consistency of the partnerships between the players. Finally, this data is used to process in the deep learning neural network through a parallel pipeline for the prediction of performance of the players.
Index Terms—Statistics, Deep Learning, Neural Networks, Sports, Cricket.
I. INTRODUCTION
Cricket is one of the most popular sports throughout Asia and through entire central Europe. In countries like India, Sri Lanka, Australia, Bangladesh and
Pakistan; cricket is worshipped like a religion and the players enjoy celebrity status in these countries. Huge amount of money is being spent on pre-match team selection analytics and post-match analytics. Furthermore, analysing the strength and weakness of the each player of the opposition team.
This research attempts to improve the standards and accuracy of such analysis by attempting to approach the problem from the data science point of view. We use main tools as, state-of-the-art deep learning algorithm, parallel computing method and advanced statistical techniques like the Mahalanobis metric. There are couple of models presented in the domain of cricket analytics [1], [3]. In this work, we propose a state-of- the-art predictor model which is the most flexible and accurate for implementation and prediction analysis.
for the neural network model. The concept of deep learning is then employed for the estimation, prediction and the error back-traction purpose of the analysis. The details of the process are described in Section VI.
Performance index of a player is defined based on the average and strike rate of a bowler and a batsman. It is calculated as:
Bowling/Batting index = [0.6 * (AR) + 0.4 * (SR)]
Where AR being the average runs scored by the batsman and the runs conceded by the bowler and SR being the strike rate of the bowler and the batsman. We calculate the performance index of each players of the Indian cricket team by using the deep learning technique. The results and the analysis of the research would aid the team staff in better selection and also help the team expect more reliable results, with a better accuracy. These results are shown and illustrated in the Section VIII.
Visualisations are very important for any statistical display, latest Python and JavaScript visualisations libraries are employed for the purpose.
II. DETAILS ABOUT DATA
The data is obtained from some of the top cricket websites. Highly efficient and flexible spider crawlers and scrapers are designed for efficiently obtaining the data from the cricket web pages.
The data contains complete details of the players which includes runs, strike-rate, average, Not-outs, number of innings, number of matches, fours and sixes. The number of matches, innings, wickets, 5-wicket hauls, strike-rate, average are considered for a bowler
The data is pre-processed in Excel and Python before sending into a statistical and visualisation pipeline are architected in Python and Javascript.
Figure: 1
Figure 1: The code of the spider written for fast and easy scraping of the data from the web pages.
Figure: 2
Figure 2: The code for the visualisation created for the player level analysis using the D3.js library of JavaScript
III. FEATURES OF DATA
The data primarily depends on the following features which are pivotal in both the statistical analysis and the deep learning implementation. They are:
• Strike Rate -- This metric is important for gauging the efficiency and the accuracy of a player throughout the game.
• Fours, Sixes and 5 wicket hauls – This is an important metric for analysing the performance and the consistency of a player in a game.
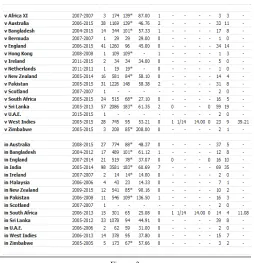
Figure 3: A sample data-sheet of a player overall one day International record.
Figure: 3
IV. DATA PRE-PROCESSING
After the data is scraped from various cricket websites, it is put through a pre-processing in both Excel and Python. Problems like, undesired HTML elements being scraped by the scraper due to the ever-changing structure of the website and properly determining the data-types of the fields are dealt with, during this phase.
Some examples can be the runs column of the data. Whenever a batsman end the game as not-out, the runs column is accompanied by a “ * ”, which would cause a problem when analysing the data in a higher level programming domain. So, such type of column level analysis is done in Excel.
As real-world data seldom follows the universally accepted Normal distribution model, the algorithms and techniques designed for analysis of such model generally
fail or perform very poorly of real-world data. So, advanced statistical methods like the Mahalanoblis distance is used for implementation for identifying the outliers and inconsistency present in the data.
V.
IMPORTANCE OF CORRELATION IN
CRICKET
Before getting into the deep learning implementation, a very important consideration to be taken into account is the consistency of the players. This means, the correlation between the playing styles of the players is very important while considering the pre-match team selection and analysing the post-match strategy. It is also very important while considering and designing the bowling and the batting order of the team.
For example, if the team has an attacking and a graceful player as the opening batsmen, the order can be prepared so that whenever a batsman gets dismissed, then the next batsman coming into the pitch can be of a similar type such that the dynamics of the play is not disturbed and the runs scoring is not scattered.
The Mahalanobis metric is used for measuring the correlation which gives out the level of correlation in the data. It also helps for the estimation of the spread of the data in the outlier analysis.
The spread of the data for two batsmen is visualised in the figure: 4. The axis represent the runs scored by the players and are zero-centred for convenient plot. So, using the Mahalanobis analysis, the most reliable, the prone, the outlier regions are visualised as black triangles.
Figure 4: Zero-cantered plot of two batsmen
The Mahalanobis distance is denoted by D which is used for estimating the distance for considering a data point as an outlier or a safe bet.
Where µ indicates the mean of the data spread, R indicates the extremity of the data spread and S indicates the spread of the data
The calculated Mahalanobis distance is used to construct the ellipse for estimating the data spread and player consistency, as illustrated in Figure 5.
Figure 5: Ellipse constructed from the Mahalanobis distance
The outliers are very important in the domain of sports analytics; they depict failure of a success of player or the scores in a match. The outliers in the strike rate of a particular match may speak a lot about both the player and the type of the match, because generally the high scoring games and the curtailed matches tend to pose high strike rates.
VI. MACHINE LEARNING APPROACH
Machine Learning is a technique which sends a training signal across the activation sites across the neurons in an architecture, which recognises features and patterns in the data, thus enabling efficient predictive analytics and accurate predictions on the testing data.
Implementations including the Bayesian analysis, single layered neural network and the deep learning multi-layered neural network analysis are tested on the training data and implemented on the training data.
Figure: 6 Input data sheet for the neural network
The predictor variable is considered as the performance of a player in a match. The formula for calculating the performance of a player is determined by using the number of runs, the strike-rate and the number of fours and sixes scored by a batsman. In case of a bowler performance, the fields including the number of wickets, average, strike-rate and the number of five wicket hauls will be taken into consideration.
The initial implementation is the single layered neural network which takes these four features as the inputs and tries to estimate the predictor variable which is the performance of the player.
A single layered neural network implementation with the proposed four input features and the hidden layer again consisting four activation sites, as shown in figure 7 is implemented.
Figure: 7 Single layer neural network
The activation function selected for the analysis is the sigmoid function which has shown excellent flexibility and compatibility with the shape and the characteristics of the data.
Several activation functions including the tangent hyperbolic function, etc have been considered and implemented during the cross-validation phase but the sigmoid function have turned out to be the most reliable and also have given a better accuracy, both owing to the shape and the type of the data. It is shown in Figure: 8.
The error control method is the back-propagation method through filtering the partial differential equations. The error is verified through a method of feed-back looping similar to the process in Signal and Systems. Below are the gradient formulae of the error back-propagation process in the gradients of a neural network, where ‘E’ signifies the error; ‘z’ is the output from each layer, ‘w’ are the weight metrics, ‘z’ and ‘t’ are the errors from each activation site in the hidden layers.
VII. MULTI LAYERED NEURAL NETWORK
After employing the single layered neural network, a neural network with the concept of deep learning is implemented. The concept of deep learning is very similar to trivial machine learning neural networks but involves more vigorous learning procedures and deep error tracking mechanisms which make the neuron much powerful and enables it to predict results very close to the data shape and understand the features better.
The problem of time complexity is handled using parallel computing mechanisms, which divide the data stream into multiple nodes/clusters and implement the neural network in each of the nodes and then maps the data back together to provide the result. This is the trivial implementation of the Map Reduce framework.
The deep learning neural network consists of four layers with four activation sites in each layer and the sigmoid function implemented in each activation site.
Figure: 9 Proposed network architecture
The proposed neural network shown in Figure: 9, is implemented for predicting the performance of players. It constitutes of four active neuronal layers with 16 activation sites running on the sigmoid function as neuronal activation function.
The error is back-propagated through the layer gradients as shown earlier. As the error gets refined and improved with every layer and every neuronal activation site, the deep learning implementation ensures better prediction; both considering the shape of the data and the type of the data.
VIII. RESULTS
The error has been calculated by cross-validation testing of the activation functions and the neural network layers.
The error obtained from the preliminary Bayesian analysis is close to 12%. The result has been improved by the single layered neural network; which is managed to score an accuracy of 7.82%.
Then, the deep learning implementation has managed to further improve on the accuracy of the implementation, after a series of selection in the cross-validation selection in the number of neural layers and also the selection of the activation functions. The number of layers and the activation function is selected after it does not both over-fit and under-over-fit the training data and also gives a satisfactory result over the validation data.
formula for the neural network; and finally the training data set is used for the testing and cross verification of the prediction algorithm.
The accuracy achieved through this deep learning implementation is 5.36%. This is clearly a refinement over the latest algorithm accuracy [1]; and the network architecture is designed so as to cope with the shape and the type of data and to be more flexible than the existing implementations, for new and incoming data.
The accuracy is calculated separately for the batsmen and the bowlers and averaged over; for determining the accuracy of the team.
The accuracy of the methods has shown as a graph in Figure:10. Here, 1 indicates the Bayesian analysis, 2- indicate the single layered simple neural network architecture and 3- indicates the deep learning implementation of the neural network.
Figure: 10 Method vs Percentage of error
The results for a batsman from the Python code of the neural network implementation are printed in Figure 11:
Figure: 11 Output of the deep learning code
IX. CONCLUSION
A pipeline has been designed; which consists of processes starting from designing the spider and the scrapers till the neural network implementation and the visualisations are designed.
Parallel computing machinery is implemented; which uses the concept of the Map Reduce framework; which divides the data into chunks of data and then sent to clusters for further analysis; and mapped together. This implementation is useful when huge chunks of ODI data is fed into the network.
selected; which possess activation sites consisting the sigmoid function.
The limitation in the size of data has always been a problem in sports analytics. As always in a data science problem; at least observations greater than 2k would be a meaningful contribution to the network model. So, the limitation of data and the player performance analysis of less experienced players contribute to the accuracy of the model.
X. SOFTWARE AND TECHNOLOGY USED
The following software and technology is used in the analysis of the data during this work.
• Python: The scrapers, crawlers and the neural network implementations are designed in Python.
• JavaScript: The d3.js visualisation library of JavaScript is used for the visualisation for the statistical analyses.
• H2O: The H2O big data science framework is implemented for designing the big data framework; for cases including data streaming and huge data chunks.
XI. REFERENCES
[1] Predicting Outcome of Cricket Matches: Prof. Kapil Garg, Prof. Debidatta Dwibedi, Prof. Archit Bansal, 2012
[2] Prediction of athletes performance using neural networks: An application in cricket team selection: Prof. Subramanian Rama Iyer, Prof. Ramesh Sharda, 2009
[3] Use of Artificial Neural Networks for prediction of cricket tournaments: Prof. Roy choudhary, Prof. Preeti Bhargava, Reena, Samta Kain, 2007
[4] AHP-Neural Network Based Player Price Estimation in IPL: Pabitra Kr. Dey, Abhijit Banerjee, Dipendra Nath, Ghosh, Abhoy Chand Modal, 2014
[5] Data Mining in Sport- A Neural Network Approach: John McCullagh, 2010