Geosci. Model Dev., 9, 111–124, 2016 www.geosci-model-dev.net/9/111/2016/ doi:10.5194/gmd-9-111-2016
© Author(s) 2016. CC Attribution 3.0 License.
Prediction of cloud condensation nuclei activity for organic
compounds using functional group contribution methods
M. D. Petters1, S. M. Kreidenweis2, and P. J. Ziemann3
1Department of Marine, Earth, and Atmospheric Sciences, North Carolina State University, Raleigh, NC, USA 2Department of Atmospheric Sciences, Colorado State University, Fort Collins, CO, USA
3Department of Chemistry and Biochemistry, Colorado University, Boulder, CO, USA Correspondence to: M. D. Petters ([email protected])
Received: 31 July 2015 – Published in Geosci. Model Dev. Discuss.: 1 September 2015 Revised: 4 December 2015 – Accepted: 16 December 2015 – Published: 19 January 2016
Abstract. A wealth of recent laboratory and field experi-ments demonstrate that organic aerosol composition evolves with time in the atmosphere, leading to changes in the in-fluence of the organic fraction to cloud condensation nuclei (CCN) spectra. There is a need for tools that can realistically represent the evolution of CCN activity to better predict in-direct effects of organic aerosol on clouds and climate. This work describes a model to predict the CCN activity of or-ganic compounds from functional group composition. Fol-lowing previous methods in the literature, we test the abil-ity of semi-empirical group contribution methods in Köh-ler theory to predict the effective hygroscopicity parameter, kappa. However, in our approach we also account for liquid– liquid phase boundaries to simulate phase-limited activation behavior. Model evaluation against a selected database of published laboratory measurements demonstrates that kappa can be predicted within a factor of 2. Simulation of homol-ogous series is used to identify the relative effectiveness of different functional groups in increasing the CCN activity of weakly functionalized organic compounds. Hydroxyl, car-boxyl, aldehyde, hydroperoxide, carbonyl, and ether eties promote CCN activity while methylene and nitrate moi-eties inhibit CCN activity. The model can be incorporated into scale-bridging test beds such as the Generator of Ex-plicit Chemistry and Kinetics of Organics in the Atmosphere (GECKO-A) to evaluate the evolution of kappa for a complex mix of organic compounds and to develop suitable parame-terizations of CCN evolution for larger-scale models.
1 Introduction
Organic compounds are an important contributor to the at-mospheric submicron aerosol (Jimenez et al., 2009). The or-ganic fraction is projected to increase in the future due to the confluence of a decreasing sulfate and nitrate burden and increases in the global secondary organic aerosol bur-den (Heald et al., 2008). An important unanswered question is how the organic influences the aerosol’s ability to serve as cloud condensation nuclei (CCN), and in turn modulate climate via indirect effects of aerosols on clouds and precip-itation (Andreae and Rosenfeld, 2008). Realistic prescribed variations in secondary organic aerosol hygroscopicity have demonstrable impacts on CCN number concentration (Mei et al., 2013) and can change the simulated global aerosol indi-rect forcing (AIF) by approx. one-sixth of the AIF simulated in a control case (Liu and Wang, 2010). To obtain a prognos-tic understanding of the contribution of the organic fraction to indirect aerosol forcing in future climates, models need improved schemes that map simulated organic aerosol com-position to hygroscopicity and CCN activity.
volatile (Goldstein and Galbally, 2007), more dense (Kuwata et al., 2012), more viscous (Sastri and Rao, 1992), and more CCN active (Suda et al., 2014).
Laboratory (George and Abbatt, 2010; Poulain et al., 2010; Cappa et al., 2011; Massoli et al., 2010; Lambe et al., 2011; Duplissy et al., 2011; Kuwata et al., 2013; Rickards et al., 2013; Suda et al., 2014) and field studies (Jimenez et al., 2009; Chang et al., 2010; Mei et al., 2013) have demon-strated a robust link between the aerosol oxidation state and the ability of the organic fraction to promote hygroscopic wa-ter uptake and CCN activity. Proxies from mass spectrometry such as the fragmentation peak f44 or the atomic oxygen-to-carbon ratio are often used to model the increase in hy-groscopicity. However, these correlations exhibit significant variability between studies and break down when applied at the compound level (Rickards et al., 2013; Suda et al., 2014). Chemistry models are already capable of simulating the molecular identities of species present in the condensed phase during multi-day evolution of diluting air parcels (Lee-Taylor et al., 2015). Mapping this speciated aerosol compo-sition to the aerosol hygroscopicity should ultimately per-mit quantification of changes in CCN number concentration (provided that the size distribution is also simulated) and associated effects on clouds and climate. Thermodynamic models should be able to predict CCN activity. Many ther-modynamic models have made use of activity coefficients predicted by the universal functional group activity coef-ficient (UNIFAC) group contribution method (Fredenslund et al., 1975). Several investigators have compared UNIFAC predictions of organic aerosol water content to experimental data (Saxena and Hildemann, 1997; Ming and Russell, 2001; Peng et al., 2001; Choi and Chan, 2002; Mochida and Kawa-mura, 2004; Marcolli and Peter, 2005; Moore and Raymond, 2008). Some of these comparisons prompted proposed revi-sions of specific group interaction parameters, e.g., [OH] and [H2O]. Several thermodynamic models that treat complex phase equilibria of multifunctional, multicomponent organic mixtures are based on UNIFAC activity coefficients (Ming and Russell, 2002; Raatikainen and Laaksonen, 2005; Top-ping et al., 2005; Amundson et al., 2007; Zuend et al., 2008; Compernolle et al., 2009). The development of these mod-els has been driven by the need to enable predictions over a wide range of conditions and compositions, including the ef-fect of liquid–liquid phase separation on gas-to-particle par-titioning (Zuend and Seinfeld, 2012; Topping et al., 2013). The prediction of CCN activity of organic compounds has re-ceived less attention. Rissman et al. (2007) used the aerosol diameter-dependent equilibrium model (ADDEM; Topping et al., 2005) with an underlying UNIFAC core to predict the relationship between critical supersaturation and dry for sev-eral dicarboxylic acid aerosols. To our knowledge no study to date has systematically focused on the prediction of CCN activity from thermodynamic models.
Here we build on this body of work to predict the con-tribution of a compound with known chemical structure to
the CCN activity of a particle of known size. The pro-posed model uses the UNIFAC equations (Fredenslund et al., 1975) with group interaction parameters form Hansen et al. (1991), Raatikainen and Laaksonen (2005), and Com-pernolle et al. (2009) to model activity coefficients and free energy of mixing. Liquid–liquid phase boundaries are deter-mined using the area method of Eubank et al. (1992). Molec-ular volume is estimated from elemental composition and adjustments for functional group composition using the ap-proach of Girolami (1994). The relationship between criti-cal supersaturation and dry diameter is then predicted us-ing Köhler theory (Seinfeld and Pandis, 2006). The basic model mechanics are similar to those employed in multicom-ponent phase equilibrium models (Ming and Russell, 2002; Raatikainen and Laaksonen, 2005; Topping et al., 2005; Amundson et al., 2007; Zuend et al., 2008) but limited in scope to binary compositions and with focus on accurately representing phase and water activity at conditions relevant at the point of CCN activation only. These predictions are val-idated by manually mapping chemical composition to UNI-FAC groupings and comparing modeled CCN activity against observations from a compiled library of recently published CCN data of mostly weakly oxidized hydrocarbons contain-ing a mixture of alcohol, carbonyl, aldehyde, ether, carboxyl, nitrate, and hydroperoxide moieties. The model is used to predict how the addition of one or more functional groups to otherwise similar molecules promotes CCN activity. Envi-sioned application to multi-component aerosols and contrasts with more complete thermodynamic models are discussed.
2 Model description 2.1 Köhler theory
The saturation ratio over a curved droplet is given by the Köhler equation
S=aw×exp
4σ
s/a(T )Mw
ρwRT D
, (1)
whereaw is the water activity,σs/ais the surface tension of the solution/air interface,T is temperature,Mwis the molec-ular weight of water,ρw is the density of pure water, R is the universal gas constant, andDis the wet drop diameter. Water activity depends on the water content and the amounts and identities of solutes in the nucleus. The principle water content variable used in this work is the mole fraction
xw=
nw
nw+Pins,i
, (2)
M. D. Petters et al.: Prediction of cloud condensation nuclei activity for organic compounds 113
that the particle is spherical and that the volume of water and solute are additive:
D= h(xw−1)−1
xw−xw
X i(εivwv
−1 s,i)−1
Dd3i1/3. (3) In Eq. (3)vwandvs,i are the molar volume of the water and solutes and εi are the volume fractions in the dry particle. Equation (3) is obtained by rearranging Eq. (7) in Petters et al. (2009a). The critical supersaturation required for an aque-ous solution droplet to activate into a cloud droplet is found by combining Eqs. (1) and (3) and finding thexw(orD) that maximizessc
sc= {max [aw
×exp
4σs/a(T )Mw ρwRTh(xw−1)−1
xw−xwPi(εivwv−s,i1)−1
D3di1/3
×100 %
xw∈ [0,1],
(4)
wheresc is the critical supersaturation in %. The variables that controlscarevs,aw, andσs/a. In this work it is assumed that surface tension is that of pure water. Discussion on this and other assumptions are provided at the end of this section. First the prediction ofvsandawfor organic compounds with known chemical structure is described.
2.2 Molar volume
Molar volume is calculated from the molecular formula us-ing the method of Girolami (1994). Each element is assigned a relative volume based on its location in the periodic table. The elemental volumes are summed and scaled by a con-stant factor to compute vs. If the oxygen is bound in the form of alcohol [OH] or carboxyl [C(=O)OH] moieties, the actual vs is smaller due to intramolecular bonding. There-fore,vs is decreased by 10 % for each [OH] or [C(=O)OH] group but by no more than 30 % of the molar volume derived from the elemental composition. Girolami (1994) tested this method for 166 liquids and reports agreement with observa-tionsvs∼ ±10 %. Barley et al. (2013) reviewed the perfor-mance of various methods for predicting molar volume using a test set of 56 multifunctional organic compounds and report similar scatter.
2.3 Water activity
Water activity is related to the mole fraction via
aw=γwxw, (5)
whereγw is the activity coefficient of water. Activity coef-ficients are estimated using the semi-empirical group con-tribution method UNIFAC (Fredenslund et al., 1975). The UNIFAC model describes a liquid solution that consists ofi
components. Each component is divided intokgroups. The activity coefficient of componentiin solution (γi) has con-tributions from combinatorial (γC) and residual parts (γR) lnγi =lnγiC+lnγ
R
i . (6)
The combinatorial part is computed via lnγiC=ln8i
xi
+z
2qiln
θi
8i
+li−
8i
xi X
jxjlj, (7a)
li=
z
2(ri−qi)−(ri−1); z=10, (7b)
θi=
qixi P
jqjxj
; 8i=
rixi P
jrjxj
, (7c)
ri = X
kv (i)
k Rk; qi= X
kv (i)
k Qk. (7d)
In Eqs. (7),xiis the mole fraction of componenti,θi, and8i are the average surface and segment fraction,zis the lattice coordination number,vk(i)is the number of groups of typekin componenti,Rk, andQk are the group volume and surface area parameters derived from Bondi (1964), andri and qi are the normalized van der Waals volume and surface area. The summationiorj is over all components in the mixture, including componenti.
The residual part is computed via lnγiR=X
kv (i) k
h
ln0k−ln0(i)k i
, (8a)
ln0k=Qk− h
1−lnX
m2m9mk
−X
m
2m9km P
n2n9nm
, (8b)
2m=
QmXm P
nQnXn
, (8c)
Xm= P
iv (i) mxi P
i P
kv (i) k xi
, (8d)
9mn=exp
−amn
T
. (8e)
In Eqs. (8),amnare empirically determined parameters,9mn is the group interaction parameter of groupmwithn,Xmis the mole fraction of groupmin the mixture,2mis the area fraction of groupm,0kis the group residual activity coeffi-cient, and0(i)k is the residual activity coefficient of groupk
in a reference solution containing only molecules of typei. Equations (8) are also used to compute0k(i). The summation
nor m is over all different groups in the mixture, and the summationkis over all groups in componenti.
are alkane [CHn], alcohol [OH], water [H2O], carbonyl [CHnC(=O)], aldehyde [HC(=O)], ether [CHn(O)], car-boxyl [C(=O)OH], nitrate [CHnONO2], and hydroperoxide [CHn(OOH)]. Interaction parametersamnbetween the main groups that are used in this work are tabulated in Table S1 in the Supplement. Some of the main groups have several subgroups, with each subgroup having unique volume and surface area parametersRkandQk. These are summarized in Table S2.
2.4 Phase equilibrium
For some xw liquid–liquid phase separation can occur. The normalized Gibbs free energy of the mixture, defined as the actual Gibbs free energy divided by the thermal energy, is needed to compute the number of thermodynamically stable phases in the system. For a binary system consisting of wa-ter (w) and a single solute (s), Gibbs energy is calculated from the activity coefficients via standard thermodynamic re-lationships (Prausnitz et al., 1999; Petters et al., 2009a)
1gmix=1gideal+1gexcess, (9a)
1gideal=xwlnxw+(1−xw)lnxs, (9b)
1gexcess=xwlnγw+(1−xw)lnγs, (9c) where1gmixis the normalized change in Gibbs free energy of the mixture,1gidealis the change in ideal Gibbs free en-ergy of the mixture (Raoult’s law), and 1gexcess is the ex-cess Gibbs free energy of mixing quantifying the deviation from Raoult’s law. In highly non-ideal solutions liquid–liquid phase separation may occur. Two compositionsxaandxb de-fine the water mole fraction of the two co-existing phases. Computationally,xaandxbcan be obtained from1gmix us-ing the area method (Eubank et al., 1992). Briefly, the state space is evaluated by computing the following area for all possible combinationsxIandxII
A(xI, xII)=
h
1gmix(xII)+1gmix(xI)
ixII−xI
2
−
Z xII
xI
1gmix(x)dx
. (10a)
Phase boundariesxaandxbexist if condition
A(xa, xb)=maxA(xI, xII); A >0 (10b) is satisfied. If multiple phases coexist in phase equilibrium, the Gibbs–Duhem relationship dictates that the chemical po-tential of each component is equal in all phases. Therefore the water activity inside the miscibility gap is constant and the values entering Eq. (4) are subject to the constraint
aw=
aw(xa)=aw(xb) for xa≤xw≤xb
γwxwelse.
(11)
We note that Eubank et al. (1992) algorithm can be ex-tended to n components. Other numerically efficient ap-proaches to find phase equilibrium, including those ofn com-ponent mixtures, are available in the literature (e.g., Amund-son et al., 2005, 2007; Zuend et al., 2010). CompariAmund-son for phase boundaries (xa, xb) calculated using standard UNI-FAC parameters and the Eubank method used in this model, and standard UNIFAC parameter and the algorithm in the UHAERO model (Amundson et al., 2007) are in good agree-ment and summarized in the Suppleagree-ment.
2.5 Model implementation
The model was implemented to run on a personal com-puter using the commercial MATLAB environment (Math-Works, Inc.). Alternatively, the code runs under the Octave environment, which is available as free software under the GNU General Public License. Correct implementation of the UNIFAC model was confirmed by comparing results from test mixtures against output from existing implementa-tions, which is further described in the Supplement. A pound is defined by specifying a count of subgroups com-prising the molecule. Equations (6)–(8) are solved to find
γw for n linearly spaced values within the domain xw ∈
[0.0001,0.9999]. Resultingγware parsed through Eqs. (9)– (11) to find the number of stable phases and to defineawover the entire domain. Theseaw are interpolated onto a higher resolution linearly gridded domain (mpoints) to improve the accuracy of the computation ofsc using Eq. (4). Values for
n and mare selected to balance computational speed and solution accuracy. Equations (6)–(8) have linear time com-plexity. Equations (9)–(11) have quadratic time comcom-plexity. Thus, the two algorithms have an order of O(n) and O(n2), respectively. Forn> 200, the overall model time complexity is O(n2). Forn >∼800 andm=10000, the resolution is suf-ficiently high so that the computedscbecomes independent of the choice ofn. All computations in this work were car-ried out forn=1000 andm=10000. Total model execution times for a single compound on an Intel(R) Core(TM) i7-2600 3.4 GHz microprocessor using a single core were 39 s with MATLAB version R2013a (8.1.0.604) 64 bit and 282 s with GNU Octave version 3.8.1 configured for 64 bit. 2.6 Hygroscopicity parameter
Equation (4) is solved to findscfor a specified dry diameter, fixedT =298.15 K andσs/a=0.072 J m−2. The result is ex-pressed in terms of the hygroscopicity parameterκ (Petters and Kreidenweis, 2007) that is defined via
sc=
(
max
"
D3−D3 d
D3−D3 d(1−κ)
exp
4σ
s/a
ρwRT D
# −1
)
×100 %
D∈ [Dd,∞].
(12)
M. D. Petters et al.: Prediction of cloud condensation nuclei activity for organic compounds 115
Kappa values obtained by fitting aDd,scpair to Eq. (12) with the assumed temperature and surface tension conceptually correspond to “apparent hygroscopicity at standard state” (Christensen and Petters, 2012). All values in this work are apparent κ’s. For simplicity these are denoted as κ without further qualification. Observations against which the model is evaluated are summarized in the Supplement and will be discussed further in Sect. 3.
2.7 Model assumptions and limitations
The model approach presented here is limited to liquid or-ganic compounds. This assumption is implied in both molar volume and UNIFAC activity coefficient calculations. Com-parison with observational CCN data where the reference phase state may be crystalline should be interpreted with cau-tion. For example, CCN experiments performed with crys-talline dicarboxylic acids demonstrate that for some com-pounds deliquescence, i.e., a solubility-controlled phase tran-sition, must precede droplet activation (Petters and Kreiden-weis, 2008). The UNIFAC approach is unable to accurately predict the solubility of these compounds if they existed in their crystalline solid state. If, however, the compound is in metastable aqueous solution, the UNIFAC prediction is expected to be valid to within the general accuracy of the specific model implementation. Under atmospheric condi-tions where the organic compounds are embedded in a ma-trix comprising a multitude of organic compounds, a liquid or amorphous solid is the prevailing stable phase (Marcolli et al., 2004). Furthermore, since metastable states with hy-groscopically bound water appear to dominate in the atmo-sphere (Rood et al., 1989; Nguyen et al., 2014) the liquid assumption may not be a serious limitation. Nonetheless, it is unclear whether the assumption of a liquid-like reference state is a serious limitation if the organic particles are highly viscous (Vaden et al., 2011; Shiraiwa et al., 2011; Zobrist et al., 2011; Renbaum-Wolff et al., 2013).
Other limitations of the UNIFAC method are the problems of accounting for group proximity effects and the inability to distinguish between isomers. Proximity effects occur when polar groups are separated by less than three to four car-bon atoms (Topping et al., 2005). Since only the number of groups of type i are specified, all isomers are modeled to have identicalκ values. Although experiments show that the location of the functional group has a small and systematic effect on the observedκ(Suda et al., 2014), those effects are relatively small and beyond the resolution of the model pre-sented here.
The application of Eq. (4) assumes that the surface ten-sion is that of pure water. Many organic compounds found in ambient organic aerosol lower the surface tension at the solution–air interface (Tuckermann and Cammenga, 2004; Tuckerman, 2007). However, several studies have demon-strated via experiment and theory that surfactant partition-ing between the bulk solution and the Gibbs surface phase
greatly diminishes the effect one would predict by apply-ing macroscopic surface tensions in Köhler theory (Li et al., 1998; Rood and Williams, 2001; Sorjamaa et al., 2004; Prisle et al., 2011). Neglecting to account for reduced sur-face tension and using water activity to estimate CCN activ-ity results in an underestimate ofκby∼30 % for the strong surfactant sodium dodecyl sulfate (Petters and Kreidenweis, 2013). We note that estimates of surface tension reduction for pure organic liquids can be obtained from critical pres-sure and boiling point (Sastri and Rao, 1995) and the Sprow and Prausnitz (1966) expression coupled with UNIFAC ac-tivity coefficients (Topping et al., 2005; Rafati et al., 2011). Combined with predictions of critical properties from func-tional group data (Joback and Reid, 1987), predicted binary surface tensions could be obtained for each compound. In-cluding surfactant partitioning in Eq. (4) is possible using the expressions in Petters and Kreidernweis (2013) or similar approaches (Sorjamaa et al., 2004; Raatikainen and Laakso-nen, 2011). Thorough validation against experimental data, including measurements of surface tension and CCN activ-ity, is needed before this approach should be adopted. 2.8 Relationship to other thermodynamic models and
application to multicomponent systems
The basic model functionality described here can also be obtained by appropriately initializing other multicomponent equilibrium models (Ming and Russell, 2002; Raatikainen and Laaksonen, 2005; Topping et al., 2005; Clegg and Sein-feld, 2006; Amundson et al., 2007; Zuend et al., 2008) with a set of binary water/organic solutions, parsing the output through a phase equilibrium module (if not included in the thermodynamic model itself) and the Köhler model. The pre-dicted CCN activity mostly depends on the underlying set of group interaction parameters. The output should match with the solution presented here if the same interaction parame-ter matrix is used. The main conceptual distinction between the approach proposed here and the approach employed by the more complex multicomponent models is our focus on predictions for binary organic/water solutions and limitation of the scope to a narrow range of water activities relevant to CCN activation only. Accurate representation of hygro-scopic growth ataw<∼0.99 is not required and would be of secondary concern when tuning interaction parameters.
We envision that the proposed specialized model approach can be used to categorize individual compounds into three miscibility regimes, analogous to the solubility regimes de-fined in Petters and Kreidenweis (2008). Regime I: the com-pound is CCN inactive and can be effectively modeled as
κ according to its molar volume. Once pure componentκ’s are predicted and stored in a database, the overall organic aerosol (OA)κ in mixed particles can be calculated quickly using the volume-weighted mixing rule (Petters and Krei-denweis, 2007). This compound-by-compound treatment of multicomponent mixtures assumes that solute–solute inter-actions are negligible. Salting-in and salting-out of solution effects are not captured. Effective κ values for compounds falling into the limited miscibility regime may be misrepre-sented in this treatment. Whether such effects are important will depend on the fraction of compounds in a mixture that fall into the limited miscibility regime and whether the pro-posed approach of intermediate complexity – modeling bi-nary solutions coupled with a linear mixing rule – ultimately proves sufficiently accurate to model the evolution of ambi-ent OA. In the following we use experimambi-ental data to demon-strate that the outlined UNIFAC model is suitable to catego-rize compounds into these three regimes.
3 Results and discussion
Experimental data for validation were compiled from the lit-erature. A detailed summary of the compound names, chem-ical structures, physicochemchem-ical properties, CCN observa-tions, and observedκapp’s is provided in the Supplement (Ta-bles S3–S7). This set features compounds with mostly lin-ear carbon backbones C4to C18 and O : C ratio between 0.1 and 1. The data are grouped into model compounds for pri-mary organic aerosol (POA; Table S3), functionalized hy-droperoxy ethers (Table S4), hydroxy nitrates (Table S5), carboxylic acids (Table S6), and carbohydrates (Table S7). Compounds included in Table S3 are long-chain molecules that have hydrophobic tails (> 14 methylene groups) and a single terminal carboxyl or hydroxyl group. Representa-tive example compounds are oleic acid or cetyl alcohol. Compounds in Table S4 are C14functionalized hydroperoxy ethers that have 10–12 methylene groups, at least one hy-droperoxide and ether group, and a second carbonyl, hydrop-erxide, or carboxyl group. Compounds in Table S5 are func-tionalized hydroxy nitrates featuring C10to C15carbon back-bones with 1–3 hydroxyl and 1–4 nitrate groups. Compounds in Table S6 are C4–C10 carboxylic acids that have 1–2 car-boxyl and up to one carbonyl group attached to the carbon backbone. Finally, compounds in Table S7 are C4–C18 car-bohydrates that have hydroxyl groups approximately equal to the number of carbon atoms. Data in Table S3 are taken from Raymond and Pandis (2002) and Shilling et al. (2007). Data in Tables S4 and S5 are taken from the Supplement of Suda et al. (2014). Data in Tables S6 and S7 are from vari-ous sources and are summarized in the Supplement of Petters et al. (2009b), which was updated with new compounds from Christensen and Petters (2012), and data were re-screened for quality. The compounds were selected to provide systematic variation in the number and type of functional groups with
otherwise similar structure, i.e., linear or weakly branched alkane backbone with variable carbon chain length.
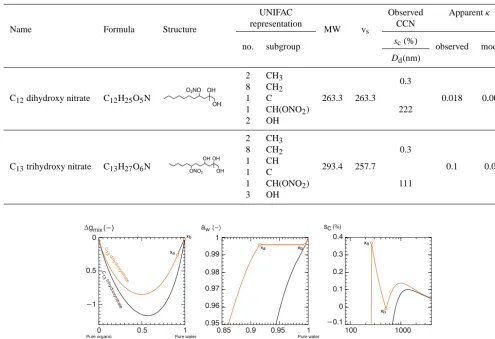
To illustrate model initialization and model output, two ex-ample compounds from the Supplement, C12 dihydroxy ni-trate and C13trihydroxy nitrate, are presented in Table 1. For some of the compounds density and solubility data are avail-able and those data are included in the Supplement. Tavail-able 1 shows how the molecular structure is decomposed into the subgroups understood by the UNIFAC and Girolami (1994) model framework. Detailed model output for the two exam-ple compounds is illustrated in Fig. 1. The predicted mole fraction dependence of 1gmix suggests that the C13 trihy-droxy nitrate is miscible with water in all proportions while the C12 dihydroxy nitrate is not. The dashed black line con-nectingxaandxbencloses the maximum positive area with the1gmixline and defines the two-phase region. Water ac-tivity derived from 1gmix is graphed in the middle panel. It shows that the miscibility gap for the C12 dihydroxy ni-trate occurs at water activity close to unity. Phase gaps at water activity near unity may result in miscibility-controlled cloud droplet activation (Petters et al., 2006), which is anal-ogous to solubility-/deliquescence-limited cloud droplet ac-tivation (Shulman et al., 1996; Hori et al., 2003; Bilde and Svenningsson et al., 2004; Kreidenweis et al., 2006; Petters and Kreidenweis, 2008). Köhler curves in the right panel demonstrate miscibility-limited activation behavior. For the C13 trihydroxy nitrate, the Köhler curve is smooth and ex-hibits a single maximum corresponding to the model criti-cal supersaturation. For the C12dihydroxy nitrate two max-ima appear. The first maximum corresponds to the point of incipient phase separation xa. The height of the miscibil-ity barrier depends on the dry diameter. For large dry par-ticles where the Kelvin term does not play a significant role, the supersaturation of point xa is reduced and the second classical Köhler maximum will control droplet activation. Similar complex Köhler curves have been reported previ-ously (e.g., Bilde and Svenningsson, 2004; Petters and Krei-denweis, 2008). Experiments with pure crystalline sparingly soluble organic compounds have demonstrated convincingly that the larger maximum indeed controls cloud droplet acti-vation for solubility-limited cases (Hori et al., 2003; Bilde and Svenningsson, 2004; Hings et al., 2008). Thescvs.Dd relationship for phase-controlled activation does not result in
κappthat is independent with respect toDd(Petters and Krei-denweis, 2008). Therefore, for compounds havingκ<∼0.06 where phase separation might play a role, the observedsc,
Ddpair is included in the data tables (Tables 1, S3–S7) and
κ values are computed from the observation and the model (Eq. 12) at the sameDd. Note that theDd-dependentκ only plays a role in a narrow range of miscibilities. Sufficiently soluble and truly insoluble substances are not affected. In summary, Table 1 and Fig. 1 demonstrate model input, il-lustrate model mechanics, and identify model outputs.
Ta-M. D. Petters et al.: Prediction of cloud condensation nuclei activity for organic compounds 117
Table 1. Properties for two example chemical compounds. UNIFAC representation indicated the number and type of subgroups to represent
the chemical structure: MW denotes molecular weight (g mol−1) andvs denotes the model predicted molar volume (cm3mol−1). CCN
reflects the observed supersaturation and dry diameter data pair obtained from the source (Suda et al., 2014) from which observedκwas
determined.
Name Formula Structure
UNIFAC
MW vs
Observed Apparentκ
representation CCN
no. subgroup sc(%) observed model
Dd(nm)
C12dihydroxy nitrate C12H25O5N
25
Table 1.
Properties for two example chemical compounds. UNIFAC representation indicated the
633
number and type of subgroups to represent the chemical structure MW denotes molecular weight
634
(g mol
-1) and
v
sdenotes the model predicted molar volume (cm
-3mol
-1). CCN reflects the
635
observed supersaturation and dry diameter data pair obtained from the source (Suda et al., 2014)
636
from which observed
was determined.
637
Name Formula Structure
UNIFAC representation
MW
vs
observed
CCN Apparent
# Subgroup sc (%) observed model
Dd(nm)
C12 di‐
hydroxy nitrate
C12H25O5N
2 CH3
263.3 263.3
0.3
0.018 0.008
8 CH2
1 C
222
1 CH(ONO2)
2 OH
C13 tri‐
hydroxy nitrate
C13H27O6N
2 CH3
293.4 257.7
0.3
0.1 0.07
8 CH2
1 CH
1 C
111
1 CH(ONO2)
3 OH OH O2NO OH OH ONO2 OH OH
2 CH3
263.3 263.3
0.3
0.018 0.008
8 CH2
1 C
222
1 CH(ONO2)
2 OH
C13trihydroxy nitrate C13H27O6N
25
Table 1.
Properties for two example chemical compounds. UNIFAC representation indicated the
633
number and type of subgroups to represent the chemical structure MW denotes molecular weight
634
(g mol
-1) and v
s
denotes the model predicted molar volume (cm
-3mol
-1). CCN reflects the
635
observed supersaturation and dry diameter data pair obtained from the source (Suda et al., 2014)
636
from which observed
was determined.
637
Name Formula Structure
UNIFAC representation
MW
vs
observed
CCN Apparent
# Subgroup sc (%) observed model
Dd(nm)
C12 di‐
hydroxy nitrate
C12H25O5N
2 CH3
263.3 263.3
0.3
0.018 0.008 8 CH2
1 C
222 1 CH(ONO2)
2 OH
C13 tri‐
hydroxy nitrate
C13H27O6N
2 CH3
293.4 257.7
0.3
0.1 0.07 8 CH2
1 CH
1 C
111 1 CH(ONO2)
3 OH OH O2NO OH OH ONO2 OH OH
2 CH3
293.4 257.7
0.3
0.1 0.07
8 CH2
1 CH
1 C
111
1 CH(ONO2)
3 OH
0 0.5 1
−1 0
xw (−) Δgmix (−)
0.85 0.9 0.95 1
0.95 0.96 0.97 0.98 0.99 1
xw (−) aw (−)
100
D (nm) sc (%)
xa xb
Pure water 1000 xa xb xa xb Pure water Pure organic −0.1 0 0.1 0.2 0.3 0.4 0.5 C 13 trihydroxynitrate C 12 dihydroxynitrate
Figure 1. Modeled1gmix(left), water activity (middle), and Köhler curves (right) for C12 dihydroxy nitrate and C13trihydroxy nitrate
(see Table 1). Open circles denote the mole fractionsxaandxbthat correspond to the envelope of compositions where liquid–liquid phase
separation is predicted for the C12dihydroxy nitrate.
bles S3–S7. A graphical illustration of these is presented in Fig. 2. To improve clarity, compounds with predicted and modeledκ< 0.001 are clustered in the lower left corner. Such lowκ’s correspond to compounds that are effectively CCN inactive. The range betweenκ=10−3and 10−5spans a nar-row range in thesc–Dd–κstate space that characterizes CCN activity (cf. Fig. 1 in Petters and Kreidenweis, 2007). Re-solving these differences is not particularly meaningful for organic dominated particles that typically haveDd< 300 nm. Furthermore, theκof an internally mixed particle is approx-imately the weighted volume fraction in the mixture. For
κ< 10−3the contribution to a mixed particle’sκ is insensi-tive to the exact value. Finally, although state-of-the-science size-resolved CCN measurements can resolve differences in
κ< 10−3, compound impurities can interfere. A 1 % impu-rity havingκ similar to ammonium sulfate would contribute
∼0.06 to a measured particleκ. In addition, solvent residuals
Predicted κ -CCN (−) 0.1 0.01 0.001 0.1 0.01 0.001
Acids (Table S6) Hydroxynitrates (Table S5) Carbohydrates (Table S7)
Hydroperoxide ethers (Table S4) POA model compounds (Table S3)
Maltotriose Sucrose Glucose Threitol Stearic acid Palmitic acid Myristicacid Cetyl alcohol Oleic acid Hydroperoxide w/aldehyde
Hydroperoxide w/acid
Dihydroperoxide C12-DHN Azelaic acid Pimelic acid Adipic acid Succinc acid Maleic acid OH O HO O OH HO OH OH OH O HO O C13-DHN Ketoglutaric acid OH O HO O O OH O HO O OH OH OH CH2OH O O OH OH CH2OH O O OH OH OH CH2OH O C13-THN Glutaric acid C11-DHN C15-THN C14-THN C10-DHN C10-THN C11-DHN C12-THN Hydroperoxide ether C13-HN C14-DiN C14-TetraN C14-TriN C14-HN
C15-HN C15-DHN C14-DHN
Cis-pinonic acidOH O O O HO O OH O HO
O OOH
O O HO O O OH O HO O OH ONO2 OH OH R Tri-hydroxynitrate OH O2NO OH R Di-hydroxynitrate OH O2NO R Hydroxynitrate THN: DHN: HN: OH O HO O OH O OH HO O O O O HO OH OH OH OH H OH OH OH OH CH2OH CH2OH CH2OH HO O O O OH O HO O
Observed κ-CCN (−)
Typical range in CCN obs for a single compound
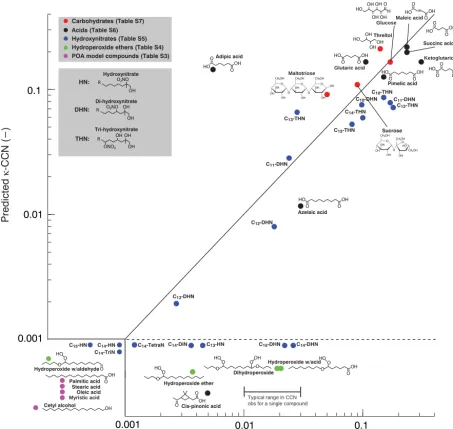
Figure 2. Model predicted vs. experimentally determinedκvalues. Valuesκ< 0.001 are classified as CCN inactive and are clustered in
the lower left corner of the graph. Colors are used to delineate the grouped source data in the Supplement. Selected structures from the
Supplement are included in the graph. CxHN, CxDHN, and CxTHN denote hydroxy nitrate, dihydroxy nitrate, and trihydroxy nitrate and
x denotes the total number of carbon atoms. C14DiN, C14TriN, C14TetraN denote the C14dinitrate, trintrate, and tetranitrate, respectively.
Points below the dashed line corresponds to compounds with predictedκ <0.001 and observedκ >0.001. Typical range of observedκCCN for peroxides is indicated by the horizontal bar.
barely larger than the cutoff for CCN inactive. Variation ofκ
between the C14 di-, tri- and tetra-nitrate (cf. Fig. 2 in Suda et al., 2014) implies that the trinitrate has lowerκ than the di- and tetra-nitrate, which suggests that some random vari-ability in the data is superimposed on the trend. Similarly, the observations show that the C14 and C15 dihydroxy ni-trate are slightly more CCN active than the C13dihydroxy ni-trate. Although this is possible such behavior is not plausible due to the well-established hydrophobic nature of the added CHx groups. One possible explanation for the discrepancies
M. D. Petters et al.: Prediction of cloud condensation nuclei activity for organic compounds 119
Another notable outlier is adipic acid. Here, the observed
κ< 0.01 corresponds to the solubility-limited value that is referenced against its solid crystalline phase state. In con-trast, the predicted valueκ=0.14 is in good agreement with the molar volume prediction (κ=0.17; cf. Fig. 4 in Chris-tensen and Petters, 2012) and observed κ that adipic acid particles express when solubility limitations are removed (cf. Fig. 1 in Hings et al., 2008). This scenario was se-lected to illustrate the inability of the UNIFAC model to treat solid phases. It therefore cannot capture deliquescence and deliquescence-/solubility-limited activation. In atmospheric OA multiple organic compounds likely form an amorphous supercooled melt (Marcolli et al., 2004) and metastable aque-ous solutions are ubiquitaque-ous (Rood et al., 1989). Thus the metastable prediction would be valid to account for adipic acid in the context of atmospheric OA.
A series of carboxylic acids and carbohydrates cluster near the 1 : 1 line at κ>∼0.06. These compounds are generally highly functionalized having at least two carboxyl, hydroxyl, or carbonyl groups for every four carbon atoms. The O : C ra-tio always exceeds 0.5 and is close to 1 for many of the com-pounds. For the predictions, activity coefficients approach unity, compounds are miscible in water in all proportions, and modelκ’s closely track the prediction based on estimated molar volume. Overall comparison of predicted vs. observed
κ is approximately within a factor of 2 and this range is sim-ilar to predictions that are based on actual molar volume (cf. Fig. 2 in Petters et al., 2009b).
The series of hydroxy nitrates, dihydroxy nitrates, and tri-hydroxy nitrates for different carbon chain lengths also clus-ters near the 1 : 1 line. The spread is within approximately a factor of 2 and similar to that of the carboxylic acids and carbohydrates. These compounds span the entire range from
κ< 0.001 toκ∼0.1 and have as few as two hydroxyl and one nitrate group per 13 carbon atoms (C13 dihydroxy ni-trate). The model appears to accurately predict the influence of the methylene and hydroxyl groups on the transition from immiscible and CCN inactive to sufficiently miscible and CCN active according to the molar volume of the compound. For the C11, C12, and C13 dihydroxy nitrates, the predicted miscibility-limited activation demonstrated in Fig. 1 seems to adequately explain the transition. The accurate model pre-diction of this sensitive transition regime is encouraging, es-pecially since no adjustment was made to theamngroup in-teraction parameters for [OH], [CHx], and [H2O] groups.
In summary, Fig. 2 demonstrates four capabilities of the model. First, the model has good skill in correctly classi-fying effectively CCN inactive compounds (κ< 0.001). Sec-ond, the model captures the molar volume-dependent acti-vation of highly functionalized compounds (low molecular weight dicarboxylic acids and polysaccharides). Scatter be-tween predicted and observed κ is approximately within a factor of 2 and considered acceptable taking into account the considerable diversity in the underlying CCN data. We note that uncertainties in molar volume estimation ofvs∼ ±10 %
stemming from the Girolami (1994) method correspond to
±10 % error in predicted κ for these compounds, which is significantly less than the observed scatter in the data (Pet-ters et al., 2009b). Third, the model predicts that miscibility limitations are the cause for poor CCN activity of weakly functionalized hydrocarbons, and the phase separation in-formation can be used to quantitatively predict the transi-tion between sufficiently miscible and effectively immisci-ble species. Finally, the model seems to accurately capture the main functional group dependencies observed previously (Suda et al., 2014): a strong promoting effect of hydroxyl, a weak promoting effect for hydroperoxides, a negligible or inhibiting effect of nitrate, and inhibiting effect of methy-lene groups on CCN activity. How, then, can one quantify the model sensitivity ofκto the addition of functional groups to otherwise similar molecules?
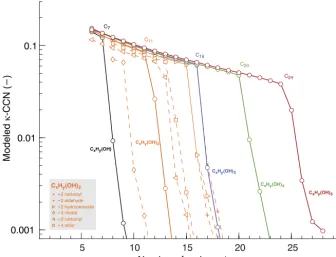
Simulation of homologous series can be used to derive these sensitivities. Figure 3 shows modeledκ’s for a series of functionalized n-alkanes. The gradual decreasing trend of κ with increasing carbon number is due to the increase in molar volume. A steep decline is observed when a critical carbon number is exceeded. Beyond this point the additional methylene groups reduce the miscibility with water and render the compound effectively CCN inactive. For example, CCN activity for a C16 trihydroxy alkane is controlled mostly by molar volume while C18 trihydroxy alkane is effectively CCN inactive. The critical carbon number is C7, C12, C16, C20, and C24 for the mono-, di-, tri-, tetra-, and penta-hydroxy alkanes, respectively. Starting with an n-alkane, the most dramatic effect of adding functional groups is to render the molecule miscible with water. Contrasting the critical carbon number for different homologous series can be used as a measure of a particular groups’ ability to transform the molecule such that it is sufficiently miscible in water and can express its molar volume κ. The hydroxy alkane series shows that approximately one hydroxyl group is needed to compensate for the addition of four methylene groups (i.e., to maintain miscibility at the composition of the critical carbon number), expressed as a ratio, 1[CHn]/1[OH]∼ −4/1. Similar ratios for the other groups are derived from the shifts in the dihydroxy alkane series upon further functionalization:
1[CHn]/1[C(=O)OH] ∼ −5/2, 1[CHn]/1[CHnC(=O)]
∼ −2/3, 1[CHn]/1[HC(=O)] ∼ −4/2,
1[CHn]/1[CHn(O)] ∼ −2/4, 1[CHn]/1[CHn(OOH)]
∼ −2/2, 1[CHn]/1[CHnC(=O)] ∼ −2/3, and
0.001 0.01 0.1
Modeled
κ
-CCN (−)
5 10 15 20 25 30
Number of carbon atoms CxHy(OH)
CxHy(OH)2
CxHy(OH)3
CxHy(OH)4
CxHy(OH)5 C16
C7
C11
C20
C24
+4 ether +2 carboxyl
+2 hydroperoxide +2 aldehyde
+3 nitrate +3 carbonyl CxHy(OH)2
Figure 3. Modeledκvalues for homologous series of functionalizedn-alkanes. Solid lines correspond to alkanes with 1–5 non-terminal
hydroxyl groups. Orange dashed lines correspond to further functionalized dihydroxy alkanes as described in the legend. Colored carbon numbers (C7, C12, C16, C20, and C24) correspond to the largest carbon number without miscibility-limited activation for the respective
hydroxy alkanes series.
NO3radicals (Suda et al., 2014, their Supplement), and the known low miscibility of organic nitrates in water (Boschan et al., 1955). Furthermore, sorting of the different functional groups is qualitatively consistent with the sensitivity of κ
to the addition of functional groups derived from CCN data (Table S5, Suda et al., 2014).
Treatment of OA evolution in the atmosphere
The computational speed of the model is relatively slow. The slow speed is due to the need to evaluate the entire range of mole fractions in order to determine the phase bound-aries. Improvement in model execution speed is likely pos-sible via algorithm optimization. Furthermore, parallel ex-ecution of the code is possible. With a regular workstation it is feasible to perform offline computation of ∼106κ’s for a large set of compounds produced by the Generator of Explicit Chemistry and Kinetics of Organics in the Atmo-sphere (GECKO-A) or similar models. Once pure compo-nent κ’s are predicted, the evolution of the overall OA κ
in mixed particles can be calculated quickly using the lin-ear mixing rule (Petters and Kreidenweis, 2007), subject to the limitations of this approach discussed in Sect. 2. One additional limitation is the need for algorithms that auto-matically map the computer-generated simplified molecular-input line-entry system (SMILES) structures (e.g., Table 3 in Lee-Taylor et al., 2015) to UNIFAC groups. Several of these
structures are bridged and even manual mapping of those structures to UNIFAC groupings will necessitate definition of new groups with unknown volume, surface, and interac-tion parameters. Separate studies are needed to establish the minimal number of new groups that would be needed to ob-tain optimal coverage for the set of compounds of interest.
4 Summary and conclusions
pu-M. D. Petters et al.: Prediction of cloud condensation nuclei activity for organic compounds 121
rity, uncertainty in dry particle phase state, and insufficiently tuned group interaction parameters. However, more system-atic data on weakly functionalized compounds, including re-peat studies, are needed before a retuning of parameters is justified. The model makes new predictions about the relative effectiveness of the groups in promoting miscibility. Most notably, it predicts that hydroperoxides have much less of an effect than hydroxyl, which is slightly surprising since one would expect the hydrogen bonding to be similar. The model state space can serve as a rough guide to define test condi-tions to quantify via experiment the effectiveness of adding one or more functional groups to a carbon backbone.
Although this work is limited to a few functional groups, the presented framework is general since interaction parame-ters are available for a wide range of groups. For atmospheric purposes, amines, olefins, and aromatic compounds are the most relevant groups that need to be added. Few, if any, sys-tematic CCN data for these groups are available. However, the success of the current model to estimate κ without the need to tune parameters could be taken as an indication that first-order predictions can be obtained until such data become available.
5 Code availability
Source code and example scripts demonstrating model ini-tialization for the compounds presented in this study are available as Supplement to this manuscript.
The Supplement related to this article is available online at doi:10.5194/gmd-9-111-2016-supplement.
Acknowledgements. This work was funded by the Department of
Energy, Office of Biological and Environmental Sciences under grant DE-SC0010470.
Edited by: A. Archibald
References
Amundson, N. R., Caboussat, A., He, J. W., and Seinfeld, J. H.: An optimization problem related to the modeling of atmospheric organic aerosols, C. R. Acad. Sci. Paris Ser. I, 340, 765–768, doi:10.1016/j.crma.2005.04.018, 2005.
Amundson, N. R., Caboussat, A., He, J. W., Martynenko, A. V., Landry, C., Tong, C., and Seinfeld, J. H.: A new atmospheric aerosol phase equilibrium model (UHAERO): organic systems, Atmos. Chem. Phys., 7, 4675–4698, doi:10.5194/acp-7-4675-2007, 2007.
Andreae, M. O. and Rosenfeld, D.: Aerosol–cloud–
precipitation interactions, Part 1. The nature and sources
of cloud-active aerosols, Earth-Sci. Rev., 89, 13–41,
doi:10.1016/j.earscirev.2008.03.001, 2008.
Barley, M. H., Topping, D. O., and McFiggans, G.: The critical assessment of liquid density estimation methods for multifunc-tional organic compounds, J. Phys. Chem. A, 117, 3428–3441, doi:10.1021/jp304547r, 2013.
Bilde, M. and Svenningsson, B.: CCN activation of slightly solu-ble organics: The importance of small amounts of inorganic salt and particle phase, Tellus, 56B, 128–134, doi:10.1111/j.1600-0889.2004.00090.x, 2004
Bondi, A.: van der Waals Volumes and Radii, J. Phys. Chem., 68, 441–451, doi:10.1021/j100785a001, 1964.
Boschan, R., Merrow, R. T., and van Dolah, R. W.: The chemistry of nitrate esters, Chem. Rev., 55, 485–510, doi:10.1021/cr50003a001, 1955.
Broekhuizen, K., Kumar, P. P., and Abbatt, J. P. D.: Partially sol-uble organics as cloud condensation nuclei: Role of trace solu-ble and surface active species, Geophys. Res. Lett., 31, L01107, doi:10.1029/2003GL018203, 2004.
Cappa, C. D., Che, D. L., Kessler, S. H., Kroll, J. H., and Wilson, K. R.: Variations in organic aerosol optical and hygroscopic proper-ties upon heterogeneous OH oxidation, J. Geophys. Res., 116, D15204, doi:10.1029/2011JD015918, 2011.
Chang, R. Y.-W., Slowik, J. G., Shantz, N. C., Vlasenko, A., Liggio, J., Sjostedt, S. J., Leaitch, W. R., and Abbatt, J. P. D.: The hy-groscopicity parameter (κ) of ambient organic aerosol at a field site subject to biogenic and anthropogenic influences: relation-ship to degree of aerosol oxidation, Atmos. Chem. Phys., 10, 5047–5064, doi:10.5194/acp-10-5047-2010, 2010.
Choi, M. Y. and Chan, C. K.: Continuous measurements of the water activities of aqueous droplets of water-soluble organic compounds, J. Phys. Chem. A., 106, 4566–4572, doi:10.1021/jp013875o, 2002.
Christensen, S. I. and Petters, M. D.: The role of temperature in cloud droplet activation, J. Phys. Chem. A., 116, 9706–9717, doi:10.1021/jp3064454, 2012.
Clegg, S. L. and Seinfeld, J. H.: Thermodynamic models of aque-ous solutions containing inorganic electrolytes and dicarboxylic acids at 298.15 K. I., The acids as non-dissociating components, J. Phys. Chem. A, 110, 5692–5717, doi:10.1021/jp056150j, 2006.
Compernolle, S., Ceulemans, K., and Müller, J.-F.: Influence of non-ideality on condensation to aerosol, Atmos. Chem. Phys., 9, 1325–1337, doi:10.5194/acp-9-1325-2009, 2009.
Duplissy, J., DeCarlo, P. F., Dommen, J., Alfarra, M. R., Metzger, A., Barmpadimos, I., Prevot, A. S. H., Weingartner, E., Tritscher, T., Gysel, M., Aiken, A. C., Jimenez, J. L., Canagaratna, M. R., Worsnop, D. R., Collins, D. R., Tomlinson, J., and Bal-tensperger, U.: Relating hygroscopicity and composition of or-ganic aerosol particulate matter, Atmos. Chem. Phys., 11, 1155– 1165, doi:10.5194/acp-11-1155-2011, 2011.
Eubank, P. T., Elhassan, A. E., Barrufet, M. A., and Whiting, W. B.: Area method for prediction of fluid-phase equilibria, Ind. Eng. Chem. Res., 31, 942–949, doi:10.1021/ie00003a041,1992.
Fredenslund, A., Jones, R. L., and Prausnitz, J. M.:
Group-contribution estimation of activity-coefficients
in nonideal liquid-mixtures, AIChE J., 21, 1086–1099,
George, I. J. and Abbatt, J. P. D.: Heterogeneous oxidation of atmo-spheric aerosol particles by gas-phase radicals, Nature Chem., 2, 713–722, doi:10.1038/nchem.806, 2010.
Girolami G. S.: A Simple “Back of the Envelope” Method for Estimating the Densities and Molecular Volume of Liquids and Volumes, J. Chem. Education, 71, 962–964, doi:10.1021/ed071p962, 1994.
Goldstein, A. H. and Galbally, I. E.: Known and Unexplored Or-ganic Constituents in the Earth’s Atmosphere, Environ. Sci. Technol., 41, 1514–1521, doi:10.1021/es072476p, 2007. Hansen, H. K., Rasmussen, P., Fredenslund, A., Schiller, M., and
Gmehling, J.: Vapor-liquid equilibria by UNIFAC group con-tribution. 5. Revision and extension, Ind. Eng. Chem. Res., 30, 2352–2355, doi:10.1021/ie00058a017, 1991.
Heald, C. L., Henze, D. K., Horowitz, L. W., Feddema, J., Lamar-que, J. F., Guenther, A., Hess, P. G., Vitt, F., Seinfeld, J. H., Goldstein, A. H., and Fung, I.: Predicted change in global sec-ondary organic aerosol concentrations in response to future cli-mate, emissions, and land use change, J. Geophys. Res., 113, D05211, doi:10.1029/2007jd009092, 2008.
Hings, S. S., Wrobel, W. C., Cross, E. S., Worsnop, D. R., Davi-dovits, P., and Onasch, T. B.: CCN activation experiments with adipic acid: effect of particle phase and adipic acid coatings on soluble and insoluble particles, Atmos. Chem. Phys., 8, 3735– 3748, doi:10.5194/acp-8-3735-2008, 2008.
Hori, M., Ohta, S., Murao, N., and Yamagata, S.: Activation capa-bility of water soluble organic substances as CCN, J. Aerosol. Sci., 34, 419–448, doi:10.1016/S0021-8502(02)00190-8, 2003. Huff Hartz, K. E., Tischuk, J. E., Chan, M. N., Chan, C. K.,
Don-ahue, N. M., and Pandis, S. N.: Cloud condensation nuclei acti-vation of limited solubility organic aerosol, Atmos. Environ., 40, 605–617, doi:10.1016/j.atmosenv.2005.09.076, 2006.
Jimenez, J. L., Canagaratna, M. R., Donahue, N. M., Prevot, A. S., Zhang, Q., Kroll, J. H., DeCarlo, P. F., Allan, J.D., Coe, H., Ng, N. L., Aiken, A. C., Docherty, K. S., Ulbrich, I. M., Grieshop, A. P., Robinson, A. L., Duplissy, J., Smith, J. D., Wilson, K. R., Lanz, V. A., Hueglin, C., Sun, Y. L., Tian, J., Laaksonen, A., Raatikainen, T., Rautiainen, J., Vaattovaara, P., Ehn, M., Kul-mala, M., Tomlinson, J. M., Collins, D. R., Cubison, M. J., Dun-lea, E. J., Huffman, J. A., Onasch, T. B., Alfarra, M. R., Williams, P. I., Bower, K., Kondo, Y., Schneider, J., Drewnick, F., Bor-rmann, S., Weimer, S., Demerjian, K., Salcedo, D., Cottrell, L., Griffin, R., Takami, A., Miyoshi, T., Hatakeyama, S., Shimono, A., Sun, J. Y., Zhang, Y. M., Dzepina. K., Kimmel, J. R., Sueper, D., Jayne, J. T., Herndon, S. C., Trimborn, A. M., Williams, L. R., Wood, E. C., Middlebrook, A. M., Kolb, C. E., Baltensperger, U., and Worsnop, D. R.: Evolution of organic aerosols in the atmo-sphere, Science, 326, 1525–1529, doi:10.1126/science.1180353, 2009.
Joback, K. G. and Reid, R. C.: Estimation of pure-component prop-erties from group-contributions, Chem. Eng. Commun., 57, 233– 243, doi:10.1080/00986448708960487, 1987.
Kreidenweis, S. M., Petters, M. D., and DeMott, P. J.: Deliquescence-controlled activation of organic aerosols, Geo-phys. Res. Lett., 33, L06801, doi:10.1029/2005GL024863, 2006. Kroll, J. H. and Seinfeld, J. H.: Chemistry of secondary ganic aerosol: Formation and evolution of low-volatility or-ganics in the atmosphere, Atmos. Environ., 42, 3593–3624, doi:10.1016/j.atmosenv.2008.01.003, 2008.
Kuwata, M., Zorn, S. R., and Martin, S. T.: Using elemental ratios to predict the density of 167 organic material composed of car-bon, hydrogen, and oxygen, Environ. Sci. Technol., 46, 787–794, doi:10.1021/es202525q, 2012.
Kuwata, M., Shao, W., Lebouteiller, R., and Martin, S. T.: Classify-ing organic materials by oxygen-to-carbon elemental ratio to pre-dict the activation regime of Cloud Condensation Nuclei (CCN), Atmos. Chem. Phys., 13, 5309–5324, doi:10.5194/acp-13-5309-2013, 2013.
Lambe, A. T., Onasch, T. B., Massoli, P., Croasdale, D. R., Wright, J. P., Ahern, A. T., Williams, L. R., Worsnop, D. R., Brune, W. H., and Davidovits, P.: Laboratory studies of the chemical composi-tion and cloud condensacomposi-tion nuclei (CCN) activity of secondary organic aerosol (SOA) and oxidized primary organic aerosol (OPOA), Atmos. Chem. Phys., 11, 8913–8928, doi:10.5194/acp-11-8913-2011, 2011.
Lee-Taylor, J., Hodzic, A., Madronich, S., Aumont, B., Camredon, M., and Valorso, R.: Multiday production of condensing organic aerosol mass in urban and forest outflow, Atmos. Chem. Phys., 15, 595–615, doi:10.5194/acp-15-595-2015, 2015.
Li, Z., Williams, A. L., and Rood, M. J.: Influence of soluble sur-factant properties on the activation of aerosol particles containing inorganic solute, J. Atmos. Sci., 55, 1859–1866, 1998.
Liu, X. and Wang, J.: How important is organic aerosol hygroscop-icity to aerosol indirect forcing, Environ. Res. Lett., 5, 044010, doi:10.1088/1748-9326/5/4/044010, 2010.
Marcolli, C. and Peter, Th.: Water activity in polyol/water systems: new UNIFAC parameterization, Atmos. Chem. Phys., 5, 1545– 1555, doi:10.5194/acp-5-1545-2005, 2005.
Marcolli, C., Luo, B. P., and Peter, T.: Mixing of the organic aerosol fractions: Liquids as the thermodynamically stable phases, J. Phys. Chem. A, 108, 2216–2224, doi:10.1021/jp036080l, 2004. Massoli, P., Lambe, A. T., Ahern, A. T., Williams, L. R., Ehn, M.,
Mikkila, J., Canagaratna, M. R., Brune, W. H., Onasch, T. B., Jayne, J. T., Petaja, T., Kulmala, M., Laaksonen, A., Kolb, C. E., Davidovits, P., and Worsnop, D. R.: Relationship between aerosol oxidation level and hygroscopic properties of laboratory generated secondary organic aerosol (SOA) particles, Geophys. Res. Lett., 37, L24801, doi:10.1029/2010GL045258, 2010. Mei, F., Setyan, A., Zhang, Q., and Wang, J.: CCN
activ-ity of organic aerosols observed downwind of urban emis-sions during CARES, Atmos. Chem. Phys., 13, 12155–12169, doi:10.5194/acp-13-12155-2013, 2013.
Ming, Y. and Russell, L. M.: Predicted hygroscopic growth of sea salt aerosol, J. Geophys. Res., 106, 28259–28274, doi:10.1029/2001JD000454, 2001.
Ming, Y. and Russell, L. M.: Thermodynamic equilibrium of organic–electrolyte mixtures in aerosol particles, AIChE J., 48, 1331–1348, doi:10.1002/aic.690480619, 2002.
Mochida, M. and Kawamura, K.: Hygroscopic properties of lev-oglucosan and related organic compounds characteristic to biomass burning aerosol particles, J. Geophys. Res., 109, D21202, doi:10.1029/2004JD004962, 2004.
Moore, R. H. and Raymond, T. M.: HTDMA analysis of mul-ticomponent dicarboxylic acid aerosols with comparison to UNIFAC and ZSR, J. Geophys. Res.-Atmos., 113, D04206, doi:10.1029/2007jd008660, 2008.
M. D. Petters et al.: Prediction of cloud condensation nuclei activity for organic compounds 123
the Southern Oxidant and Aerosol Study, Atmos. Chem. Phys., 14, 10911–10930, doi:10.5194/acp-14-10911-2014, 2014. Peng, C., Chan, M. N., and Chan, C. K.: The hygroscopic
prop-erties of dicarboxylic and multifunctional acids: Measurements and UNIFAC predictions, Environ. Sci. Technol., 35, 4495–4501, doi:10.1021/es0107531, 2001.
Petters, M. D. and Kreidenweis, S. M.: A single parameter repre-sentation of hygroscopic growth and cloud condensation nucleus activity, Atmos. Chem. Phys., 7, 1961–1971, doi:10.5194/acp-7-1961-2007, 2007.
Petters, M. D. and Kreidenweis, S. M.: A single parameter repre-sentation of hygroscopic growth and cloud condensation nucleus activity – Part 2: Including solubility, Atmos. Chem. Phys., 8, 6273–6279, doi:10.5194/acp-8-6273-2008, 2008.
Petters, M. D. and Kreidenweis, S. M.: A single parameter repre-sentation of hygroscopic growth and cloud condensation nucleus activity – Part 3: Including surfactant partitioning, Atmos. Chem. Phys., 13, 1081–1091, doi:10.5194/acp-13-1081-2013, 2013. Petters, M. D., Kreidenweis, S. M., Snider, J. R., Koehler, K. A.,
Wang, Q., and Prenni, A. J.: Cloud droplet activation of polymer-ized organic aerosol, Tellus B, 58, 195–205, doi:10.1111/j.1600-0889.2006.00181.x, 2006.
Petters, M. D., Wex, H., Carrico, C. M., Hallbauer, E., Massling, A., McMeeking, G. R., Poulain, L., Wu, Z., Kreidenweis, S. M., and Stratmann, F.: Towards closing the gap between hy-groscopic growth and activation for secondary organic aerosol – Part 2: Theoretical approaches, Atmos. Chem. Phys., 9, 3999– 4009, doi:10.5194/acp-9-3999-2009, 2009a.
Petters, M. D., Kreidenweis, S. M., Prenni, A. J., Sullivan, R. C., Carrico, C. M., Koehler, K. A., and Ziemann, P. J.: Role of molecular size in cloud droplet activation, Geophys. Res Lett., 36, L22801, doi:10.1029/2009GL040131, 2009b.
Poulain, L., Wu, Z., Petters, M. D., Wex, H., Hallbauer, E., Wehner, B., Massling, A., Kreidenweis, S. M., and Stratmann, F.: To-wards closing the gap between hygroscopic growth and CCN activation for secondary organic aerosols – Part 3: Influence of the chemical composition on the hygroscopic properties and volatile fractions of aerosols, Atmos. Chem. Phys., 10, 3775– 3785, doi:10.5194/acp-10-3775-2010, 2010.
Prausnitz, J. M., Lichtenthaler, R. N., and Azevedo, E. G.: Molecu-lar thermodynamics of fluid-phase equilibria, Prentice Hall PTR, Upper Saddle River, NJ, USA, 1999.
Prisle, N. L., Dal Maso, M., and Kokkola, H.: A simple representa-tion of surface active organic aerosol in cloud droplet formarepresenta-tion, Atmos. Chem. Phys., 11, 4073–4083, doi:10.5194/acp-11-4073-2011, 2011.
Raatikainen, T. and Laaksonen, A.: Application of several ac-tivity coefficient models to water-organic-electrolyte aerosols of atmospheric interest, Atmos. Chem. Phys., 5, 2475–2495, doi:10.5194/acp-5-2475-2005, 2005.
Raatikainen, T. and Laaksonen, A.: A simplified treatment of sur-factant effects on cloud drop activation, Geosci. Model Dev., 4, 107–116, doi:10.5194/gmd-4-107-2011, 2011.
Rafati, A. A., Bagheri, A., Khanchi, A. R., Ghasemian, E., and Najafi, M.: Application of the UNIFAC model for pre-diction of surface tension and thickness of the surface layer in the binary mixtures, J. Colloid Interf. Sci., 355, 252–258, doi:10.1016/j.jcis.2010.12.003, 2011.
Raymond, T. M. and Pandis, S. N.: Cloud activation of single-component organic aerosol particles, J. Geophys. Res., 107, 4787, doi:4710.1029/2002JD002159, 2002.
Renbaum-Wolff, L., Grayson, J. W., Bateman, A. P., Kuwata, M., Sellier, M., Murray, B. J., Shilling, J. E., Martin, S. T., and Bertram, A. K.: Viscosity ofα-pinene secondary organic material and implications for particle growth and reactivity, P. Natl. Acad. Sci., 110, 8014–8019, doi:10.1073/pnas.1219548110, 2013. Rickards, A. M. J., Miles, R. E. H., Davies, J. F., Marshall, F. H.,
and Reid, J. P.: Measurements of the sensitivity of aerosol hygro-scopicity and the k parameter to the O/C Ratio, J. Phys. Chem. A, 117, 14120–14131, doi:10.1021/jp407991n, 2013.
Rissman, T. A., Varutbangkul, V., Surratt, J. D., Topping, D. O., McFiggans, G., Flagan, R. C., and Seinfeld, J. H.: Cloud con-densation nucleus (CCN) behavior of organic aerosol particles generated by atomization of water and methanol solutions, At-mos. Chem. Phys., 7, 2949–2971, doi:10.5194/acp-7-2949-2007, 2007.
Rood, M. J. and Williams, A. L.: Reply, J. Atmos. Sci., 58, 1468– 1473, 2001.
Rood, M. J., Shaw, M. A., Larson, T. V., and Covert, D. S.: Ubiqui-tous nature of ambient metastable aerosol, Nature, 337, 537–539, 1989.
Sastri, S. R. S. and Rao, K. K.: A new group contribution method for predicting viscosity of organic liquids, Chem. Eng. J., 50, 9–25, doi:10.1016/0300-9467(92)80002-R, 1992.
Sastri, S. R. S. and Rao, K. K.: A simple method to predict surface tension of organic liquids, Chem. Eng. J. Bioch. Eng., 59, 181– 186, doi:10.1016/0923-0467(94)02946-6, 1995.
Saxena, P. and Hildemann, L. M.: Water absorption by organics: Survey of laboratory evidence and evaluation of UNIFAC for es-timating water activity, Environ. Sci. Technol., 31, 3318–3324, doi:10.1021/es9703638, 1997.
Seinfeld, J. and Pandis, S.: Atmospheric chemistry and physics: from air pollution to climate change, Wiley, Inc., New Jersey, USA, 450 pp., 2006.
Shilling, J. E., King, S. M., Mochida, M., and Martin, S. T.: Mass spectral evidence that small changes 574 in composition caused by oxidative aging processes alter aerosol CCN properties, J. Phys. Chem., 111, 3358–3368, doi:10.1021/jp068822r, 2007.
Shiraiwa, M., Ammann, M., Koop, T., and Pöschl, U.:
Gas uptake and chemical aging of semisolid organic
aerosol particles, P. Natl. Acad. Sci., 108, 11003–11008, doi:10.1073/pnas.1103045108, 2011.
Shulman, M. L., Jacobson, M. C., Charlson, R. J., Synovec, R. E., and Young, T. E.: Dissolution behavior and surface tension ef-fects of organic compounds in nucleating cloud droplets, Geo-phys. Res. Lett., 23, 277–280, doi:10.1029/95GL03810, 1996. Sorjamaa, R., Svenningsson, B., Raatikainen, T., Henning, S.,
Bilde, M., and Laaksonen, A.: The role of surfactants in Köh-ler theory reconsidered, Atmos. Chem. Phys., 4, 2107–2117, doi:10.5194/acp-4-2107-2004, 2004.
Sprow, F. B. and Prausnitz, J. M.: Surface tensions of simple liquids, T. Faraday Soc., 62, 1097–1104, doi:10.1039/TF9666201105, 1966.
groups on organic aerosol cloud condensation nucleus activity, Environ. Sci. Technol., 48, 10182–10190, 2014.
Topping, D., Barley, M., and McFiggans G.: Including phase sep-aration in a unified model to calculate partitioning of vapours to mixed inorganic–organic aerosol particles, Faraday Discuss., 165, 273–288, doi:10.1039/C3FD00047H, 2013.
Topping, D. O., McFiggans, G. B., and Coe, H.: A curved multi-component aerosol hygroscopicity model framework: Part 2 – In-cluding organic compounds, Atmos. Chem. Phys., 5, 1223–1242, doi:10.5194/acp-5-1223-2005, 2005.
Tuckermann, R.: Surface tension of aqueous solutions of water-soluble organic and inorganic compounds, Atmos. Environ., 41, 6265–6275, 2007.
Tuckermann, R. and Cammenga, H. K.: The surface tension of aqueous solutions of some atmospheric water-soluble organic compounds, Atmos. Environ., 38, 6135–6138, 2004.
Vaden, T. D., Imre, D., Beránek, J., Shrivastava, M., and Zelenyuk, A.: Evaporation kinetics and phase of laboratory and ambient secondary organic aerosol, P. Natl. Acad. Sci., 108, 2190–2195, doi:10.1073/pnas.1013391108, 2011.
Ziemann, P. J. and Atkinson, R: Kinetics, products, and mechanisms of secondary organic aerosol formation, Chem. Soc. Rev., 41, 6582–6605, doi:10.1039/C2CS35122F, 2012.
Zobrist, B., Soonsin, V., Luo, B. P., Krieger, U. K., Marcolli, C., Peter, T., and Koop, T.: Ultra-slow water diffusion in aque-ous sucrose glasses, Phys. Chem. Chem. Phys., 13, 3514–3526, doi:10.1039/c0cp01273d, 2011.
Zuend, A. and Seinfeld, J. H.: Modeling the gas-particle parti-tioning of secondary organic aerosol: the importance of liquid-liquid phase separation, Atmos. Chem. Phys., 12, 3857–3882, doi:10.5194/acp-12-3857-2012, 2012.
Zuend, A., Marcolli, C., Luo, B. P., and Peter, T.: A thermodynamic model of mixed organic-inorganic aerosols to predict activity co-efficients, Atmos. Chem. Phys., 8, 4559–4593, doi:10.5194/acp-8-4559-2008, 2008.