R E S E A R C H
Open Access
Priority setting towards achieving
under-five mortality target in Africa in context of
sustainable development goals: an ordinary
least squares (OLS) analysis
Michael Acheampong
1*, Chukwudi Ejiofor
2, Abraham Salinas-Miranda
2, Bryana Wall
3and Qiuyan Yu
4Abstract
Background:Africa reduced its under-5 mortality rate (U5MR) by more than 50% during the MDGs era. However, it still has by far the highest average U5MR in the world–81 deaths compared to a global average of 43 deaths per 1000 births, with eight of the ten countries in the world with the highest child mortality rates. The primary objective of our study was to examine the socioeconomic, healthcare, and environmental determinants that most account for U5MR disparities between African countries.
Methods:We used a series of ordinary least squares (OLS) regression models to assess the effects of 14 distinct socioeconomic, environmental and healthcare variables that account for the high U5MR differentials that persist between African countries. We conducted our analysis on 43 countries for which data were available. Using a dummy variable, we also emphasized factors that may be accounting for the disparity between the eight worst-performing countries and the remainder of the continent.
Results:Among all the determinants analyzed in our study, the results reveal that the factors that most account for the inequities observed are, in order, expenditure on healthcare (p< 0.01), total fertility rate (p< 0.01), income per capita (p< 0.05), and access to clean water (p< 0.1).
Conclusions:Our results show that the gap between the best and worst performing countries in Africa can be significantly narrowed if government and donor interventions will target downstream factors such as improving education for mothers and sensitising them about birth control since fertility rate differences play a critical role. Improving accessibility to clean water sources to reduce outbreaks of diarrhea diseases is also observed as a critical factor.
Keywords:Under-five mortality, Sustainable development goals, Africa, Social determinants of health, Health literacy
Introduction
Reducing child mortality is a critical objective in the Sustainable Development Goals (SDGs). The SDG target for child mortality aims to reduce under-5 mortality (U5MR) to at least as low as 25 deaths per 1000 live
births [37]. While this ambitious SDG is commendable,
there are concerns that without adequate prioritization
of resources for the provision of maternal healthcare ser-vices, educational programs for mothers, and improving access to safe drinking water and sanitation, the new
U5MR target under the SDGs may not be achieved [1,
2]. This is because previous studies [3, 7, 9, 11, 26, 36] have long established that the aforementioned factors among other socioeconomic issues are key determinants that interact to determine U5MR differences within and between countries. For the preceding Millennium Devel-opment Goals (MDGs), the under-5 mortality target was not met (MDG 4A). The UN had set a goal to cut
© The Author(s). 2019Open AccessThis article is distributed under the terms of the Creative Commons Attribution 4.0
International License (http://creativecommons.org/licenses/by/4.0/), which permits unrestricted use, distribution, and
reproduction in any medium, provided you give appropriate credit to the original author(s) and the source, provide a link to the Creative Commons license, and indicate if changes were made. The Creative Commons Public Domain Dedication waiver (http://creativecommons.org/publicdomain/zero/1.0/) applies to the data made available in this article, unless otherwise stated. * Correspondence:[email protected]
1Center for Urban Ecology and Sustainability, Suffolk University, 8 Ashburton
Pl, Boston, MA 02108, USA
under-five mortality rate (U5MR) down by two-thirds between 1990 and 2015, but was only able to reduce it
by 53% from 91 to 43 deaths per 1000 [34] due to
per-sistent disparities across regions and countries [4, 22, 23].
At the end of the MDGs in 2015, the United Nations Children’s Fund estimated that 5.9 million children under the age of five died globally [34]. A disproportion-ate number of these deaths occurred in Africa, even though like other world regions, it was able to reduce its U5MR by over 50%. In sub-Saharan Africa, approxi-mately 1 child in 13 dies before his or her fifth birthday compared to only 1 in 189 in high-income countries
(United Nations Inter-agency Group for Child Mortality
Estimation [[32, 39]). However, such regional estimates mask important disparities that exist between countries within the continent. For instance, in sub-Saharan Af-rica, there are huge disparities that prevail between
countries [34, 38, 39]. Countries such as Liberia,
Rwanda, Malawi, and Madagascar all achieved a reduc-tion of more than 60% compared to the 1990 baseline [12,34]. Meanwhile, according to UNICEF report, eight of the ten countries around the world where a new born is most likely to die are located in the sub-Saharan re-gion, namely: Central African Republic (CAR), Somalia, Lesotho, Guinea-Bissau, South Sudan, Ivory Coast, Mali, and Chad [18,33].
It is necessary to determine contextual differences be-tween these eight worst performing countries and the rest of the continent. Acute illnesses such as malaria, diarrhea, and pneumonia among others still contribute to an inordinate amount of child deaths in sub-Saharan Africa, which can be tremendously reduced with im-proved antenatal and postnatal care. Although adequate investment into healthcare provision and services is still needed, action on the social determinants of health is also greatly needed to curtail child mortality in Africa, particularly the low level of education for many mothers [12,27,39].
Previous studies [1, 2] have examined the factors that most account for global U5MR disparities, in order to tailor intervention measures effectively to areas that need to be addressed. These studies have further illumi-nated that there are complexities and nuances that need deeper exploration to understand the most effectual areas for intervention to curb childhood mortality. In this regard, we argue that while understanding global disparities is important, it is critical to recognise that Af-rican countries have marked peculiarities that distin-guish them from other world regions. This study, therefore, builds on them by examining and understand-ing key determinants – healthcare accessibility, social,
economic, and environmental factors–that underlie the
disparities between African countries. Finally, we sought
to identify factors that most explain the gap in U5MR between the eight aforementioned UNICEF-identified worst performing countries for childhood survival and the rest of the continent. The results in the study will help interventions of policy makers and program plan-ners to appropriately target critical and most effectual areas in Africa, as well as help narrow the gap between the worst performing countries and the rest of the coun-tries in Africa.
Methods
Data and sources
As previously noted, this paper is among a series of studies carried out to identify important focal areas of intervention to reduce U5MR and builds on Acheam-pong et al. [1,2] by using the similar variables but limit-ing the scope to intra-Africa country differentials. We utilised data from the year 2010, which was the closest year with the most comprehensive data record for all variables of interest [2]. To demonstrate that data from 2010 can provide useful insight into what prevails cur-rently, we presented Fig.1(based on data obtained from
UN IGME)– the equal interval distributions of U5MRs
within Africa in 2010 and 2015 –which shows that the
U5MR distribution in Africa has been relatively constant over the years.
All data used in this study were secondary data
ob-tained from globally prominent databases (seeAppendix
A) such as the World Health Organization (WHO)
Glo-bal Health Expenditure Database [37–39], World Bank’s
World Development Indicators (WDI) database [31],
United Nations Educational, Scientific and Cultural
Organization ([35], the Central Intelligence Agency
(CIA) World Factbook [8], and UN IGME [14]. While it would be ideal to analyze data for all 54 African coun-tries, the dearth of data meant that we could carry out the analysis on 43 of the countries for which data were obtained. All eight countries identified as worst perform-ing countries in Africa with the exception of Somalia, for which data was unavailable, were included in the study. In addition, since the data precedes South Sudan’s independence, Sudan was used as a proxy. The total list of countries considered in the study are presented in Table1below.
In total, 14 variables were used as independent vari-ables (IV) in this study, while U5MR was the dependent variable. As shown in Table 2, thirteen of the 14 vari-ables were categorised into 4 distinct classes: healthcare accessibility, social, economic, and environmental. The fourteenth variable was a dummy variable for the seven among the eight countries in Africa currently
charac-terised by Howard [18] to be the most dangerous
countries, while 0 was assigned to the remaining 36 countries. Analysis with dummy variables served to re-veal if priority factors identified as accounting for the general differences in U5MR between African countries differed when the rest of the countries compared with the UNICEF-8.
Construction of models and various specifications
Ordinary least squares (OLS) regression models were used to ascertain the factors that account for inter-country U5MR differentials within Africa, as well as de-termine the factors that account for the differences between the UNICEF-8 and the rest of the countries on
Fig. 1Equal Interval Distribution of Under-five Mortality Rate in Africa for 2010 (left) and 2015 (right) (data obtained from UN IGME, 2016)
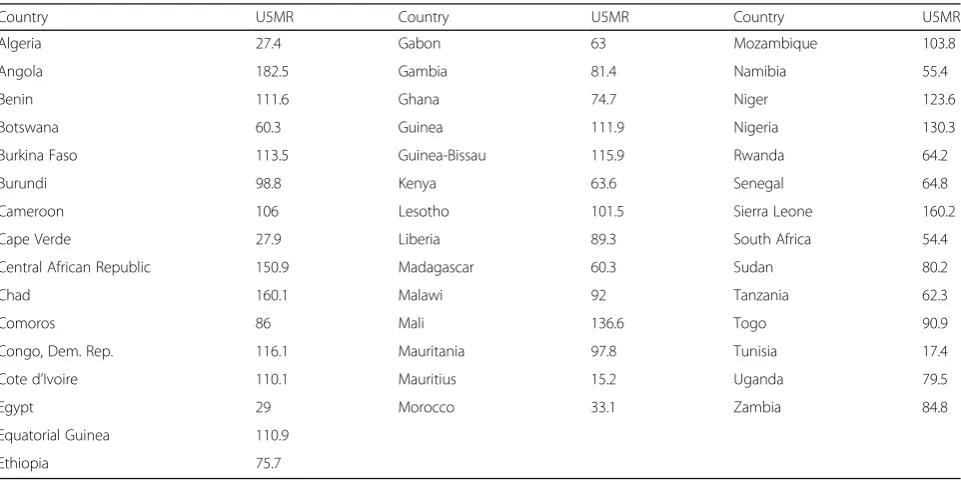
Table 12010 under-five mortality rates (per 1000 live births) in African countries considered in this study (UN IGME, 2016)
Country U5MR Country U5MR Country U5MR
Algeria 27.4 Gabon 63 Mozambique 103.8
Angola 182.5 Gambia 81.4 Namibia 55.4
Benin 111.6 Ghana 74.7 Niger 123.6
Botswana 60.3 Guinea 111.9 Nigeria 130.3
Burkina Faso 113.5 Guinea-Bissau 115.9 Rwanda 64.2
Burundi 98.8 Kenya 63.6 Senegal 64.8
Cameroon 106 Lesotho 101.5 Sierra Leone 160.2
Cape Verde 27.9 Liberia 89.3 South Africa 54.4
Central African Republic 150.9 Madagascar 60.3 Sudan 80.2
Chad 160.1 Malawi 92 Tanzania 62.3
Comoros 86 Mali 136.6 Togo 90.9
Congo, Dem. Rep. 116.1 Mauritania 97.8 Tunisia 17.4
Cote d’Ivoire 110.1 Mauritius 15.2 Uganda 79.5
Egypt 29 Morocco 33.1 Zambia 84.8
Equatorial Guinea 110.9
the continent. Assumptions of OLS were met by transforming data, in cases where needed, to improve linearity, normality, homogeneity of variances, and ho-moscedasticity [16,24].
Bivariate regression analysis
Before carrying out analysis based on all the variables, we conducted a simple bivariate regression analysis be-tween U5MR and each of the 13 independent variables to examine their relationships. For each model, a second was constructed with a dummy variable for the UNICEF-8 to examine if the strength of association remained constant or changed when the UNICEF-8 are compared with the rest of the continent. The following equations were used in the analyses:
MR=α+βnXn+ε…(1) MR=α+βnXn+βU8 +ε…(2) Where:
Equation 1 = Simple bivariate analysis between each independent variable and U5MR.
Equation 2 = Simple bivariate analysis between each
independent variable and U5MR, together with
UNICEF-8 dummy.
MR= the U5MR of any given country;
α= the Y-intercept.
U8= UNICEF-8 dummy;
β= slope of the UNICEF-8 dummy;
βn= the slope associated with the predictor variable under consideration;
Xn= any of the 13 independent variables studied.
ε= the error term.
Multivariate regression analysis
Several multivariate models were constructed to exam-ine the factors that most account for the U5MR differen-tials between African countries. In order to identify which factors carried the greatest explanatory power, we
constructed four models for each of the classes of vari-ables as identified in Table1, as well as a full model that combined all the variables. As in the case of the bi-variate analyses, each multibi-variate regression model was constructed with a second that contained the dummy variable for UNICEF-8. The purpose of this was to determine if factors that accounted for the dif-ferences between all countries within the continent together as obtained from the first model were differ-ent from the factors that account for the differences between the UNICEF-8 countries on one hand and the remaining African countries on another. Subse-quently, we dealt with issues pertaining to
multicolli-nearity (high correlations between variables) to
remove superfluous variables and aid in the ranking of the most important factors to consider. Below are the two formulas of full models with and without the UNICEF-8 dummy variable. Every other model is a subset that belongs under the full models:
MR=α+βn1Xn1 +βn2Xn2 +βn3Xn3 + …+ Bn13Xn13 +ε…(1)
MR=α+βn1Xn1 +βn2Xn2 +βn3Xn3 + …+ Bn13Xn13 +βU8 +ε…(2)
Where:
Equation 1 = Multivariate regression analysis between independent variables and U5MR.
Equation 2 = Multivariate regression analysis between
independent variables and U5MR, together with
UNICEF-8 dummy.
MR= the U5MR of any given country;
α= the Y-intercept;
U8 = UNICEF-8 dummy;
β= slope of the UNICEF-8 dummy;
βn1…βn13= the slope associated with each of the 13 predictor variables studied;
Xn1= Total Fertility Rate. Xn2= Adolescent Fertility Rate. Xn3= Total Adult Literacy Rate.
Xn4= Female Adult Literacy Rate.
Xn5= Rural Population.
Xn6= Gross National Income per Capita.
Xn7= Total Female Employment to Population Ratio.
Xn8= Percent Population Living under National
Pov-erty Line.
Xn9= Per Capita Total Expenditure on Health.
Xn10= Out-of-pocket Expenditure as a Percent of
Total Health Expenditure.
Xn11= Government Expenditure on Health as a
Per-cent of Total Health Expenditure.
Xn12= Percent Population with Access to Improved
Sanitation.
Xn13= Percent Population with Access to Improved
Drinking Water Source.
ε= the error term.
Table 2Independent Variables and their Respective Classes
Variables
Total Fertility Ratea Percent Population Living under National
Poverty Lineb
Adolescent Fertility Ratea Per Capita Total Expenditure on Healthc
Total Adult Literacy Ratea Out-of-pocket Expenditure as a Percent of
Total Health Expenditurec
Female Adult Literacy Ratea Government Expenditure on Health as a Percent of Total Health Expenditurec
Rural Populationa Percent Population with Access to
Improved Sanitationd
GNI per Capitab Percent Population with Access to
Improved Drinking Water Sourced
Total Female Employment to Population Ratiob
Notes:a
= Social;b
= Economic;c
= Healthcare Accessibility;d
Results
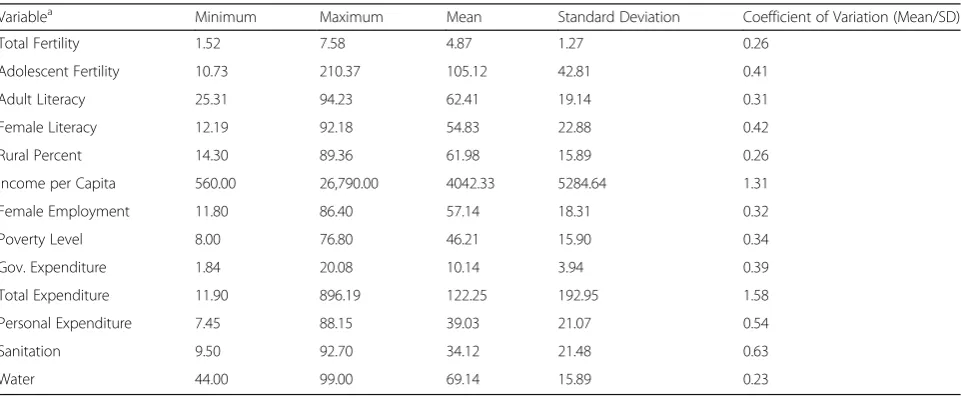
Summary statistics of independent variables
In Table3, we present the summary of all independent vari-ables utilised in this study. As shown in the table, variation in total expenditure on health among African countries is the highest among all the variables considered (CV = 1.58), followed by income per capita (CV = 1.31), while access to water exhibited the least variation (CV = 0.23).
Bivariate results
The results of simple regression analysis between each of the IVs and the DV are presented in Table4below. Unlike
in Acheampong et al. [2], not all IVs demonstrated a
strong association with U5MR differentials among coun-tries in Africa. For instance, percent rural population showed no relationship with U5MR both in the general disparity analysis, and comparison between the UNICEF-8 and the rest of the continent. Likewise, the total female employment to population ratio showed no relationship with U5MR in the general analysis. However, it gained a slight increase in statistical significance when the UNICEF-8 dummy variable was included (p< 0.1).
Multivariate results
In Table 5, we present the results for eight different
multivariate regression models (1–8) that examines the relationship between a combination of the different IVs and U5MR. In columns 1–4, we examined the effect of the four classes of IVs as described in Table1. Model for social variables is captured in column 1, while that of
economic variables is captured in column 2. Variables of accessibility to healthcare and environmental variables are captured by columns 3 and 4, respectively. As in the bivariate analysis, each model was ran twice with and without the UNICEF-8 dummy variable, in order to identify factors that generally explain U5MR disparities between African countries, and those that are prominent in explaining the difference that exist between the UNICEF-8 countries and the rest of Africa. In column 5, results for the fully specified model is presented, while column 6 presents results for the most parsimonious subset of the models for both full models with and with-out the dummy variable. In columns 7 and 8, results are presented after addressing issues of multicollinearity in the most parsimonious models in column 6, respectively for that without and with the UNICEF-8 dummy variable.
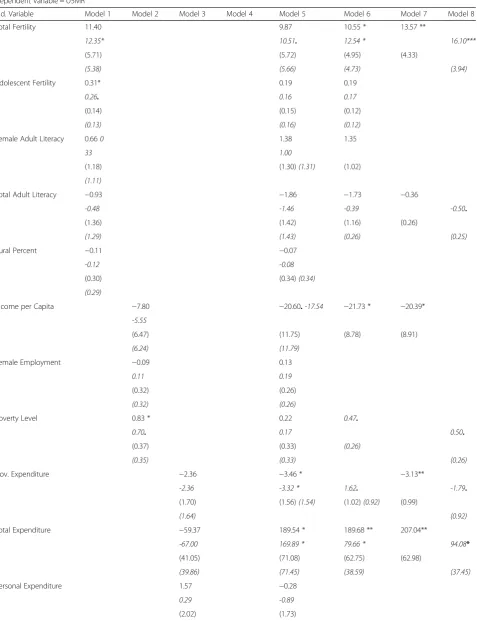
From the results in columns 1–4 in Table5, it is seen that among the 43 countries studied in Africa, all classes of independent variables are associated with the variabil-ity in U5MR across countries in the sub-region. This shows that there is a combination of factors from differ-ent classes that account for the variability. From the table, adjusted R2for first model (without dummy vari-able) in column 1 indicated that 48% of the differences in U5MR among African countries can be attributed to social factors. Within the model, only Total Fertility Rate (p< 0.1) and Female Adult Fertility Rate (0 < 0.05) dem-onstrated significant positive associations with U5MR. All other variables within this class were not significant.
Table 3Descriptive statistics for independent variables in the study
Variablea Minimum Maximum Mean Standard Deviation Coefficient of Variation (Mean/SD)
Total Fertility 1.52 7.58 4.87 1.27 0.26
Adolescent Fertility 10.73 210.37 105.12 42.81 0.41
Adult Literacy 25.31 94.23 62.41 19.14 0.31
Female Literacy 12.19 92.18 54.83 22.88 0.42
Rural Percent 14.30 89.36 61.98 15.89 0.26
Income per Capita 560.00 26,790.00 4042.33 5284.64 1.31
Female Employment 11.80 86.40 57.14 18.31 0.32
Poverty Level 8.00 76.80 46.21 15.90 0.34
Gov. Expenditure 1.84 20.08 10.14 3.94 0.39
Total Expenditure 11.90 896.19 122.25 192.95 1.58
Personal Expenditure 7.45 88.15 39.03 21.07 0.54
Sanitation 9.50 92.70 34.12 21.48 0.63
Water 44.00 99.00 69.14 15.89 0.23
Note: All variables have 43 observation, i.e. total number of countries for which data was obtained
a
Variable names are abbreviated all through the paper and provided below:
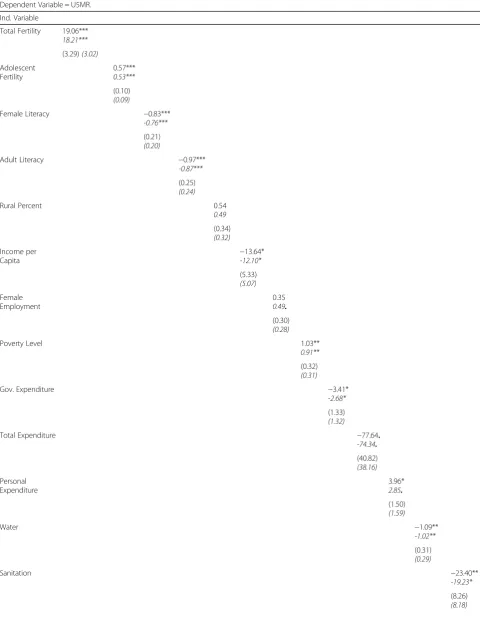
Table 4Results for bivariate relationships between each IV and the DV
Dependent Variable = U5MR.
Ind. Variable
Total Fertility 19.06***
18.21***
(3.29)(3.02)
Adolescent Fertility
0.57***
0.53***
(0.10)
(0.09)
Female Literacy −0.83***
-0.76***
(0.21)
(0.20)
Adult Literacy −0.97***
-0.87***
(0.25)
(0.24)
Rural Percent 0.54
0.49
(0.34)
(0.32)
Income per Capita
−13.64*
-12.10*
(5.33)
(5.07)
Female Employment
0.35
0.49.
(0.30)
(0.28)
Poverty Level 1.03**
0.91**
(0.32)
(0.31)
Gov. Expenditure −3.41*
-2.68*
(1.33)
(1.32)
Total Expenditure −77.64.
-74.34.
(40.82)
(38.16)
Personal Expenditure
3.96*
2.85.
(1.50)
(1.59)
Water −1.09**
-1.02**
(0.31)
(0.29)
Sanitation −23.40**
-19.23*
(8.26)
In the second model in the column (with dummy vari-able), the explanatory power of social factors for U5MR differentials increased to 54%, with a significant positive dummy variable (p< 0.05) that demonstrates that social factors greatly account for the U5MR differentials be-tween the UNICEF-8 and the rest of the continent. It is also worth noting that Total Fertility Rate (p< 0.05) in-creased in significance, while Female Adult Fertility Rate (0 < 0.1) decreased in significance when the dummy
vari-able was considered. In the column 2, adjusted R2 for
first model was 0.24. Within the model, only Percent Population Living under National Poverty Line showed a strong positive relationship with the DV (p< 0.05). Both GNI per capita and Total Female Employment to Popu-lation Ratio were not statistically significant. In the sec-ond model in the column (with dummy variable), the explanatory power of economic factors for U5MR differ-entials remained relatively constant, with a significant positive dummy variable (p < 0.05). This demonstrates that economic factors greatly account for the U5MR dif-ferentials between the UNICEF-8 and the rest of the continent, even though Percent Population Living under National Poverty Line decreased in significance (p< 0.1).
Adjusted R2for first model in column 3 showed that
only 16% of the differences in U5MR among African countries can be attributed to healthcare accessibility factors. In this model, none of the variables was signifi-cant. In the second model in the column (with dummy variable), the explanatory power of healthcare accessibil-ity factors for U5MR differentials increased to 21%, with a significant positive dummy variable (p < 0.1). However, similar to the first model, none of the variables showed statistical significance. The R2in column 4, showed that environmental variables as classified in Table 1 can ex-plain 24% of the differences in U5MR among African countries. The model showed that only Percent Popula-tion with Access to Improved Drinking Water Source showed a strong negative relationship with U5MR (p<
0.05). Percent Population with Access to Improved Sani-tation was not statistically significant. In the second model in the column (with dummy variable), the ex-planatory power of environmental factors for U5MR dif-ferentials increased to 21%, with a significant positive dummy variable (p < 0.05). This demonstrates that envir-onmental factors greatly account for the U5MR differen-tials between the UNICEF-8 and the rest of the continent, with Percent Population with Access to Im-proved Drinking Water Source remaining constant.
In Table 6 below, we rank order the t-statistic of the UNICEF-8 dummy variable as obtained in columns 1–4 to demonstrate which of the various classes has the highest explanatory power for the U5MR gap between the UNICEF-8 and the rest of the continent. The table shows that that the class of social factors (2.44) has the strongest effect on difference in U5MR between the UNICEF-8 and the rest of the continent. Environmental factors (2.34) was second on the list. Ranking third was the class of economic factors (2.24), while healthcare ac-cess (1.94) ranked fourth.
Column 5 contains the two full models, which yielded similar results albeit weakly as seen from the F-statistics of 5.21 and 5.12 (p< 0.001). Together, all the variables account for nearly 60% of the variability in U5MR across countries in Africa, with adjusted R2
values of 0.57 and 0.58 for the first and second models, respectively. In the first model, Total Fertility Rate (p< 0.1) and Per Capita Total Expenditure on Health (p< 0.05) were the only variables that exhibited positive associations, while Gross National Income per Capita (p < 0.1) and Government Expenditure on Health as a Percent of Total Health Ex-penditure (p < 0.05) were the only variables with a nega-tive association with U5MR. In the second model, all the variables maintained their significance except for Gross National Income per Capita that became statistically in-significant. It is important to observe that the UNICEF-8 dummy variable was not statistically significant in the
Table 4Results for bivariate relationships between each IV and the DV(Continued)
Dependent Variable = U5MR.
Ind. Variable
BP 30.69** 24.11* 29.20* 28.43* 35.13* 32.51* 40.44** 29.77* 28.99* 35.59* 25.92. 32.61* 28.69*
(10.52) (10.80) (12.25) (12.46) (13.73) (13.29) (13.79) (12.97) (13.92) (13.48) (14.77) (12.37) (13.62)
R2 0.45
0.52 0.460.52 0.280.37 0.270.35 0.060.19 0.140.25 0.200.03 0.200.30 0.140.22 0.080.22 0.150.21 0 .230.36 0.160.25
Notes: Standard errors are reported in parenthesis Entries in the table are standardised regression coefficients Results with regression with dummy variables are presented initalics
Number of observations = 43
.p< 0.1 *p< 0.05 **p< 0.01 ***p< 0.001
Table 5Results for multivariate regression models with U5MR in 2010 as DV
Dependent Variable = U5MR
Ind. Variable Model 1 Model 2 Model 3 Model 4 Model 5 Model 6 Model 7 Model 8
Total Fertility 11.40 9.87 10.55 * 13.57 **
12.35* 10.51. 12.54 * 16.10***
(5.71) (5.72) (4.95) (4.33)
(5.38) (5.66) (4.73) (3.94)
Adolescent Fertility 0.31* 0.19 0.19
0.26. 0.16 0.17
(0.14) (0.15) (0.12)
(0.13) (0.16) (0.12)
Female Adult Literacy 0.660 1.38 1.35
33 1.00
(1.18) (1.30)(1.31) (1.02)
(1.11)
Total Adult Literacy −0.93 −1.86 −1.73 −0.36
-0.48 -1.46 -0.39 -0.50.
(1.36) (1.42) (1.16) (0.26)
(1.29) (1.43) (0.26) (0.25)
Rural Percent −0.11 −0.07
-0.12 -0.08
(0.30) (0.34)(0.34)
(0.29)
Income per Capita −7.80 −20.60.-17.54 −21.73 * −20.39*
-5.55
(6.47) (11.75) (8.78) (8.91)
(6.24) (11.79)
Female Employment −0.09 0.13
0.11 0.19
(0.32) (0.26)
(0.32) (0.26)
Poverty Level 0.83 * 0.22 0.47.
0.70. 0.17 0.50.
(0.37) (0.33) (0.26)
(0.35) (0.33) (0.26)
Gov. Expenditure −2.36 −3.46 * −3.13**
-2.36 -3.32 * 1.62. -1.79.
(1.70) (1.56)(1.54) (1.02)(0.92) (0.99)
(1.64) (0.92)
Total Expenditure −59.37 189.54 * 189.68 ** 207.04**
-67.00 169.89 * 79.66 * 94.08*
(41.05) (71.08) (62.75) (62.98)
(39.86) (71.45) (38.59) (37.45)
Personal Expenditure 1.57 −0.28
0.29 -0.89
column, meaning that when considered together, the variables do not explain the difference in U5MR between the UNICEF-8 countries and the rest.
In column 6, the results of the most parsimonious models are presented. The two models (with and without the dummy variable) were stronger than the full model and yielded similar results, both with the ability to explain about 62% of U5MR differentials. There was, however, dif-ferences found in the variables of importance in the two models. In the first model, Total Fertility Rate (p< 0.05), and Per Capita Total Expenditure on Health (p< 0.01)
were the only variables that exhibited positive associations, while Government Expenditure on Health as a Percent of Total Health Expenditure (p< 0.05), Gross National In-come per Capita (p < 0.01) and Percent Population with Access to Improved Drinking Water Source (p< 0.1) were the only variables with a negative association with U5MR. In the second model, Total Fertility Rate (p < 0.05), Per-cent Population Living under National Poverty Line (p< 0.1) and Per Capita Total Expenditure on Health (p < 0.05) were the only variables that exhibited positive associations, while Government Expenditure on Health as a Percent of Total Health Expenditure (p < 0.1) was the only variable with a negative association with U5MR. It is important to observe that the UNICEF-8 dummy variable was statisti-cally significant (p < 0.1) in the column, meaning that the variables have a significant explanatory power for the U5MR differentials between the UNICEF-8 countries and the rest. One of the most important observations in the full and parsimonious models is that the relationship be-tween Per Capita Total Expenditure on Health and U5MR changed from negative in the bivariate analysis to a
Table 5Results for multivariate regression models with U5MR in 2010 as DV(Continued)
Dependent Variable = U5MR
Ind. Variable Model 1 Model 2 Model 3 Model 4 Model 5 Model 6 Model 7 Model 8
(2.06) (1.76)
Water −0.85 * −0.47 −0.53. −0.54.
-0.87 * -0.43
(0.35) (0.38) (0.29) (0.30)
(0.33) (0.38)
Sanitation −13.18 2.32
-8.56 3.33
(8.85) (10.10)
(8.62) (9.98)
BP 25.57* 30.45* 28.04. 29.73 * 16.15 17.98. 19.21.
(10.46) (13.57) (14.44) (12.70) (11.74) (9.84) (9.90)
Constant 31.63 118.85 201.00 * 104.28 *** −49.24 −30.12- −76.77
20.17 90.99 222.17* 175.67*** -48.81 106.04 -123.98.
(36.70) (67.28) (85.78) (28.33) (114.36) (75.00) 72.14
(34.77) (65.24) (83.61) (28.01) (113.64) (73.07) (72.61)
F-statistic 8.78 *** 4.06 * 3.58 * 7.49 ** 5.21 *** 9.44*** 11.32***
9.30 *** 4.61** 3.82* 7.37*** 5.12*** 10.87*** 12.12***
Adj. R2 0.48
0.54 0.240.26 0.160.21 0.240.31 0.570.58 0.620.62 0.60 0.61
Notes: Standard errors are reported in parenthesis Entries in the table are standardised regression coefficients Results with regression with dummy variables are presented initalics
Number of observations = 43
.p < 0.1 *p< 0.05 **p< 0.01 ***p< 0.001.
R-square values are set in boldface
Table 6Rank Ordering Classes of Variables
Ind. Variable β SE t-statistic
UNICEF-8*Social 25.57 10.46 2.44 *
UNICEF-8*Environmental 29.73 12.70 2.34 *
UNICEF-8*Economic 30.45 13,57 2.24 *
UNICEF-8*Healthcare Access 28.04 14.44 1.94.
Number of observations = 43
.p< 0.1
statistically significant positive relationship, when interact-ing with all other variables. This demonstrates the com-plexity and nuances that can exist in understanding factors that contribute to U5MR differences between countries.
Columns 7 and 8 contain the results of single models for the most parsimonious models without and with the dummy variables, respectively, after addressing issues of multicollinearity. After the variance inflation factor (VIF) analysis, we dropped variables of lower strength that decreased the significance of other variables in the models because they have a high correlation. In the col-umn 7 model, we dropped Adolescent Fertility Rate and Female Adult Literacy. The explanatory power of the model remained relatively constant, accounting for about 60% of the U5MR differentials between African countries. However, as it can be noticed, Total Adult Fertility increased in its significance (from p< 0.05 to p< 0.01), while other variables maintained their signifi-cance from the most parsimonious model. In the col-umn 7 model, we also dropped Adolescent Fertility Rate. In this case, as in the previous case, the explanatory power of the model remained relatively constant, with
an adjusted R2 of 0.61. The significant positive dummy
variable indicates that there is an increasing level of U5MR among the UNICEF-8 countries, compared with the rest of the countries that can be explained by differ-ences that exist in variables such as Total Fertility Rate, Total Adult Literacy, Percent Population Living under National Poverty Line, Government Expenditure on Health as a Percent of Total Health Expenditure, and Per Capita Total Expenditure on Health. It can also be noticed that while all variables maintained their level of significance Total Adult Fertility increased in its signifi-cance (fromp< 0.05 top< 0.001) and Total Adult Liter-acy gained significance (p< 0.1).
In Table7above, we presented a ranking of the signifi-cant variables in models from columns 7 and 8 as first and second model, respectively. This ranking is based on the absolute values of associated t-statistics, and repre-sents their order of importance on U5MR. In the first
model (without dummy variable), it shows that Per Capita Total Expenditure on Health on the U5MR differ-entials among African countries, followed by Govern-ment Expenditure on Health as a Percent of Total Health Expenditure. Total Fertility Rate, Gross National Income per Capita, and Percent Population with Access to Improved Drinking Water Source followed in that order. In second model (with dummy variable), it ranks the significant variables that explain the U5MR gap be-tween the UNICEF-8 and the rest of the African coun-tries in the following order of importance: Total Fertility Rate, Per Capita Total Expenditure on Health, Total Adult Literacy, Government Expenditure on Health as a Percent of Total Health Expenditure, and Percent Popu-lation Living under National Poverty Line.
Discussion
The primacy of social factors in the U5MR disparities discourse
In the analyses presented above, it is clear that under-standing the U5MR disparities among African countries is nuanced and multidimensional, as there is a combin-ation of important factors that belong to different
clas-ses, as was observed by Acheampong et al. [2]. The
findings of this study, however, emphasise the argument that regional priorities may differ drastically from the global as the factors identified in this study as critical to explaining the U5MR differentials within Africa are dif-ferent. From the Table 5, gap in social factors account most for U5MR disparities. This means that when con-sidered separately, addressing issues pertaining to social factors, in theory, will be the most efficient approach to closing the gap in U5MR. In the table, it is obvious that the gap in number of child births directly relates to gap in U5MR. While this holds true for the general dispar-ities around the continent, it is even more prominent for differences between UNICEF-8 countries and the rest of the continent. For this reason, education on birth con-trol and/or family planning would be critical to close the mortality gap on the continent, especially if the prime
Table 7Rank Ordering of Variables
First Model Second Model
Ind. Variable t-statistic Ind. Variable t-statistic
Total Expenditure 3.29 ** Total Fertility 4.09 ***
Government Expenditure 3.16 ** Total Expenditure 2.51 *
Total Fertility 3.13 ** Total Adult Literacy 1.98.
Income per Capita 2.29 * Government Expenditure 1.94.
Water 1.84. Poverty 1.90.
focus is to elevate performance of the UNICEF-8 countries.
Understanding the nuances in effect of health expenditure
One of the most critical findings in this study that high-lights the complex nuances inherent in the dynamics of U5MR pertains to Total Health Expenditure per Capita and Government Expenditure on Health. While the two variables individually showed a negative association with
U5MR across countries around the continent (Table 4),
the relationship of Total Health Expenditure reversed after interacting with other factors. As a matter of fact, it shows that in Africa, high expenditure on healthcare per capita is the most important factor that explains high mortality rate of children under 5 years old in countries. While this finding can be curious, the fact that the government ex-penditure have the opposite effect lends a possible inter-pretation. This combined with the importance of access to clean water in the ranking of factors in the first model in Table7can provide basis for speculation.
Total expenditure on health is a broader variable that incorporates health expense from all sources–personal, government, and donor, among others. According to Table 3, this is the factor for which African countries showed the greatest difference. Yet, it has the worst im-pact on under-5 mortality (Table5). Meanwhile, in gov-ernment expenditure on health, there was not as much differences between African countries (Table 3) and yet showed a positive impact of under-5 mortality (Table5). Countries with relatively better economies are most likely to accommodate most of their health expenditure on the government level [10, 21], as well as be able to provide more access to better quality drinking water due to the associated high capital cost [19]). [34]) has indi-cated that 90% of total diarrhea deaths in children, which can be drastically reduced with access to clean drinking water, occur in sub-Saharan Africa. This means that countries that are able to provide greater access to clean water will cut down the number of outbreaks and limit the need for external support. On the other hand, during the 2011 cholera outbreaks in West and Central Africa, there were about 2500 children lives that were claimed, most of them under the age of five [20]. Such epidemics in developing regions usually elicit international response ([5] [29]), which helps reduce the number of cas-ualties, but not until it has drastically increased the total expenditure on health per capita. This is because coun-tries that receive medical assistance from foreign profes-sionals are most likely to record higher cost per head than countries that do not require such, due to disparity of sal-aries and similar other factors between donor and recipi-ent countries. This finding reveals that intervrecipi-ention in
more downstream factors such as investing in
communities to improve their conditions of life may re-duce burden of incurring higher costs of intervening in times of outbreaks, but with limited success [15,28].
The role of literacy
Another important factor that surfaces within the Afri-can continent is the role of literacy rate, as seen in the
second model in Table 7. In the quest to narrow the
U5MR gap between the UNICEF-8 countries and the rest of the continent, it is important to recognise that in-vestment in education will be pertinent. This finding is not surprising as studies like those conducted by
Breier-ova and Duflo [6] and [25]) have demonstrated that
higher parental education associates negatively with child mortality. This is because the higher education achieved, the more knowledgeable parents are about pre-and-post-natal healthcare. Additionally, educated parents are less likely to be poor, as well as, less likely to have many children because studies have found that with more education, women are more likely to delay child birth and have fewer children [17,30].
Study’s implications for policies and interventions
The findings of this study supports the argument that it is important to under regional peculiarities when drawing global agenda and associated goals. It has revealed that priorities to address global U5MR differentials as in Acheampong et al. [2] may not necessarily be the same as those that require attention in addressing intra-regional disparities in Africa. Since most African countries share similar characteristics, addressing gap areas between them may not present as much a challenge as addressing gaps that exist between them and countries from other parts of the world with whom they share very little in common.
The study has shown that government and donor in-terventions will be more effectual should they be pro-active target downstream factors such as improving educating mothers and sensitizing them about birth con-trol since fertility rate differences greatly determine the difference in child mortality between countries. When interventions are knee-jerk and reactive, such as ship-ping medical personnel and medication from donor countries to contain outbreaks, the study indicates that they come with significantly higher cost but end up doing little to improve the situation. Another critical area that will help reduce the U5MR in Africa over the long term is improving accessibility to clean water sources, which is pertinent to reduce outbreaks of diar-rhea diseases that are responsible for claiming an inor-dinate amount of child lives in Africa.
Study limitations
around data availability. While this study utilizes as comprehensive data as reliable, and identifying with the
shortcomings of Acheampong et al. [2] as this work
builds on its findings and uses similar variables and principles, it is important to reiterate the limitations. First, it is important to note that not all African coun-tries were included in this study due to limited availabil-ity of data. Therefore, the 43 countries considered in this study are a convenient sample. However, it is the hope of the authors that 43 out of 54 countries can paint a general picture of the continent at large.
In addition, as previously noted, we made a decision to use 2010 as our reference year for this study because it is the closest year that contained most comprehensive data for most of the variables considered, as data many of the 14 variables were lacking. Even though we obtained the U5MR data for 2015, we deemed it important to use the 2010 to ensure alignment of data to understand the most important determinants of U5MR for the year 2010.
Another limitation of using 2010 data is that the UNICEF-8 countries are based on a UNICEF report from 2018 that is based on data for newborn mortality rate from 2016. This means that ranking of new born mortality rates in 2016 does not necessarily align with U5MR ranking in 2010. However imperfect the alignment, it is critical to note that many of these countries were still some of the worst performers in U5MR in 2010, which made our analysis use-ful. For instance, Somalia, Chad, Mali, and Central African Republic were all in the top 8, while countries such as Guinea-Bissau, Ivory Coast, and South Sudan were not far behind. This helped to understand how the importance of some determinants may shift if those countries were isolated.
As far as U5MR data is concerned, different sources pro-vided different estimates. For this reason, we elected to use data available from the UN IGME. It is also critical to ac-knowledge that different sources utilize different data collec-tion methods to generate data, which are accompanied by high levels of uncertainties. However, addressing data gener-ation methods by the different sources for all the 14 vari-ables considered in this research was beyond the scope of this study.
Besides the limitations related to data availability, there were other important limitations regarding variable selec-tion and analytical decisions. For instance, it is important to acknowledge that upstream factors considered in this study may diminish the critical role of some downstream factors. However, considering that an uncountable num-ber of factors can influence the mortality rate in children, and coupled with the fact that this is a cross-national ana-lysis, the authors consider using such broadly defined vari-ables very useful. This is because such broad varivari-ables can capture the essence of many downstream variables. For
in-stance, downstream factors such as “number of births
attended by skilled health personnel”and“number of
hos-pital beds per thousand people”among many others can
be viewed as important factors in understanding child-hood mortality, we believe that an upstream variable such as “total health expenditure” can help condense the es-sence of such myriad of variables into one.
The effect of coarse variables on the outcome of the analysis is also important to mention. As Acheampong et al. [2] acknowledged, literacy rate may not have had as much significance in this study because of its broad defin-ition. It does not account for different levels of education, as subpopulations with middle school education are typic-ally lumped together with those with tertiary education. In reality, however, it is expected that the difference in know-how between these two groups and their ability to access and understand healthcare will be critical to the survival of their children, as many in-country studies have found [7,9,13]. For this reason, we expect that the availabil-ity of a disaggregated data that distinguish between people with primary, secondary and tertiary education might produce different results [13].
Conclusion
Globally, the U5MR goal set in MDGs proved elusive even though significant progress was achieved. In Africa, the story was similar with some countries being able to meet their target. However, the continent still lags be-hind the rest of the globe in terms of the number of deaths recorded in children under five years old. In fact, eight of the ten countries (UNICEF-8) where it is most dangerous to be a new born are in Africa. While studies have addressed important factors that merit consider-ation on a global level as the world pursues the new goal in SDGs by cutting mortality down to 25 deaths per 1000 births, there is a need to acknowledge that bridging intra-continental gaps in Africa may be more realistic in the interim. This is especially because countries on the continent share many characteristics, including cultural, social, and economic. This paper has built on previous studies by understanding that generally account for intra-continental disparities between African countries and the factors that need focus to draw up the UNICEF-8 countries.
Table
8
Dataset
for
the
Study
(Continued)
Fema
le
Literacy
Adu
lt
Literacy
Gov. Expend
iture
U5M
R
Tot
al
Exp
endit
ure
Personal Expend
iture
Wate
r
Total Fert
ility
Sani
tation
Adol
escent
Fert
ility
Income
pe
r
Capita
Fema
le
Em
ploym
ent
Ru
ral
Pe
rcent
Nige
r
15.1
28.7
11.1
12
3.6
18
.3
41.3
49.0
7.6
9.5
210.4
800.0
38
.0
82.4
Nige
ria
41.4
51.1
4.4
13
0.3
62
.8
59.2
58.0
6.0
30.5
119.5
4750.0
44
.4
56.5
Rwan
da
61.5
65.9
20.1
64
.2
55
.5
22.2
65.0
4.8
57.2
34.1
1290.0
86
.4
76.0
Seneg
al
38.7
49.7
11.6
64
.8
58
.5
35.0
72.0
5.1
45.1
90.5
2110.0
57
.1
as investing in communities to improve their education and conditions of life may be more effectual.
Appendix A
Variable Source
U5MR UN Inter-agency Group for Child
Mortality Estimation database (https://childmortality.org/data)
Gross National Income per Capita World Development Indicators (WDI) database (http://data. worldbank.org/indicator)
Total Fertility Rate World Development Indicators
(WDI) database (http://data. worldbank.org/indicator)
Adolescent Fertility Rate World Development Indicators
(WDI) database (http://data. worldbank.org/indicator)
Total Female Employment to Population Ratio
World Development Indicators (WDI) database (http://data. worldbank.org/indicator
Percent Rural Population World Development Indicators
(WDI) database (http://data. worldbank.org/indicator)
Percent Population with Access to Improved Sanitation Facilities
World Development Indicators (WDI) database (http://data. worldbank.org/indicator)
Percent Population with Access to Improved Drinking Water
World Development Indicators (WDI) database (http://data. worldbank.org/indicator)
Per Capita Total Expenditure on Health
WHO Global Health Expenditure Database (http://apps.who.int/nha/ database/Select/Indicators/en)
Out-of-pocket Expenditure as a Percent of Total Health Expenditure
WHO Global Health Expenditure Database (http://apps.who.int/nha/ database/Select/Indicators/en)
Government Expenditure on Health as a Percent of Total Health Expenditure
WHO Global Health Expenditure Database (http://apps.who.int/nha/ database/Select/Indicators/en).
Percent Population Living under National Poverty Line
World Development Indicators (WDI) (http://data.worldbank.org/ indicator).and the CIA world Factbook (https://www.cia.gov/ library/publications/resources/the-world-factbook/)
Female Adult Literacy Rate UNESCO (http://data.uis.unesco.org/
Index.aspx?queryid=166); WDI (http://data.worldbank.org/ indicator); and CIA World factbook (https://www.cia.gov/library/ publications/resources/the-world-factbook/).
Total Adult Literacy Rate UNESCO (http://data.uis.unesco.org/
Index.aspx?queryid=166); WDI (http://data.worldbank.org/ indicator); and CIA World factbook (https://www.cia.gov/library/ publications/resources/the-world-factbook/).
Acknowledgments Not applicable.
Authors’contributions
MA conducted the statistical analysis and interpretation of the results. CE gathered was involved in the conception and design of the study as well as writing. ASM was involved in gathering and writing of the manuscript. BW was responsible for writing and editing of the manuscript. QY was also involved in the gathering of data and writing of manuscript. All authors read and approved the final manuscript.
Funding
Authors declare we received no funding for this study.
Availability of data and materials
All data generated or analysed during this study are included in this published article.
Ethics approval and consent to participate Not applicable.
Consent for publication Not applicable.
Competing interests
The authors declare that they have no competing interests.
Author details
1Center for Urban Ecology and Sustainability, Suffolk University, 8 Ashburton
Pl, Boston, MA 02108, USA.2College of Public Health, University of South Florida, 13201 Bruce B. Downs Blvd. MDC 56, Tampa, FL 33612, USA.3College
of Communications and Journalism, University of Florida, Gainesville, FL 32611, USA.4School of Geosciences, University of South Florida, 4202 E.
Fowler Ave, Tampa, FL 33620, USA.
Received: 15 December 2018 Accepted: 11 June 2019
References
1. Acheampong M, Ejiofor C, Salinas-Miranda A, Jaward FM, Yu Q, Eduful M. Bridging the under-five mortality gap for Africa in the era of sustainable development goals: an ordinary least squares (OLS) analysis. Ann Glob Health. 2018;84(1):1–11.https://doi.org/10.29024/aogh.9.
2. Acheampong M, Ejiofor C, Salinas-Miranda A. An analysis of determinants of Under-5 mortality across countries: defining priorities to achieve targets in Sustainable Development Goals. Matern Child Health J. 2017;21(6):1–20. 3. Bicego GT, Boerma JT. Maternal education and child survival: a comparative
study of survey data from 17 countries. Soc Sci Med. 1993;36(9):1207–27. 4. Bishai DM, Cohen R, Alfonso YN, Adam T, Kuruvilla S, Schweitzer J. Factors
contributing to maternal and child mortality reductions in 146 low-and middle-income countries between 1990 and 2010. PLoS One. 2016;11(1): e0144908.
5. Boyd AT, Cookson ST, Anderson M, Bilukha OO, Brennan M, Handzel T, Hardy C, Husain F, Cardozo BL, Colorado CN, Shahpar C. Centers for Disease Control and Prevention public health response to humanitarian
emergencies, 2007–2016. Emerg Infect Dis. 2017;23(Suppl 1):S196. 6. Breierova L, Duflo E. The impact of education on fertility and child mortality:
Do fathers really matter less than mothers? (no. w10513): National Bureau of Economic Research; 2004.
7. Caldwell JC. Education as a factor in mortality decline: an examination of Nigerian data. Popul Stud. 1979;33(3):395-413..
8. Central Intelligence Agency (CIA). 2014. The World Factbook. Retrieved from https://www.cia.gov/library/publications/resources/the-world-factbook/ (Accessed 20 March, 2016).
9. Cleland JG, Van Ginneken JK. Maternal education and child survival in developing countries: the search for pathways of influence. Soc Sci Med. 1988;27(12):1357–68.
government, prepaid private, and out-of-pocket health spending in 184 countries. Lancet. 2017;389(10083):1981–2004.
11. Feng XL, Theodoratou E, Liu L, Chan KY, Hipgrave D, Scherpbier R, et al. Social, economic, political and health system and program determinants of child mortality reduction in China between 1990 and 2006: a systematic analysis. J Global Health. 2012;2(1):x–y.
12. Friberg IK, Kinney MV, Lawn JE, Kerber KJ, Odubanjo MO, Bergh AM, et al. Sub-Saharan Africa's mothers, newborns, and children: how many lives could be saved with targeted health interventions? PLoS Med. 2010;7(6):e1000295. 13. Gakidou E, Cowling K, Lozano R, Murray CJ. Increased educational
attainment and its effect on child mortality in 175 countries between 1970 and 2009: a systematic analysis. Lancet. 2010;376(9745):959–74.
14. UN Inter-agency Group for Child Mortality Estimation. 2016. Under-5 Mortality Rates. Retrieved fromhttps://childmortality.org/data(Accessed 18 Feb 2016).
15. Gopalan S, Rajan RS. Has foreign aid been effective in the water supply and sanitation sector? Evidence from panel data. World Dev. 2016;85:84–104. 16. Harrell FE. Multivariable modeling strategies. In: Regression modeling
strategies. Cham: Springer; 2015. p. 63–102.
17. Heck KE, Schoendorf KC, Ventura SJ, Kiely JL. Delayed childbearing by education level in the United States, 1969–1994. Matern Child Health J. 1997;1(2):81–8.
18. Howard J. 2018. The least and most dangerous countries to be a newborn. Cable News Network, 2018. Retrieved fromhttps://www.cnn.com/2018/02/ 20/health/unicef-newborn-deaths-by-country-study/index.html?sr= fbCNN022018unicef-newborn-deaths-by-country-study0249PMStoryGal 19. HSBC Holdings plc. 2012. Exploring the links between water and economic
growth - a report prepared for HSBC by frontier economics: executive summary. Retrieved fromhttp://www.circleofblue.org/wp-content/uploads/ 2012/06/HSBC_June2012_Exploring-the-links-between-water-and-economic-growth.pdf.
20. IRIN. The Inside Story on Emergencies–Cholera Thriving Two Years on; 2011. Retrieved from http://www.irinnews.org/news/2011/10/12/cholera-thriving-two-years
21. Jakovljevic M, Potapchik E, Popovich L, Barik D, Getzen TE. Evolving health expenditure landscape of the BRICS nations and projections to 2025. Health Econ. 2017;26(7):844–52.
22. Jamison DT, Murphy SM, Sandbu ME. Why has under-5 mortality decreased at such different rates in different countries? J Health Econ. 2016;1(48):16–25. 23. Kanmiki EW, Bawah AA, Agorinya I, Achana FS, Awoonor-Williams JK, Oduro
AR, et al. Socio-economic and demographic determinants of under-five mortality in rural northern Ghana. BMC Int Health Hum Rights. 2014;14(1):24. 24. LaLonde SM. Transforming variables for normality and linearity—when, how,
why and why not’s. In: SAS conference proceedings NESUG; 2005. p. 11–4. 25. Macassa G, Ghilagaber G, Bernhardt E, Diderichsen F, Burström B.
Inequalities in child mortality in Mozambique: differentials by parental socio-economic position. Soc Sci Med. 2003;57(12):2255–64.
26. Rosicova K, Geckova AM, van Dijk JP, Kollarova J, Rosic M, Groothoff JW. Regional socioeconomic indicators and ethnicity as predictors of regional infant mortality rate in Slovakia. Int J Public Health. 2011; 56(5):523–31.
27. Smith AC, Mutangiri W, Fox R, Crofts JF. Millennium development goal 4: reducing perinatal and neonatal mortality in low-resource settings. Obstet Gynaecol. 2014;16(1):1–5.
28. Sommer JM, Shandra JM, Restivo M, Coburn C. Water, sanitation, and health in sub-Saharan Africa: a cross-national analysis of maternal and neo-natal mortality. Human Ecol Rev. 2015;22(1):129–52.
29. Tappero JW, Tauxe RV. Lessons learned during public health response to cholera epidemic in Haiti and the Dominican Republic. Emerg Infect Dis. 2011;17(11):2087–93.
30. Tavares LP. Who delays childbearing? The associations between time to first birth, personality traits and education. Eur J Popul. 2016;32(4):575–97. 31. The World Bank Group. World development indicators; 2015. Retrieved from
http://www.circleofblue.org/wp-content/uploads/2012/06/HSBC_June2012_ Exploring-the-links-between-water-and-economic-growth.pdf. Accessed 19 Feb 2016.
32. United Nations Inter-agency Group for Child Mortality Estimation (UN IGME). Levels & Trends in child mortality: report 2017, estimates developed by the UN inter-agency Group for Child Mortality Estimation. New York: United Nations Children’s Fund; 2017.
33. United Nations Children's Fund (UNICEF). Every child alive: the urgent need to end newborn deaths. Geneva: Switzerland; 2018. Retrieved fromhttps:// www.unicef.org/publications/index_102640.html
34. United Nations Children's Fund (UNICEF). Committing to child survival: a promise renewed. New York: Progress Report; 2015.
35. United Nations educational, scientific, and cultural organization (UNESCO). 2015. Education: Literacy Rate. Retrieved fromhttp://data.uis.unesco.org/ Index.aspx?queryid=166(Accessed 18 Feb 2016).
36. Wang L. Determinants of child mortality in LDCs: empirical findings from demographic and health surveys. Health Policy. 2003;65(3):277–99. 37. World Health Organization. 2015a. Under-five mortality—Situation and
trends. Retrieved fromhttp://www.who.int/gho/child_health/mortality/ mortality_under_five_text/en/
38. World Health Organization. 2015b. MDG 4: reduce child mortality. Retrieved fromhttp://www.who.int/topics/millennium_development_goals/child_ mortality/en/