Gravitation Theory Based Model for Multi-Label Classification
L. Peng, Y. LiuLiwen Peng, Yongguo Liu*
Knowledge and Data Engineering Laboratory of Chinese Medicine, School of Information and Software Engineering,
University of Electronic Science and Technology of China, Chengdu, 610054, PR, China
*Corresponding author: [email protected]
Abstract: The past decade has witnessed the growing popularity in multi-label classification algorithms in the fields like text categorization, music information re-trieval, and the classification of videos and medical proteins. In the meantime, the methods based on the principle of universal gravitation have been extensively used in the classification of machine learning owing to simplicity and high performance. In light of the above, this paper proposes a novel multi-label classification algorithm called the interaction and data gravitation-based model for multi-label classification (ITDGM). The algorithm replaces the interaction between two objects with the at-traction between two particles. The author carries out a series of experiments on five multi-label datasets. The experimental results show that the ITDGM performs better than some well-known multi-label classification algorithms. The effect of the proposed model is assessed by the example-based F1-Measure and Label-based micro F1-measure.
Keywords: data gravitation theory, interaction, multi-label classification.
1
Introduction
As a major area of research into machine learning systems, the traditional supervised classi-fication learning technology attributes each instance to one class (label). Withxas the set of all instances and las the label space, the traditional supervised classification learning system aims to get the functionf :x→lfrom the training dataset{(xi, lj) : 1≤i≤m,1≤j ≤k}, wherem
and k denote the number of instances and the number of labels, respectively. In other words, the purpose of the system lies in predicting the one correct label for each test instance. There are many algorithms for single-label classification, such as the decision tree C4.5 [4], the support vector machine (SVM) [1], the rough set [11], the neural network (NN) [8] and so on.
The traditional single-label classification may apply to some fields, but many instances do not belong to a specific class in reality, namely text categorization, music information retrieval and video classification. The limitation of the traditional single-label classification has contributed to the growing popularity in multi-label classification algorithms.
In general, multi-label classification methods are roughly divided into two categories [2]: the problem transformation method and the algorithm adaptation method. The former transforms multi-label dataset into other well-established learning scenarios, and processes the transformed dataset with the single-label classification algorithm. Typical examples are the binary relevance algorithm (BR), the label combination method (LC), high-order classifier chains [13], and ran-domk label sets (RAkEL) [17]. By contrast, the algorithm adaptation method directly applies adaptive learning methods to solve the problem of multi-label learning. The representative al-gorithm adaptation methods include the k-nearest neighbor alal-gorithm for multi-label learning (ML-kNN) [24], the back-propagation multi-label learning (BPMLL) [23], the bichromatic reverse k-nearest neighbor algorithm (BRkNN) [15] and the dependent multi-label k-nearest neighbor
algorithm (DML-kNN) [21]. As an extended version of the KNN method, the ML-kNN approach employs the maximum posteriori probability to determine the label set of test instances. Based on the label sets of the neighbor instances, the BRkNN method calculates the confidence of each label, and decides thek nearest neighbors of each test instance. The BPMLL is another classic back-propagation multi-label classification algorithm which proposes a new error function for multiple labels.
As far as we know, the methods based on the principle of universal gravitation has been extensively used in the classification or clustering of machine learning owing to simplicity and high performance. The existing physical gravitation-based classification or clustering methods mostly focus on two important factors: the data distance and density. For example, Reyes et al. [14] proposed a multi-label lazy algorithm based on the data gravitation model, named the MLDGC. It is the first algorithm developed for data gravitation model on multi-label classifica-tion. However, the data gravitation-based methods often ignore the interaction of data mass, and directly define data gravitation with density, resulting in inconsistency with human perception. In view of the necessity to include the attraction between two particles in the data gravitation-based classification, this paper proposes a novel algorithm gravitation-based on gravitation theory called the interaction and data gravitation-based model for multi-label classification (ITDGM).
The rest of this paper is organized as follows: Section 2 briefly introduces gravitation and reviews the related research on data gravitation, Section 3 presents the proposed algorithm, Section 4 describes the experiment, Section 5 shows and discusses the experimental results, and Section 6 wraps up the research with some conclusions.
2
Literature review
Whenever there is an interaction between two objects, there is a force upon each of the objects. One of the forces can be characterized by Newton’s law of universal gravitation. The universal gravitation-based methods are widely used in classification or clustering.
Wright [18] was the first to apply such a method in cluster analysis. Gomez et al. [6] proposed a clustering algorithm based on feature space that considers each of the instances. On account of gravitational collapse, Wang et al. [19] put forward an improved algorithm based on k-NN classifier. In light of the theoretical model of data gravitation and data gravitation field, Yang et al. [22] presented a new classification model called data gravitation-based classifier (DGC), and used it in an intrusion detection system (IDS). Li et al. [9] developed a nonlinear classification algorithm to handle data gravity as data vector. Shafigh et al. [16] proposed a method based on the gravitational potential energy of particles named gravitation-based classification (GBC) algorithm, sought for the equilibrium condition of the classifier, and proved that the algorithm had strong robustness but high computational complexity. Wena et al. [20] came up with the cognitive gravitation model (CGM) algorithm, which uses the self-information of each instance instead of the mass based on the law of gravitation and the cognitive laws. Starting from the DGC method, Peng et al. [12] created the improved DGC (IDGC) in an attempt to handle imbal-ance datasets with amplified gravitation coefficient (AGC), which could strengthen and weaken the gravitational field of the minority and majority instances. Reyes et al. proposed an algo-rithm based on lazy learning and data gravitation model for classification which simultaneously measured classification accuracy and label ranking.
Among the aforementioned data gravitation-based algorithms, most of them are applied in single-label learning systems. The only exception is the MLDGC, which is adopted for multi-label classification. Overall, few scholars have integrated the data gravitation model and multi-label classification.
3
The proposed algorithm based on gravitation theory
So far, the laws of physics have been extensively applied to the information domain. It is stressed that the interaction of data instances must conform to the physical laws. The laws are implemented to simulate actual data classification in many novel data gravitation-based classification algorithms. However, the simulation results may not fully correspond with the reality as the data gravitation is directly defined with the density instead of the interaction between data instances.
To solve the problem, this paper proposes a multi-label learning algorithm based on data gravitation model (ITDGM). In a multi-label dataset, an instance i can be transformed into a data particle expressed as(Xi, Yi, mi). The feature vector of the data particle iis defined as the
label set of the particle and denoted by Xi andYi.
The symbolmi means the data mass of particlei. For any two particlesiandj, the distance
between them can be calculated as dF(i, j) =
q P
∀f∈Fδ(xif, xjf)2.
Since the Heterogeneous Euclidean-Overlap Metric (HEOM) can handle both nominal and continuous features, the above heterogeneous distance function is adopted in the experiment.
Therefore, the termδ(xif, xjf)2 should be solved under three different conditions:
• δ(xif, xjf)2 = 1 whenxif 6=xjf and the data attribute is discrete;
• δ(xif, xjf)2 = 0 whenxif =xjf and the data attribute is discrete;
• δ(xif, xjf)2 =
|xif−xjf|
max(f)−min(f) when the data attribute is continuous;
Where xif and xjf are the f-th eigenvalues of i and j, respectively; F is the feature
space; δ(xif, xjf) is the type of f-th feature; max (f) and min(f) are the maximum and
min-imum values, respectively. Hence, it is possible to identify the k-nearest neighbors of parti-cle i by the dF(i, j) function. The k-nearest neighbors of particle i can calculate by Ni = (i1, i2, . . . , ik)|dF(i, i1), dF(i, i2), ..., dF(i, ik), which is sorted by ascending order.
According to the Newton’s law of universal gravitation, the greater the mass of two objects, the greater the resulting interaction between them. In other words, the gravitation increases with the interaction between the two objects. In this research, a new concept is defined: the interaction-based gravitation coefficient (IGC). The coefficient is created to evaluate the attrac-tion between two particles like the interacattrac-tion between two objects. Data has not mass. For the reason that data has no mass, the data mass is usually set as one. However, the setting is inconsistent with human perception without considering the interactions between data particles. Thus, the author defines the IGC and a data gravitation-based model to measure the strong or weak gravitational force of particles. The dissimilarity between the label set of the particle i and that of particlej is expressed by the operatorΘ(Yi, Yj)and the interaction between the two
particlesM(xi,j) is defined as:
P(i, j) = Θ(Yi,Yj) q × 1 fj (1) M(xi,j) = log 1 P(i, j) = log qfj Θ(Yi, Yj) (2) WhereP(i, j)is the dissimilarity degree between the label set of the particleiand that of particle j, andfj is the number of the instance labels, and q is the number of the total labels.
For the sake of data stability, M(xi,j) is introduced to measure the dissimilarity in the
classification between particles. From the above formulas, it is concluded thatP(i, j)is inversely
proportional toM(xi,j), that is, the smaller theP(i, j), the more intense the interaction between
the particle iandj.
Based on neighborhood density concept of Reyes et al. [14], the IGC value of particle i is calculated by the formulami=dwii , wheredi is the neighborhood density or the distribution of
the neighbor particles ofi, andwiis the neighborhood weight of particlei. The greater the value
of di, the more similarity between the label set of another particle and that of particle i. The
neighborhood density is computed by the following formula: di= 1 +
X
j∈Ni
(1 +M(xi,j))/dF(i, j) (3)
Based on the above formula, the neighborhood weight calculation method is improved as below. First,pidY = P j∈NiI(xi,j) k and p i dF = P j∈NidF(i,j)
k are identified as the nearest particles of
ibased on the principle of prior probability and the prior probability of the nearest particles of iin the feature space, respectively. The symbolkis the initial number of nearest neighbors, and Ni is the nearest neighbors set of the particlei. Then, the prior probability of the nearest
neigh-borhood of i with similar label sets can be calculated by pidY|dF =
P
j∈NiI(xi,j)·dF(i,j)
k . Finally,
the neighborhood weight (wi) is obtained by the formulawi= pi dY|dFp i dF pi dY −(1−p i dY|dF)p i dF 1−pi dY .
Through the above steps, it is possible to get the gravitational force between two instances. Taking an instance from dataset, the k-nearest neighborhood of particle i can be computed as below. F (i,j) = g IGC dF(i, j)2 = g mi dF(i, j)2 (4) In this experiment, the gravitational constantgis set to 1 for the calculation of the gravitation of instances. Thus, the gravitational force f(i, j) = gmimjr2 is rewritten as F(i, j) = IGC
dF(i,j)2,
where the IGC replaces the product of the mass of the objects.
After obtaining the gravitational force between instances, it is necessary to determine which labels belong to the test instances. To this end, a simple statistical approach is implemented. The number of they-th label that belongs to the k-nearest particles is expressed as
n(i) = P
j∈Fi
F(i, j), y ∈Yj, and the number of they-th label that does not belong to the k-nearest
particles is expressed as n0(i) = P
j∈Fi
F(i, j), y /∈Yj, Fi is the set of the nearest neighbors. If
n(i)> n0(i), they-th label belongs to the instance; otherwise, they-th label does not belong to the instance.
The proposed method is divided into three main steps. First, calculate the interaction be-tween instances with the IGC coefficient; second, compute the gravitation of each particle i; third, obtain the k-nearest neighbors of the instance based on gravitation. Figure 1 illustrates the basic procedure of the ITDGM method.
The proposed algorithm seeks for k-nearest neighbors of each multi-label instance, and aims to transform the instances to particles in the learning phase. If linear search strategy is adopted for the k-nearest neighbors of instance i, the optimal time complexity of the learning phase is O n2·d
for all training instances, i.e. it takesO(n·k·d)steps at most to classifykinstances, wherenis the number of instances and dis the cardinality of the feature space.
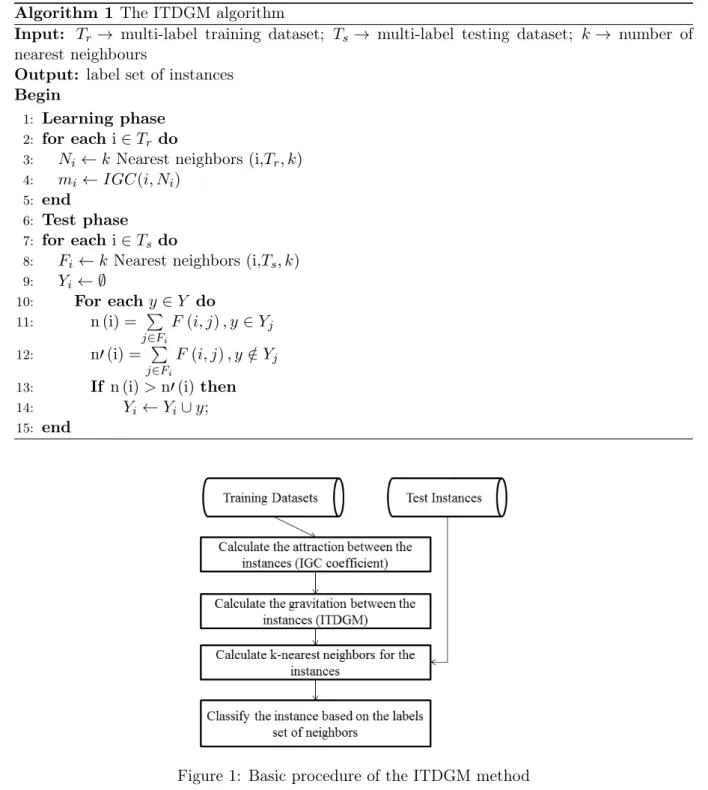
Algorithm 1 The ITDGM algorithm
Input: Tr→ multi-label training dataset; Ts→ multi-label testing dataset; k→ number of
nearest neighbours
Output: label set of instances Begin 1: Learning phase 2: for eachi∈Tr do 3: Ni ←kNearest neighbors (i,Tr, k) 4: mi ←IGC(i, Ni) 5: end 6: Test phase 7: for eachi∈Ts do 8: Fi ←kNearest neighbors (i,Ts, k) 9: Yi ← ∅ 10: For each y∈Y do 11: n (i) = P j∈Fi F(i, j), y∈Yj 12: n0(i) = P j∈Fi F(i, j), y /∈Yj
13: If n (i)>n0(i)then 14: Yi←Yi∪y; 15: end
Figure 1: Basic procedure of the ITDGM method
4
Experiment
Due to the one-to-many relationship between instances and labels, the evaluation of multi-label classification performance is much more complicated than the traditional supervised single-label learning. The existing evaluation measures for multi-single-label classification mainly fall into two groups: the example-based measure [7] and the label-based measure [25]. In this research, the experimental results are verified by a string of different public datasets and discussed in details below.
4.1 Datasets
In this paper, five public multi-label datasets of different scales, labels and properties are selected from various domains to validate the proposed algorithm. The “Genbase” datasets [3] store information on the gene functions; the “Birds” contain bird species examples for acoustic classification; Corel16k001, Corel16k002 and Corel16k006 encompass examples of Corel images. The statistics on benchmark datasets are shown in Table 1, where nis the number of instances in the datasets; d is the number of features; q is the number of labels; ds and lc are the label
cardinality and the label density, respectively.
Table 1: Statistics of the public multi-label benchmark datasets
Dataset Domain n d q ds lc Genbase biology 662 1186 27 32 1.252 Birds audio 645 260 19 133 1.014 Corel16k001 image 13766 500 653 4937 2.867 Corel16k002 image 13761 500 654 4937 2.867 Corel16k006 image 13859 500 652 4937 2.867 4.2 Evaluation metrics
The performance of multi-label classification is measured differently from the single-label classification learning system. Let X∈Rd be instances of data sets and express each instance
as a d-dimensional vector x ={x1, x2, . . . , xd},x∈X. Let Y ={l1, l2, . . . , lm} be a finite label
set. Every instance belongs to a subset of Y and the subset is represented by an m-dimensional vector y ={y1, y2, . . . , ym}; if yk= 1, label lk belongs to instance x; if yk = 0, the label does
not belong to the instance. For a given training dataset T ={(xi, yi)|1≤i≤n, xi∈X, yi ∈Y}
composed ofninstances, wherex is the instance andy is the label subset of the instance, there is a corresponding test dataset D ={(xi, yi)|1≤i≤p, xi∈X, yi ∈Y} composed of p instances
based on the evaluation of the classification performance on test instances and the test set that returns the mean value.
In this paper, the instance-based F1-measure (F1Ex) is implemented to present the
experi-mental evaluation results:
F1Ex= 1 m m X i=1 2|Yi∩Zi| |Yi|+|Zi| (5)
Wheremis the number of test instances, andZi is the predicted label set of a given test instance
i. The greater the value of F1Ex, the better the performance of the multi-label classification
algorithm.
Different from the above example-based measure, the label based micro F1-measure relies on the harmonic mean between recall and precision. The precision refers to the relevance of the predicted labels and the recall reflects the percentage of the predicted labels that are relevant. Such a measure is used in this research to present the algorithm performance. The F1-measure and the micro averaging are expressed by the following formulas:
F1−measure = 1 N N X i=1 2|Yi∩Zi| |Zi|+|Yi| (6)
Mmicro=M M X l=1 tpl, M X l=1 f pl, M X l=1 tnl, M X l=1 f nl ! (7) Where tpl is the true positives; f pl is the false positives; tnl and f nl are the true and false
negatives for l labels after a binary evaluation, separately. The greater the micro F1-measure, the better the classification performance of the multi-label algorithm.
4.3 Experiment setting
The performance of the proposed algorithm ITDGM is compared with that of five classic multi-label classification algorithms: the ML-kNN, the BR, the RAkEL, the BRkNN and the BPMLL. In the RAkEL and BR algorithms, the C4.5 decision tree is taken as the classifier. In this research, the number of the nearest neighbors is 2∼7 for the ML-kNN, the ITDGM and the BRkNN; the smoothing factor of the ML-kNN is 1.0; the learning rate parameter of the BPMLL is 0.05; the Epoch parameter is 100; 20% of the input units are hidden units. The experiments are conducted on an Interl Core-i5 2.3 GHz processor with 8G memory, with the aid of MATLAB 2012 and the Java-based open resource software MULAN, which contains lots of classic and popular multi-label algorithms, evaluation targets and measures. The results are subjected to 5-fold cross validation.
5
Results and discussion
In this research, the example-based F1-measure (F1Ex) and micro F1-measure are taken
as the multi-label classifier evaluation criteria. In any case, the best results are highlighted and bolded. As mentioned above, the greater the F1Ex and micro F1-measure, the better the
performance of the corresponding evaluation method.
Tables 2∼3 show the results of multi-label classification algorithms on test datasets forF1Ex
and micro F1-measure. It is seen that the proposed algorithm ITDGM has better performance than the other methods.
Based on the F1Exvalues in Table 2, the ITDGM outperforms the other five classic methods
on the five public datasets. The F1Ex index of the proposed algorithm surpasses that of the
other algorithms more than 3% on the“Bird” dataset, and 2% on the remaining datasets. Table 3 displays the micro F1-measure values of the proposed algorithm and the other al-gorithms. The results show that the proposed algorithm boasts the best performance on the Corel16k001, Corel16k002 and Corel16k006 datasets, and keeps a 2% lead over the other algo-rithms in "Genbase" and "Birds" datasets.
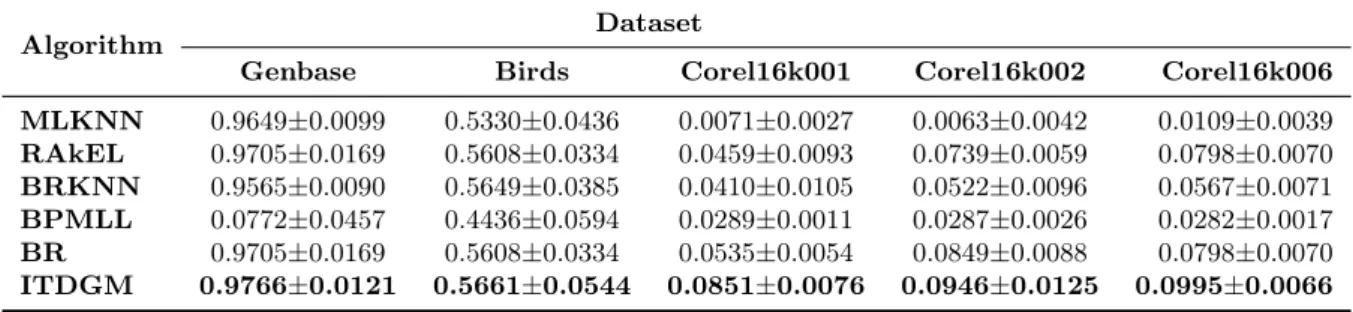
Table 2: Example-based F1-measure (F1Ex) values of all algorithms on the five public datasets
Algorithm Dataset
Genbase Birds Corel16k001 Corel16k002 Corel16k006
MLKNN 0.9649±0.0099 0.5330±0.0436 0.0071±0.0027 0.0063±0.0042 0.0109±0.0039 RAkEL 0.9705±0.0169 0.5608±0.0334 0.0459±0.0093 0.0739±0.0059 0.0798±0.0070 BRKNN 0.9565±0.0090 0.5649±0.0385 0.0410±0.0105 0.0522±0.0096 0.0567±0.0071 BPMLL 0.0772±0.0457 0.4436±0.0594 0.0289±0.0011 0.0287±0.0026 0.0282±0.0017 BR 0.9705±0.0169 0.5608±0.0334 0.0535±0.0054 0.0849±0.0088 0.0798±0.0070 ITDGM 0.9766±0.0121 0.5661±0.0544 0.0851±0.0076 0.0946±0.0125 0.0995±0.0066
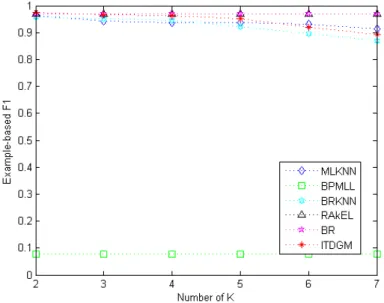
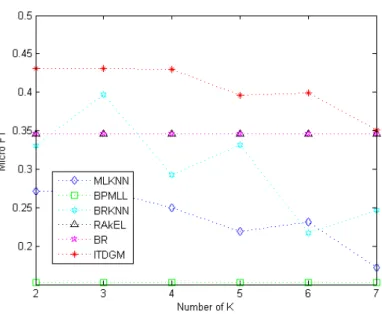
Figures 2∼11 show the relationship between the values ofF1Exand micro F1-measure and the
Table 3: Micro F1-measure values of all algorithms on the five public datasets
Algorithm Dataset
Genbase Birds Corel16k001 Corel16k002 Corel16k006
MLKNN 0.9447±0.0142 0.2728±0.0300 0.0129±0.0050 0.0094±0.0056 0.0134±0.0039 RAkEL 0.9625±0.0094 0.3456±0.0445 0.0606±0.0062 0.1000±0.0054 0.1077±0.0109 BRKNN 0.9446±0.0123 0.3972±0.0303 0.0629±0.0144 0.0717±0.0087 0.0787±0.0044 BPMLL 0.0870±0.0472 0.1528±0.0518 0.0414±0.0003 0.0408±0.0008 0.0396±0.0008 BR 0.9625±0.0094 0.3456±0.0445 0.0718±0.0066 0.1108±0.0081 0.1077±0.0109 ITDGM 0.9686±0.0118 0.4314±0.0571 0.1066±0.0082 0.1138±0.0101 0.1195±0.0065
has the best classification effect with the fewest k-nearest neighbors in the testing datasets. In Figures 2 and 3, all algorithms perform well except the BPMLL (F1Ex: 0.0772, micro F1:
0.0870). The ITDGM achieves the best overall result (micro F1: 0.9686) in Figure 3, followed closely by the simply transformation methods the RAkEL and the BR (micro F1: 0.9625).
Figure 2: Relationship between F1Ex and the number of nearest neighbors in “Genbase” of all
algorithms
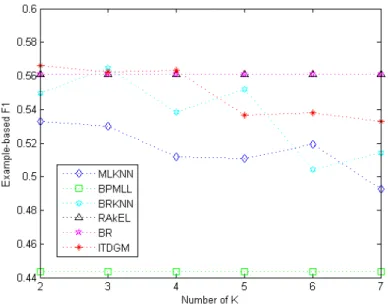
The ITDGM is still the best performing algorithm in Figures 4 and 5. Although the ML-kNN and the BRML-kNN achieve fairly good performance at k=2 (F1Ex: 0.5330) and k=3 (F1Ex:
0.5649), respectively, the ITDGM has a slight edge over the two algorithms at k=2. As shown in Figure 5, the proposed algorithm has the best performance at almost any number of nearest neighbors on micro F1 metrics. According to Figure 4 and Figure 5, the RAkEL algorithm also has an outstanding performance. This is attributable to the random selection of label sets and unique strategies for training models in the algorithm.
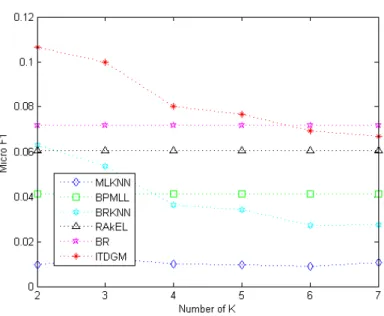
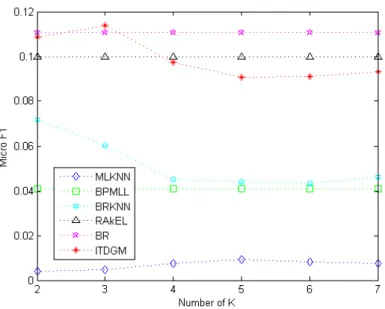
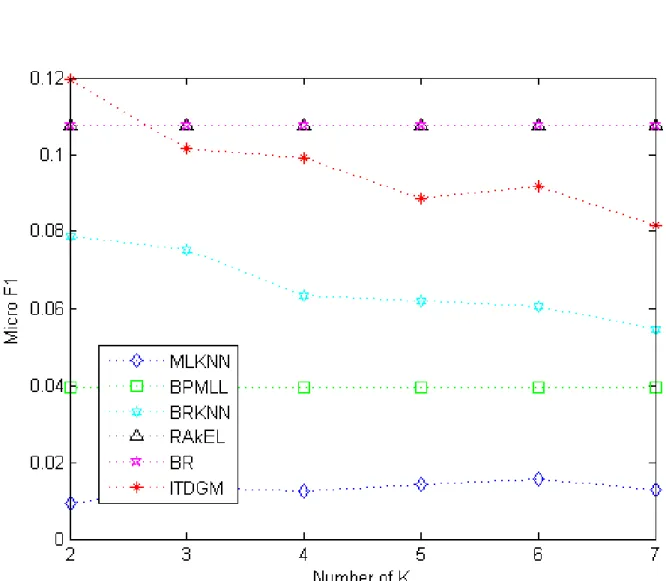
Figures 6∼11 describe the metrics of all six algorithms on three Corel16k datasets. All selective multi-label classification methods perform poorly in these datasets, owing to the low label density and huge amount of distinctive label sets in the three datasets. In this case, the proposed algorithm also outperforms the other algorithms.
On the contrary, the ML-kNN shows the worst performance in the three datasets due to the capacity of its classifier. Despite the good performance in some cases, such as Corel16k001 (F1Ex:
Figure 3: Relationship between micro F1 and the number of nearest neighbors in“Genbase” of all algorithms
Figure 4: Relationship between F1Ex and the number of nearest neighbors in “Birds” of all
algorithms
0.0535, micro F1: 0.0718), Corel16k002 (F1Ex: 0.0849, micro F1: 0.1108), Corel16k006 (F1Ex:
0.0798, micro F1: 0.1077), the simple transformation method BR costs much more training time than other algorithms. In comparison, the ITDGM, the BRkNN and the ML-kNN consumes less training time thanks to their roots in the lazy learning system.
Figure 5: Relationship between micro F1 and the number of nearest neighbors in “Birds” of all algorithms
Figure 6: Relationship betweenF1Exand the number of nearest neighbors in Corel16k001 of all
Figure 7: Relationship between micro F1 and the number of nearest neighbors in Corel16k001 of all algorithms
Figure 8: Relationship betweenF1Exand the number of nearest neighbors in Corel16k002 of all
Figure 9: Relationship between micro F1 and the number of nearest neighbors in Corel16k002 of all algorithms
Figure 10: Relationship between F1Ex and the number of nearest neighbors in Corel16k006 of
Figure 11: Relationship between micro F1 and the number of nearest neighbors in Corel16k006 of all algorithms
6
Conclusion
This paper presents a new multi-label classification algorithm based on data gravitation theory, introduces the interaction-based gravitation coefficient (IGC) to the proposed algorithm, and uses the algorithm to calculate the gravitational force instead of the mass of the particles. The average classification accuracy of the proposed method is evaluated by experiments on five public open datasets, in comparison with five classic multi-label algorithms: the BR, the RAkEL, the ML-kNN, the BPMLL and the BRkNN. The six algorithms are applied, under the example-based F1-measure (F1Ex) and micro F1-measure, to the five public multi-label datasets
at different number of nearest neighbors. In the experiment, the proposed algorithm outperforms all the other five algorithms, showcasing ideal capability and rationality. This research creates several new topics for future studies: the proposal of new multi-label classification method based on data gravitation model, integration with other fields [5] [10], and the improvement of the classification effect.
Acknowledgement
This research was supported in part by the National Natural Science Foundation of China (NSFC) under grants 60903074, the National High Technology Research and Development Pro-gram of China (863 ProPro-gram) under grant 2008AA01Z119.
Bibliography
[1] Boser B.E., Guyon I.M., Vapnik V.N. (1992); A training algorithm for optimal margin classifiers, Proce. of the 5th Annual ACM Conf. on Computational Learning Theory, 144–
152, 1992.
[2] Boutell M.R., Luo J., Shen X., Brown C.M. (2004); Learning multi-label scene classification,
Pattern Recognition, 37(9), 1757–1771, 2004.
[3] Diplarisa S., Tsoumakas G., Mitkas P., Vlahavas I. (2005); Protein classification with mul-tiple algorithms, Proc. of the 10th Panhellenic Conference on Informatics, 3746, 448–456,
2005.
[4] Freund Y. (1995); Boosting a weak learning algorithm by majority, Information and Com-putation, 121(2), 256–285, 1995.
[5] Fichera A., Fortuna L., Frasca M., Volpe R. (2015); Integration of complex networks for urban energy mapping,International Journal of Heat and Technology, 33(4), 181–184, 2015.
[6] Gomez J., Dasgupta D., Nasraoui O. (2013); A new gravitational clustering algorithm,Proc. of the SIAM Intl. Conf. on Data Mining, 2013.
[7] Ghamrawi N., McCallum A. (2005); Collective multi-label classification, Proc. of the 14th ACM Intl. Conf. Information and Knowledge Management, 195–200, 2005.
[8] Lu H., Rudy S., Liu H. (1996); Effect data mining using neural networks,IEEE Transaction on Knowledge and Data Engineering, 8(6), 957–961, 1996.
[9] Li J., Fu H. (2009); Data classification based on supporting data gravity.Proc. of the IEEE Intl. Conf. on Intelligent Computing and Intelligent Systems, 1, 22–28, 2009.
[10] Lin T., Wu P., Gao F.G., Yu Y., Wang L.H. (2015); Study on SVM temperature compen-sation of liquid ammonia volumetric flowmeter based on variable weight PSO, International Journal of Heat and Technology, 33(2), 151–156, 2015.
[11] Pawlak A. (1991); Rough Sets: Theoretical Aspects of Reasoning about Data, Dordrecht,
1991.
[12] Peng L., Zhang H., Yang B., Chen Y. (2014); A new approach for imbalanced data classifi-cation based on data gravitation, Information Sciences, 288(C), 347–373, 2014.
[13] Read J., Pfahringer B., Holmes G., Frank E. (2009); Classifier chains for multi-label classi-fication, Machine Learning and Knowledge Discovery in Databases, 254–269, 2009.
[14] Reyes O., Morell C., Ventura S. (2016); Effective lazy learning algorithm based on a data gravitation model for multi-label learning, Information Sciences, 2016, s340–341, 159–174,
2016.
[15] Spyromitros E., Tsoumakas G., Vlahavas I. (2008); An empirical study of lazy multilabel classification algorithms,Proc. of the 5th Hellenic Conference on Artificial Intelligence, 401–
406, 2008.
[16] Shafigh P., Hadi S.Y., Sohrab E. (2013); Gravitation based classification. Information Sci-ences, 220(1), 319–330, 2013.
[17] Tsoumakas G., Vlahavas I. (2007); Random k-Labelsets: An ensemble method for multilabel classification, Machine learning: ECML 2007, 406–417, 2007.
[18] Wright W. E. (1977); Gravitational clustering,Pattern Recognition, 9(3), 151–166, 1977.
[19] Wang C., Chen Y.Q. (2005); Improving nearest neighbor classification with simulated grav-itational collapse,Proc. of the Intl. Conf. on Advances in Natural Computation, 3612, 845–
854, 2005.
[20] Wena G., Wei J., Wang J., Zhou T., Chen L. (2013); Cognitive gravitation model for classification on small noisy data, Neurocomputing, 118(11), 245–252, 2013.
[21] Younes Z., Abdallah F., Denceux T. (2008); Multi-label classification algorithm derived from k-nearest neighbor rule with label dependencies,Proc. of the 16th Eropean Signal Processing Conference, 297–308, 2008.
[22] Yang B., Peng L., Chen Y., Liu H., Yuan R. (2006); A DGC-based data classification method used for abnormal network intrusion detection, Proc. of the Intl. Conf. on Neural Information Processing, 4234, 209–216, 2006
[23] Zhang M.L., Zhou Z.H. (2006); Multilabel neural networks with applications to functional genomics and text categorization.IEEE Transactions on Knowledge and Data Engineering,
18(10), 1338–1351, 2006.
[24] Zhang M.L., Zhou Z.H. (2007); ML-KNN: A lazy learning approach to multi-label learning,
Pattern Recognition, 40(7), 2038–2048, 2007.
[25] Zhang M.L., Zhou Z.H. (2014); A review on multi-label learning algorithms. IEEE Trans-actions on Knowledge and Data Engineering, 26(8), 1819–1837, 2014.