Small area estimation of labour force indicators under a
multinomial model with correlated time and area effects
∗Esther L´opez-Vizca´ıno1, Mar´ıa Jos´e Lombard´ıa2, Domingo Morales3
1Instituto Galego de Estat´ıstica, Spain, 2Universidade da Coru˜na, Spain, 3Universidad Miguel Hern´andez de Elche, Spain.
16-07-2014
Abstract
The aim of this paper is the estimation of small area labour force indicators like totals of employed and unemployed people and unemployment rates. Small area estimators of these quantities are derived from four multinomial logit mixed models, including a model with correlated time and area random effects. Mean squared errors are used to measure the accuracy of the proposed estimators and they are estimated by analytic and bootstrap methods. The introduced methodology is applied to real data from the Spanish Labour Force Survey of Galicia.
Key words: Small area estimation, multinomial mixed models, correlated time and area
effects, bootstrap, unemployment totals, unemployment rates.
AMS subject classification: 62E30, 62J12
1
Introduction
The Spanish unemployment rate in the second quarter of 2012 reached 24.63%, 14 points higher than in 2008 and the women unemployment rate reached 24.71%, 12 points higher than in 2008. In Galicia (Spain) the labour market situation was not very different in that period. The unemployment rate was 21.1% almost 11 points higher than in 2008. In such situations, besides having measures of unemployment for large areas, it is necessary to have indicators, like totals of employed, unemployed and inactive people or unemployment rates, to assess the impact of employment policies at local level. This paper partially address this issue by introducing a model-based statistical methodology for estimating these indicators in the counties of Galicia.
Most European countries estimate labour force indicators by using a Labour Force Survey (SLFS). The Spanish LFS is designed to obtain precise estimates at province level. As sample sizes are below that planned level, direct estimators at municipal or county level have low accu-racy. The small area estimation techniques deal with this kind of situations. Some descriptions of the Small Area Estimation (SAE) theory can be found in the monograph of Rao (2003), or in the reviews of Ghosh and Rao (1994), Rao (1999), Pfeffermann (2002, 2013) and Jiang and Lahiri (2006).
∗
Supported by the Instituto Galego de Estat´ıstica, by the grants MTM2012-37077-C02-01 and MTM2008-03010 of the Spanish “Ministerio de Ciencia e Innovaci´on”, by “Xunta de Galicia” CN2012/211 and partially supported by FEDER funds.
In the field of small area estimation, data are often available for many small areas simul-taneously and for some few time periods. Rao and Yu (1994) gave a simple way of borrowing information cross-sectionally and over time by introducing a model containing both contempo-rary random effects and time varying effects. Estimators provided by Pfeffermann and Burck (1990), Ghosh et al. (1996), Datta et al. (1999), Datta et al. (2002), Saei and Chambers (2003), You et al. (2001), Ugarte et al. (2009), Esteban et al. (2012) and Marhuenda et al. (2013) exploit also the two dimensions in linear mixed models for producing small areas estimates with good properties.
Statistical tools for contingency tables are applied to the estimation of small area population counts that are cross-classified by socio-economic characteristics of interest (like labour force status). Purcell and Kish (1980) introduced the “structure preserving estimation” (SPREE) that modifies the estimated small area cross-classifications counts so that they vary from one small area to the next in accordance with the variation of another known set of small area cross-classifications of the same dimension. Zhang and Chambers (2004) developed a class of log-linear structural models for the estimation of small area cross-classified counts. Their approach accounts for various association structures within the data and includes as a special case the log-linear model underpinning SPREE.
As log-linear models do, multinomial regression models are also applied to the estimation of category counts. The log-linear models are used for estimating counts in multi-way contingency tables; for example, in four-way tables with entries defined by domain, labour status, sex and age categories. Auxiliary cross-classification counts for each cell of the contingency table are required for calculating the model-based count estimates. The multinomial regression models can be used for estimating counts in contingency tables, but preferably in those cases where continuous auxiliary variables are available. For these models, the auxiliary variables are needed only at the domain level.
We propose area-level multinomial models with random effects for the categories of the target variables (employed and unemployed people) and for the time periods. This is due to the different behaviour of each labour category in the Galician data. We also take advantage from the availability of survey data from different time periods and from the correlation between the periods by introducing correlated time effects in the model.
We adapt the resampling approaches of Gonz´alez-Manteiga et al. (2007, 2008a, 2008b) to introduce a parametric bootstrap procedure for estimating the mean squared error (MSE) of the model-based estimators. We also give an approximation to the MSE based on a Taylor lin-earization. We approximate the MSE and derive an estimator of the approximation by applying the ideas of Prasad and Rao (1990) to the linearized model.
We organize the remainder of the paper as follows. Section 2 introduces the problem of interest and describes the available data. Section 3 presents the four mixed-effects multinomial models that are used in the application to real data. Section 4 applies the proposed methodology to data from the SLFS in Galicia. The target of this section is the estimation of employment and unemployment totals and of unemployment rates in the counties of Galicia. Section 5 presents a simulation experiment designed to study the behaviour of the introduced MSE estimation meth-ods. Section 6 discusses some issues related with the application of the proposed methodology to real data. Section 7 gives some conclusions. The appendix presents the proposed model-based estimators and gives the corresponding MSE estimation procedures.
2
The problem of interest and the data
The objective of this paper is the estimation of the totals of employed, unemployed and inactive people and of the unemployment rates in the Galician counties. We deal with data from the SLFS of Galicia from the third quarter of 2009 (III/2009) to the fourth quarter of 2011 (IV/2011), i.e. for T = 10 time periods. Our domains of interest are the counties crossed by sex for each time period. As there are 53 counties in the SLFS of Galicia, we have 106 domains. Nevertheless, there are only D= 102 domains with non-null sample size and this is the target set of domains when fitting area-level models to the aggregated real data. Let Pdt denotes the population of domain d at time periodt, which is partitioned in the subsets Pd1t,Pd2t and Pd3t of employed (k= 1), unemployed (k = 2) and inactive (k = 3) people, respectively. Our target population parameters are the totals of employed and unemployed people and the unemployment rate, this is to say Ydkt= X j∈Pdt ydktj, k= 1,2, Rdt= Yd1t Yd1t+Yd2t ,
where ydktj = 1 if individual j of domain d at period t is in labour category k and ydktj = 0 otherwise. The SLFS does not produce official estimates at the domain level, but the analogous direct estimators of the total Ydkt, the mean ¯Ydkt=Ydkt/Ndt, the sizeNdt and the rateRdt are
ˆ
Ydktdir= X
j∈Sdt
wdtjydktj,Yˆ¯dktdir= ˆYdktdir/Nˆdtdir, k= 1,2, Nˆdtdir= X j∈Sdt wdtj,Rˆdtdir= ˆ Yddir2t ˆ Ydir d1t + ˆYddir2t , (2.1) where Sdt is the sample of domain d at time period t and the wdtj’s are the official calibrated sampling weights. More concretely, weights are calibrated so that their sum coincide with the population projections (sizes) for individuals aged 16 years and over per groups of sex and age in the whole Galicia and for the four provinces of Galicia. For each sex, the following 11 age groups are considered (in years): 16-19, 20-24, 25-29, 30-34, 35-39, 40-44, 45-49, 50-54, 55-59, 60-64 and over 65. Therefore, the direct estimates ˆNdtdir could also be considered as population projections for the studied domains (counties crossed by sex). They are in fact the official best estimates of our domain sizes. In practiceNdt is unknown and might be estimated by combining administrative registers and population projections models. In the case of the SLFS, Ndt is estimated by means of ˆNdtdir. The model-based approach of this paper assumes thatNdt = ˆNdtdir is a known non random quantity.
In the fourth quarter of 2011 the domain sample sizes are in the interval (13,1554), with median 97. Therefore, the direct estimates in (2.1) are not reliable and small area estimation methods are needed. As an alternative to direct estimators, this paper proposes area-level model-based estimators using auxiliary information from administrative registers and from survey data. The target variable is ydt = (yd1t, yd2t)0, where a0 denotes “transpose of vector a” and ydkt is the sample total
ydkt =
X
j∈Sdt
ydktj, d= 1, . . . , D, k= 1,2, t= 1, . . . , T.
The corresponding sample proportions are ˜pdkt =ydkt/ndt, where ndt is the size of the domain sample Sdt. The auxiliary variables are taken from administrative registers along the T = 10 time periods from III/2009 to IV/2011. We use as auxiliary variables the domain proportions of individuals within the categories of the following grouping variables:
• SEXAGE: This variable is the combination of sex and age groups. SEX has two groups (men and women) and AGE is categorized in 3 groups (6-24, 25-54 and ≥55). The codes 1,2,...,6 are used for 1:Men16-24, 2:Men25-54, 3:Men≥55, 4:Women16-24, 5:Women25-54 and 6:Women≥55.
• EDU: This variable describes the achieved education level, with three values: illiterate and the primary (1:lowEDU), the secondary (2:secondaryEdu) and the higher education level (3:highEDU).
• REG: This variable indicates if an individual is registered or not as unemployed in the ad-ministrative register of unemployment claimants. Unemployment can be measured through the data from the administrative register of unemployment claimants (auxiliary variable) or from the Labour Force Survey (target variable). The unemployment measurements in these two data sources are different but correlated. We are interested in the Labour Force Survey definition. This is the one that follows the recommendations of the International Labour Organization (ILO) and EUROSTAT; i.e. it measures unemployment as the num-ber of jobless people who want to work, are available to work and are actively seeking employment.
• NIC: This variable indicates if an individual is paying “National Insurance Contributions” (NICs). The NICs are paid by employees and employers on earnings, and by employers on certain benefits-in-kind provided to employees.
Figures 2.1 and 2.2 plot the sample proportions of employed and unemployed people along the ten time periods under study and over the SEXAGE and EDU categories. For each time period
tand categorycof SEXAGE or EDU, the plotted sample proportions arenktc/ntc, wherenktc is the sample size of the subset defined by labour status k(k= 1,2,3), time periodtand category
c in the SLFS of Galicia, and ntc =n1tc+n2tc+n3tc. Figure 2.1 contains six lines with labels 1-6 for the six categories of SEXAGE. Similar labels for the categories of EDU appears in Figure 2.2. In this figure it is worth to point out that the low unemployment proportion within the subset of the least educated people can be explained by the high amount of inactive people in this education level. This is thus an age effect rather than an education effect. We observe heterogeneity in levels and in trends. This suggests that plotted proportions have different behaviours across categories and time periods.
For d = 1, . . . , D and t = 1, . . . , T, Figure 2.3 shows the scatterplots of the log-rates of
employed over inactive people, logp˜d1t
˜
pd3t, versus the proportions of people in the national insurance
contribution system (left) and the log-rates of unemployed over inactive people, logp˜d2t
˜
pd3t, versus
the proportions of people registered as unemployed (right). The same symbol (a circle) is used for the 10 time periods. We observe that, despite the large variability observed in both plots, the log-rates of the two considered proportions seem to increase linearly with the proportions of people in the national insurance contribution system and registered as unemployed, respectively. Then we propose fitting the data with a multinomial model with logit link, including the time effect.
3
Mixed-effects multinomial models for the SLFS data
Molina et al. (2007) and L´opez-Vizca´ıno et al. (2013) analyzed the problem of interest by considering only one time period (T = 1). They introduced area-level multinomial mixed models, without temporal components, for estimating the total number of employed and unemployed
1 1 1 1 1 1 1 1 1 1 TIME Propor tion of emplo y ed 2 2 2 2 2 2 2 2 2 2 3 3 3 3 3 3 3 3 3 3 4 4 4 4 4 4 4 4 4 4 5 5 5 5 5 5 5 5 5 5 6 6 6 6 6 6 6 6 6 6 1 2 3 4 5 6 7 8 9 10 0.2 0.4 0.6 0.8 1 1 1 1 1 1 1 1 1 1 TIME Propor tion of unemplo y ed 2 2 2 2 2 2 2 2 2 2 3 3 3 3 3 3 3 3 3 3 4 4 4 4 4 4 4 4 4 4 5 5 5 5 5 5 5 5 5 5 6 6 6 6 6 6 6 6 6 6 1 2 3 4 5 6 7 8 9 10 0.05 0.10 0.15
Figure 2.1: Sample proportions of employed (left) and unemployed (right) people for the six categories of SEXAGE (1:Men16-24, 2:Men25-54, 3:Men≥55, 4:Women16-24, 5:Women25-54 and 6:Women≥55) along the ten time periods III/2009-IV/2011.
1 1 1 1 1 1 1 1 1 1 TIME Propor tion of emplo y ed 2 2 2 2 2 2 2 2 2 2 3 3 3 3 3 3 3 3 3 3 1 2 3 4 5 6 7 8 9 10 0.2 0.4 0.6 1 1 1 1 1 1 1 1 1 1 TIME Propor tion of unemplo y ed 2 2 2 2 2 2 2 2 2 2 3 3 3 3 3 3 3 3 3 3 1 2 3 4 5 6 7 8 9 10 0.05 0.10
Figure 2.2: Sample proportions of employed (left) and unemployed (right) people for the three categories of EDU (1:lowEDU, 2:secondaryEdu and 3:highEDU) along the ten time periods III/2009-IV/2011.
people. The multinomial models guarantee that the sum of the estimated totals of employed and unemployed people is lower than the total of people in a given territory. This is why they introduced multinomial logit mixed models for estimating the domain totals of employed, unemployed and inactive people in a coherent way. This property is not fulfilled if estimating the totals of employed and unemployed people by using two univariate models (for example, by using two separate logistic regression models, one for employed and another for unemployed people). In this last case it may happens that, for some domains, the sum of the estimated employed and unemployed people is greater than the size of the population aged 16 and over.
The model of L´opez-Vizca´ıno et al. (2013) does not use information from past time periods. This model (Model 1) defines random effects, vdk, associated to category k and domain d,
● ● ● ● ● ● ● ● ● ● ● ● ● ● ● ● ● ● ● ● ● ● ● ● ● ● ●● ● ● ● ● ● ● ● ● ● ●● ● ● ●●● ● ● ● ● ● ● ● ● ● ● ● ● ● ● ● ● ● ● ● ● ● ● ● ● ● ● ● ● ● ● ● ● ●● ● ● ● ● ●● ● ● ● ● ● ● ●●●●● ●●● ● ● ● ● ● ● ● ● ● ● ● ● ●● ● ● ●●●● ●● ● ●● ● ● ● ● ●● ● ● ● ● ● ● ● ●● ● ● ● ● ● ● ● ● ●● ● ● ● ●● ● ●● ● ● ●● ● ●●● ● ● ● ● ● ● ● ● ● ● ● ● ● ● ● ● ● ● ● ● ● ● ● ● ● ● ● ● ● ● ● ● ● ● ● ● ● ● ● ● ● ● ● ● ● ● ● ● ● ● ● ● ● ● ● ● ● ● ● ● ● ●●● ● ● ● ● ● ● ● ● ● ● ● ● ● ● ●● ● ● ●● ● ● ● ●● ● ● ● ● ● ● ● ● ● ●●● ● ● ● ● ● ● ● ● ● ● ● ● ● ●● ● ● ● ● ● ● ● ● ● ● ● ● ● ●● ● ● ● ● ● ● ● ●● ● ● ●● ● ● ●● ● ● ● ● ● ● ● ● ● ● ● ● ● ● ● ● ● ● ● ●● ● ● ● ● ● ● ● ● ● ● ● ● ● ●● ● ● ●● ● ● ● ● ● ● ● ● ● ● ● ● ● ● ● ●● ● ● ● ● ● ● ● ●● ● ● ● ● ● ● ● ● ● ● ● ● ● ● ● ● ●● ●● ● ● ● ●● ● ● ● ● ● ● ● ● ● ● ● ● ● ● ● ● ● ● ● ● ● ● ● ● ● ● ● ● ● ● ● ●● ● ●●● ● ●● ● ● ● ●● ● ● ● ●● ● ● ● ● ● ● ● ● ● ● ● ● ● ● ● ● ● ● ● ● ● ● ●● ● ● ● ● ●● ● ● ● ● ● ● ● ● ● ● ● ● ● ● ● ● ● ● ● ● ● ● ● ● ● ● ● ● ● ● ● ● ● ● ● ● ● ● ● ● ● ● ● ● ● ● ● ● ● ● ● ● ● ● ● ● ● ● ● ● ● ● ● ●● ● ● ● ● ● ● ● ●● ● ● ● ● ●● ● ● ● ● ● ● ● ●●● ● ● ● ● ● ● ● ● ● ●●● ● ● ● ● ● ●● ● ● ● ●● ● ● ● ● ● ●● ● ● ● ● ● ● ● ● ● ● ● ● ● ● ● ● ● ● ● ● ● ● ● ● ● ● ● ● ● ● ● ● ● ● ● ● ● ● ● ● ● ● ● ●● ● ● ● ● ● ● ● ●● ● ● ● ●● ● ● ● ●● ● ● ● ● ● ● ● ● ● ● ● ● ● ● ● ● ● ● ●● ● ● ● ● ● ● ● ● ●●● ● ● ● ● ● ● ● ●● ● ● ●●● ● ● ●● ● ●● ● ● ●● ● ● ● ● ● ● ● ● ● ● ● ● ● ● ● ● ● ● ● ● ● ● ● ● ● ● ● ● ● ● ● ● ●● ● ● ● ●● ● ● ● ● ● ● ● ● ● ● ● ●●● ● ● ● ● ●●●● ● ●●● ● ● ● ● ● ● ● ● ● ● ● ● ● ● ● ● ● ● ● ● ● ● ● ● ● ● ● ● ● ● ● ● ● ● ● ● ● ● ● ● ● ● ● ● ● ● ●● ● ● ● ● ● ● ● ● ● ● ● ● ● ● ● ● ● ● ● ● ● ● ● ● ● ●●● ● ● ● ● ● ● ● ● ● ● ● ● ● ● ● ● ● ● ● ● ● ● ● ● ● ● ● ● ● ● ● ● ● ● ● ● ● ● ● ● ● ● ● ● ● ● ● ● ● ● ● ● ● ● ● ● ● ● ● ● ● ● ● ● ● ●● ● ● ● ●● ● ● ● ● ● ● ● ● ● ●● ● ● ● ● ● ● ● ● ●● ● ● ● ● ●● ● ● ●● ● ● ● ● ● ● ● ● ● ● ● ● ● ●● ● ● ● ● ● ● ● ● ●● ● ● ● ● ● ● ● ● ● ● ● ● ● ● ● ● ● ● ● ● ● ● ● ● ● ● ● 0.20 0.25 0.30 0.35 0.40 0.45 0.50 −7.0 −6.5 −6.0 −5.5 −5.0
Proportion of people in the NIC system
log(Emplo yed/Inactiv e) ● ● ● ● ● ● ● ● ● ● ● ●● ● ●●● ● ● ● ● ● ● ● ● ● ● ● ●● ● ● ● ● ● ● ● ● ● ● ● ● ● ● ● ● ● ● ● ● ● ● ● ● ● ● ● ● ● ● ● ● ● ● ● ●● ● ● ● ● ● ● ● ● ● ● ● ● ● ● ● ● ● ● ● ● ● ● ● ● ●●● ●● ● ● ● ● ● ● ● ● ● ● ● ● ● ● ● ● ● ● ● ● ● ● ● ● ● ● ● ● ● ● ● ● ● ● ● ● ● ● ● ● ● ● ● ● ● ● ● ● ● ● ● ● ● ● ● ● ● ● ● ● ● ● ● ● ● ● ● ● ● ● ● ● ● ● ● ● ● ● ● ● ● ● ● ● ● ● ● ● ● ● ● ● ● ● ● ● ● ● ● ● ● ● ● ● ● ● ● ● ● ● ● ● ● ● ● ● ● ● ● ● ● ● ● ● ● ● ● ● ● ●●● ● ● ● ● ● ● ● ● ● ● ● ● ● ● ● ● ● ● ● ● ● ● ● ● ● ● ● ● ● ● ● ● ● ● ● ● ● ● ● ● ● ● ● ● ● ● ● ● ● ● ● ● ● ● ● ● ● ● ● ● ● ● ● ● ● ● ● ● ● ● ● ● ● ● ● ● ● ● ● ● ● ● ● ● ● ● ●● ● ● ● ● ● ● ● ● ● ● ● ● ● ●● ● ● ● ● ● ● ● ● ● ● ● ● ● ● ● ● ● ● ● ● ● ● ● ● ● ● ● ● ● ● ● ● ● ● ● ● ● ● ● ● ● ● ● ● ● ● ● ● ● ● ● ● ● ● ● ● ● ● ● ● ● ● ● ● ● ● ● ● ● ● ● ● ● ● ● ● ● ● ● ● ● ● ● ● ●● ● ● ● ● ● ● ● ● ●●● ● ● ● ● ● ● ● ● ● ● ● ● ● ● ● ● ● ● ● ● ● ● ● ● ● ● ● ● ● ● ● ● ● ● ● ● ● ● ● ● ● ● ● ● ● ● ● ● ● ● ● ● ● ● ● ● ● ● ● ● ● ● ● ● ● ● ● ● ● ● ● ● ● ● ● ● ● ● ● ● ● ● ● ● ● ● ● ● ● ● ● ● ● ● ● ● ● ● ● ● ● ● ● ● ● ● ● ● ● ● ● ● ● ● ●● ● ● ● ●● ● ● ● ● ● ● ● ● ● ● ● ● ● ● ● ● ● ● ● ● ● ● ● ● ● ● ● ● ● ● ● ● ● ● ● ● ● ● ● ● ● ● ● ● ● ● ● ● ● ● ● ● ● ● ● ● ● ● ● ● ● ● ●● ● ● ● ● ● ● ● ● ● ● ● ● ● ●● ● ● ● ● ● ● ● ● ● ● ● ● ● ● ● ● ● ● ● ● ● ● ● ● ● ● ● ● ● ● ● ● ● ● ● ● ● ● ● ● ● ● ● ● ● ● ● ● ● ● ● ● ● ● ● ● ● ● ● ● ●● ● ● ● ● ● ● ● ● ● ● ● ● ● ● ● ● ● ● ● ● ● ● ● ● ● ●●● ● ● ● ●● ● ● ● ● ● ● ● ● ● ● ● ● ● ● ● ● ● ● ● ● ● ● ● ● ● ● ● ● ● ● ● ● ● ● ● ● ● ● ● ● ● ● ● ● ● ● ● ● ● ● ● ● ● ● ● ● ● ● ● ● ● ● ● ● ● ● ● ● ● ● ● ● ● ● ● ● ● ●● ● ● ● ● ● ● ● ● ● ● ● ● ● ● ● ● ● ● ● ● ● ● ● ● ● ● ● ● ● ● ● ● ● ● ● ● ● ●● ● ● ● ● ● ● ● ● ● ● ● ● ● ● ● ● ● ● ● ● ● ● ● ● ● ● ● ● ● ● ● ● ● ● ● ● ● ● ● ● ● ● ● ● ● ● ● ● ● ● ● ● ● ● ● ● ● ● ● ● ● ● ● ● ● ● ● ● ● ● ●● ● ● ● ● ● ● ● ● ● ● ● ● ● ● ● 0.04 0.06 0.08 0.10 0.12 0.14 −9.5 −9.0 −8.5 −8.0 −7.5 −7.0 −6.5 −6.0
Proportion of registered unemployed
log(Unemplo
yed/Inactiv
e)
Figure 2.3: Log-rates of employed and unemployed over inactive people versus proportions of people in the national insurance contribution system (left) and registered as unemployed (right), respectively.
k = 1,2,d= 1, . . . , D. In vector form, random effects arevd = (vd1, vd2)0. The model assumes
that vd ∼ N(0,Vvd) are independent with covariance matrices Vvd = diag(ϕ11, ϕ12). It also
assumes that the response vectors yd = (yd1, yd2)0, conditioned to vd, are independent with multinomial distributions yd|v
d∼M(nd, pd1, pd2),d= 1, . . . , D, wherendis the domain sample
size. For the natural parameters ηdk = log(pdk/pd3), d= 1, . . . , D,k= 1,2, the model assumes
ηdk = xdkβk +vdk, where xdk = (xdk1, . . . , xdkrk) are the vector of auxiliary variables, βk =
(βk1, . . . , βkrk)
0 are the vectors of regression parameters and r = r
1 +r2 the total number of auxiliary variables. Molina et al. (2007) considered a particular version of Model 1. They assumed a common random effect for the categories of employed and unemployed people, so that Model 0 is obtained by making vd1 =vd2 in Model 1.
This paper generalizes Model 1 by introducing two new models that take into account tempo-ral components. In order to use the data from all the available periods in the estimation process, we employ two new multinomial mixed models. The new models define random effectsu1,dkand
u2,dktassociated to the domaindand the categorykand to the domaind, the categorykand the time period t, respectively. We consider two sets of random effectsu = (u1,u2). The first one is u1 = (u01,1, . . . ,u01,D)
0, with u
1,d = (u1,d1, u1,d2)0. The second one is u2 = (u02,1, . . . ,u02,D) 0,
with u2,d = (u02,d1,u20,d2)0, u2,dk = (u2,dk1, . . . , u2,dkT)0, k = 1,2, and u2,dt = (u2,d1t, u2,d2t)0. The target variable is y = (y01, . . . ,y0D)0, where yd = (y0d1, . . . ,y0dT)0 and ydt = (yd1t, yd2t)0,
d = 1, . . . , D, t= 1, . . . , T. By the nature of the data, the best option might be a model with
temporal dependence. Therefore, the main model (Model 3) assumes that
1. u1 and u2 are independent,
2. u1∼N(0,Vu1), where Vu1 = diag
1≤d≤D
(diag(ϕ11, ϕ12)),
matrix, i.e. Vu2,dk =ϕ2kΩ(φk) and Ω(φk) = 1 1−φ2 k 1 φk . . . φTk−2 φTk−1 φk 1 . .. φTk−2 .. . . .. . .. . .. ... φTk−2 . .. 1 φk φTk−1 φTk−2 . . . φk 1 T×T .
Model 3 also assumes that the response vectors ydt, conditioned to u1,d andu2,dt, are indepen-dent with multinomial distributions
ydt|u
1,d,u2,dt ∼M(ndt, pd1t, pd2t), d= 1, . . . , D, t= 1, . . . , T. (3.1)
For the natural parameters ηdkt = log(pdkt/pd3t), Model 3 assumes
ηdkt=xdktβk+u1,dk+u2,dkt, d= 1, . . . , D, k= 1,2, t= 1, . . . , T, (3.2)
where xdkt= (xdkt1, . . . , xdktrk)
0 and β
k = (βk1, . . . , βkrk)
0. Equivalently, we can write
pdkt=
exp{ηdkt}
1 + exp{ηd1t}+ exp{ηd2t}
, d= 1, . . . , D, k= 1,2, t= 1, . . . , T.
From Model 3, three simpler models can be derived. Model 2 is obtained by restricting Model 3 toφ1=φ2 = 0 and therefore it contains independent random effectsu2,dkt. Model 1 is obtained by restricting Model 2 to one time period (T = 1) and by considering only the random effect u1. This is the model studied by L´opez-Vizca´ıno et al. (2013). Model 0 is obtained by making
u1,d1 =u1,d2 in Model 1. This is the model studied by Molina et al. (2007).
To fit the models we combine the penalized quasi-likelihood method (PQL), introduced by Breslow and Clayton (1996) for estimating and predicting theβkr’s, theu1,dk’s and theu2,dkt’s, with the restricted maximum likelihood method (REML) for estimating the variance components
ϕ1k, ϕ2k and φk, k= 1, . . . , q−1. The presented method is based on a normal approximation
to the joint probability distribution of the vector (y,u). The combined algorithm was first introduced by Schall (1991) and later used by Saei and Chambers (2003), Molina et al. (2007) and Herrador et al. (2009) in applications of generalized linear mixed models to small area estimation problems. In this work, we adapt the combined algorithm to Model 3. The algorithm has two parts. In the first part the algorithm updates the values ofβ,u1 andu2. In the second part it updates the variance components.
4
The application to the SLFS data
This section gives an application of the four considered mixed-effects multinomial models to the estimation of labour force indicators. The models are fitted to the data and the set of significant auxiliary variables is obtained. The set of available auxiliary variables contains the domain proportions of people in the categories of REG, NIC, SEXAGE and EDU. In this way, all the auxiliary variables appearing in the fitted models are covariables. Model selection is done by using descriptive tools and testing procedures. Finally, the model-based estimates of totals of employed and unemployed people and of unemployment rates are obtained and their
mean squared errors are estimated. This section starts by presenting some tables with estimated regression coefficients and variance components.
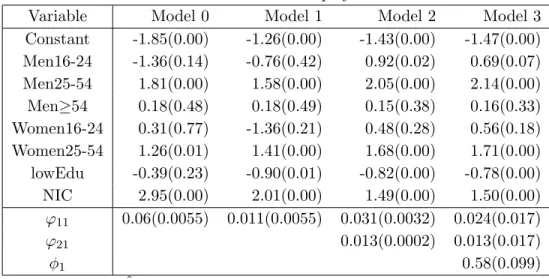
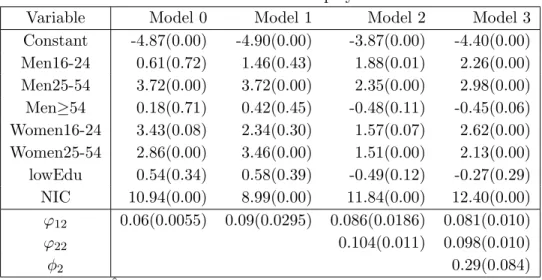
Tables 4.1 and 4.2 present the estimated regression coefficients of Models 0-3 for employed and unemployed people respectively, and their corresponding p-values for testing the hypothesis
H0 : βkr = 0. lowEdu indicates the proportion of people in the first category of the variable EDU. This variable is significant (with p-value lower than 0.05) for the category of employed people in models 1-3. The second category (secondaryEdu) is not significant for unemployed people in Models 0-3 and for employed people in Model 3 (our reference model). This is why secondaryEdu does not appear in the set of selected auxiliary variables.
The estimates of the model variances and their asymptotic standard deviations appear at the bottom of Tables 4.1 and 4.2. The asymptotic normal distribution of the variance component es-timators are used to derive confidence intervals. You can see that the 95% asymptotic confidence intervals for ϕ11 andϕ12 are 0.011±0.0108 and 0.090±0.0578, respectively. These intervals do not contain the zero, which suggests employing Model 1 instead of Model 0. Now, if you study the 95% asymptotic confidence intervals for ϕ21 andϕ22 are 0.013±0.0004 and 0.104±0.0216, respectively, which suggests applying Model 2 instead of Model 1. The 95% asymptotic confi-dence intervals for φ1 andφ2 are 0.58±0.19 and 0.29±0.16, respectively, which do not contain the zero. This supports using the Model 3 for estimating the labour force indicators.
Employed
Variable Model 0 Model 1 Model 2 Model 3
Constant -1.85(0.00) -1.26(0.00) -1.43(0.00) -1.47(0.00) Men16-24 -1.36(0.14) -0.76(0.42) 0.92(0.02) 0.69(0.07) Men25-54 1.81(0.00) 1.58(0.00) 2.05(0.00) 2.14(0.00) Men≥54 0.18(0.48) 0.18(0.49) 0.15(0.38) 0.16(0.33) Women16-24 0.31(0.77) -1.36(0.21) 0.48(0.28) 0.56(0.18) Women25-54 1.26(0.01) 1.41(0.00) 1.68(0.00) 1.71(0.00) lowEdu -0.39(0.23) -0.90(0.01) -0.82(0.00) -0.78(0.00) NIC 2.95(0.00) 2.01(0.00) 1.49(0.00) 1.50(0.00) ϕ11 0.06(0.0055) 0.011(0.0055) 0.031(0.0032) 0.024(0.017) ϕ21 0.013(0.0002) 0.013(0.017) φ1 0.58(0.099)
Table 4.1: ˆβ(p-value) and ˆϕ(Std.Dev.) for Employed in 2011-IV.
The parametric bootstrap method mimics the true distribution of the parameter estimators and gives more precise confidence intervals for the model parameters. Table 4.3 presents the bootstrap percentile 95% confidence intervals for the variance component parameters of Model 3. They do not contain the zero, which suggests employing Model 3. Based on the bootstrap and on the asymptotic confidence intervals for the variance component parameters, we select Model 3. Nevertheless, as we are also interested in comparing the behavior of all the considered models, we also present some selected results under Models 0-2.
Models 2 and 3 use information from past time periods, in addition to the data from the actual period. Therefore, it is expected that they give better results than Models 0 and 1. By using the confidence intervals of the model parameters, we conclude that Models 2 and 3 fit better to data than Models 0 and 1. Models 2 and 3 can be also compared with some measures for model comparison like the conditional loglikelihood ofygivenuor the Bayesian information
Unemployed
Variable Model 0 Model 1 Model 2 Model 3
Constant -4.87(0.00) -4.90(0.00) -3.87(0.00) -4.40(0.00) Men16-24 0.61(0.72) 1.46(0.43) 1.88(0.01) 2.26(0.00) Men25-54 3.72(0.00) 3.72(0.00) 2.35(0.00) 2.98(0.00) Men≥54 0.18(0.71) 0.42(0.45) -0.48(0.11) -0.45(0.06) Women16-24 3.43(0.08) 2.34(0.30) 1.57(0.07) 2.62(0.00) Women25-54 2.86(0.00) 3.46(0.00) 1.51(0.00) 2.13(0.00) lowEdu 0.54(0.34) 0.58(0.39) -0.49(0.12) -0.27(0.29) NIC 10.94(0.00) 8.99(0.00) 11.84(0.00) 12.40(0.00) ϕ12 0.06(0.0055) 0.09(0.0295) 0.086(0.0186) 0.081(0.010) ϕ22 0.104(0.011) 0.098(0.010) φ2 0.29(0.084)
Table 4.2: ˆβ(p-value) and ˆϕ(Std.Dev.) for Unemployed in 2011-IV.
Parameter ϕ11 ϕ12 ϕ21 ϕ22 φ1 φ2
Lower limit 0.010 0.020 0.008 0.059 0.120 0.009 Upper limit 0.118 0.113 0.014 0.103 0.675 0.514 Table 4.3: Bootstrap 95% confidence intervals for Model 3.
criterion (BIC) based on logf(y|u). The calculated conditional loglikelihod is
logf(y|ˆu,βˆ) = D X d=1 T X t=1 ( 2 X k=1 ydktηˆdkt−νdtlog 1 + 2 X k=1 exp{ˆηdkt} + log νdt yd1t!yd2t!yd3t! ) , where ˆηdkt = Prk r=1xdktrβˆkr+ ˆu1,dk+ ˆu2,dkt, d= 1, . . . , D, k= 1,2, t= 1, . . . , T, and ˆβkr, ˆu1,dk and ˆu2,dkt are obtained from the output of the PQL fitting algorithm. The resulting values of these measures are listed in Table 4.4. We can see that Model 3 has greater conditional loglikelihood and lower conditional BIC than Model 2. Therefore we recommend Model 3.
Model 2 Model 3 Conditional loglikelihood -354090 -284000
Conditional BIC 708318.6 568153.1
Table 4.4: Measures for model comparison.
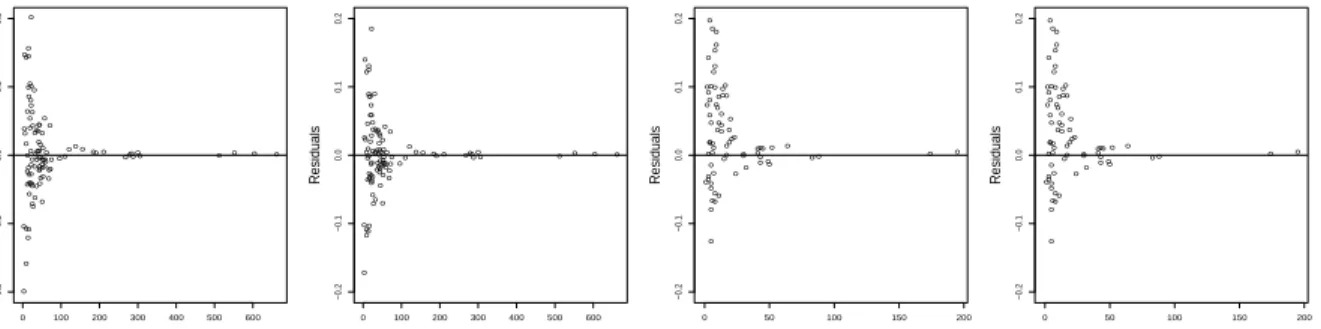
For carrying out a further diagnosis of the models, we calculate the predicted sample totals ˆ
ydkt=ndtpˆdkt and the domain relative residuals
rdkt =
ydkt−yˆdkt ˆ
ydkt
, d= 1, . . . ,102, k = 1,2, t= 1, . . . ,10.
Figure 4.1 plots the domain relative residuals versus the predicted sample totals of employed and unemployed people for the Models 2 and 3. The residuals are symmetrically situated above and below zero, so there is no prediction bias. The variability of the residuals decreases as predicted
employed or unemployed sample totals increase. This pattern is due to the fact that domains with greater amount of employed and unemployed people also have greater sample sizes. There are no high residuals in absolute value or any other unusual pattern. Therefore, Models 2 and 3 seem to properly fit and describe the data. As we do not observe significant differences between residual plots from the two temporal models, we maintain the decision of using Model 3 for estimating the SLFS indicators.
In what follows, we introduce the model-based estimators of the domain totals of employed and unemployed people. Let us write the synthetic domain totals of employed and unemployed people in vector form, i.e. mdt =Ndtpdt, wherepdt= (pd1t, pd2t)0 andNdt is the population size of domain d at time t. We take Ndt = ˆNdtdir as a known non random population quantity. We estimate mdt by means of the plug-in estimator ˆmdt =Ndtpˆdt= ( ˆmd1t,mˆd2t)0, where
ˆ pdt = (ˆpd1t,pˆd2t)0, pˆdkt= exp{ˆηdkt} 1 + exp{ηˆd1t}+ exp{ηˆd2t} , d= 1, . . . , D, k= 1,2, t= 1, . . . , T, (4.1) where the linear predictors, ˆηdkt, have been defined above.
● ● ● ● ● ● ● ● ● ● ● ● ● ● ● ● ● ● ● ● ● ● ● ● ● ● ● ● ● ● ● ● ● ● ● ● ● ● ● ● ● ● ● ● ● ● ● ● ● ● ● ● ● ● ● ● ● ● ● ●● ● ● ● ● ● ● ● ● ● ● ● ● ● ● ●● ● ● ● ● ● ●● ● ● ●● ● ● ● ●●●●● ● ● ● ● 0 100 200 300 400 500 600 −0.2 −0.1 0.0 0.1 0.2 Model 2
Predicted employed people
Residuals ● ● ● ● ● ● ● ● ● ● ● ● ● ● ● ● ● ● ● ● ● ● ● ● ● ● ● ● ● ● ● ● ● ● ● ● ● ● ● ● ● ● ● ● ● ● ● ● ● ● ● ● ● ● ● ● ● ● ● ● ● ● ● ● ● ● ● ● ● ● ● ●● ● ● ● ● ● ● ● ● ● ● ● ● ● ●● ●● ●●●●●● ●● ● ● 0 100 200 300 400 500 600 −0.2 −0.1 0.0 0.1 0.2 Model 3
Predicted employed people
Residuals ● ● ● ● ● ● ● ● ● ● ● ● ● ● ● ● ● ● ● ● ● ● ● ● ● ● ● ● ● ● ● ● ● ● ● ● ● ● ● ● ● ● ● ● ● ● ● ● ● ● ● ● ● ● ● ● ● ● ● ● ● ● ● ● ● ● ● ● ● ● ● ● ● ● ● ● ● ● ● ● 0 50 100 150 200 −0.2 −0.1 0.0 0.1 0.2 Model 2
Predicted unemployed people
Residuals ● ● ● ● ● ● ● ● ● ● ● ● ● ● ● ● ● ● ● ● ● ● ● ● ● ● ● ● ● ● ● ● ● ● ● ● ● ● ● ● ● ● ● ● ● ● ● ● ● ● ● ● ● ● ● ● ● ● ● ● ● ● ● ● ● ● ● ● ● ● ● ● ● ● ● ● ● ● ● ● 0 50 100 150 200 −0.2 −0.1 0.0 0.1 0.2 Model 3
Predicted unemployed people
Residuals
Figure 4.1: Domain relative residuals versus predicted sample totals of employed (left) and unemployed (right) people for Models 2 and 3 in the fourth quarter of 2011.
Figure 4.2 plots the model-based ( ˆmdkt) versus the direct ( ˆYdktdir) estimates of the population totals of employed (left) and unemployed (right) people in logarithmic scale for Models 2 and 3 in the fourth quarter of 2011. We observe, in the two models, that the direct and the model-based estimates behave quite similarly for employed people. This is because the population of employed people is quite large and there are plenty of sampled observations within this category. However, the direct and the model-based estimates behave slightly different for unemployed people, which is due to the lower number of sampled observations within the category. We also observe that the model-based estimates are lower than the direct ones for large values. This is a typical and desirable smoothing effect of model-based estimators.
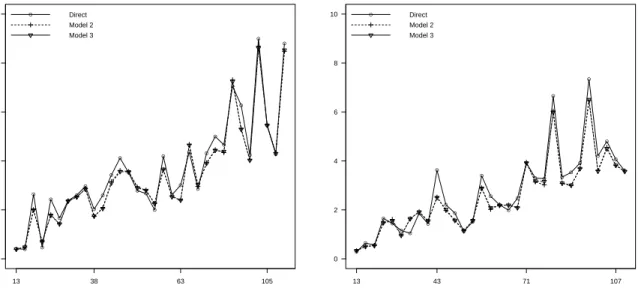
Figures 4.3 and 4.4 plot the estimated employment totals and unemployment rates, respec-tively by sex for Models 2 and 3 in the fourth quarter of 2011. Counties are sorted by sample size. The estimated employment totals and unemployment rates tend to coincide for counties with large sample size. We observe that all estimators behave very similarly for the category of employed people. This is because the population in this category is quite large. In this case we only plot the results of counties with small sample size. For the unemployment rates, the direct and the model-based estimators are closer as soon as the sample size increases. The same pattern is observed in the the rest of quarters. For the sake of brevity we skip the corresponding figures.
● ● ● ● ● ● ● ● ● ● ● ● ● ● ●●● ● ● ● ● ● ● ● ● ● ● ● ● ● ● ● ● ● ● ● ● ● ● ● ● ● ● ● ●●● ● ● ● ● ● ● ● ● ● ● ● ● ●● ● ● ● ●● ● ● ● ● ● ● ● ● ● ● ● ● ● ● ● ● ● ● ●● ● ● ● ●● ● ● ● ●● ●● ●●● ● −1 0 1 2 3 4 −1 0 1 2 3 4
Employed people − model 2
ln(direct estimate) ln(model estimate) ● ● ● ● ● ● ● ● ● ●● ● ● ● ●●● ● ● ● ● ● ● ● ● ● ● ● ● ● ● ● ● ● ●● ● ● ● ● ● ● ● ● ●●● ● ● ● ● ● ● ● ● ● ● ● ● ●● ● ● ● ● ● ● ● ● ● ● ● ● ● ● ● ● ● ● ● ● ● ● ● ●● ● ● ● ●● ● ● ● ●● ●● ●●● ● −1 0 1 2 3 4 −1 0 1 2 3 4
Employed people − model 3
ln(direct estimate) ln(model estimate) ● ● ● ● ● ● ● ● ● ● ● ●● ● ● ● ● ● ● ● ● ● ● ● ● ● ● ● ● ● ● ● ● ● ● ● ● ● ● ● ● ● ● ● ● ● ● ● ● ● ● ●● ● ● ● ● ● ● ● ● ● ● ● ●● ● ● ● ● ● ● ● ● ●● ● ● ● ● ● ● ●● ● ● ● ● ●● ● ● ● ● ●● −2 −1 0 1 2 3 −2 −1 0 1 2 3
Unemployed people − model 2
ln(direct estimate) ln(model estimate) ● ● ● ● ● ●●● ● ● ● ● ● ● ● ● ● ● ● ● ● ● ● ● ● ● ● ● ● ● ● ● ● ● ● ● ● ● ● ● ● ● ● ● ● ● ● ● ● ● ● ●● ● ● ● ● ● ● ● ● ● ● ● ●● ● ● ● ● ● ● ● ● ●● ● ● ● ● ● ● ●●● ● ● ● ●● ● ● ● ● ●● −2 −1 0 1 2 3 −2 −1 0 1 2 3
Unemployed people − model 3
ln(direct estimate)
ln(model estimate)
Figure 4.2: Model-based versus direct estimates of totals of employed (left) and unemployed (right) people (in thousands and logarithmic scale) for Models 2 and 3 in the fourth quarter of 2011. ● ● ● ● ● ● ● ● ● ● ● ● ● ● ● ● ● ● ● ● ● ● ● ● ● ● ● ● ● ● ● ● 13 38 63 105 0 2 4 6 8 10 Sample size ● Direct Model 2 Model 3
Employed men (thousands)− IV/2011
● ● ● ● ● ● ● ● ● ● ● ● ● ● ● ● ● ● ● ● ● ● ● ● ● ● ● ● ● ● ● 13 43 71 107 0 2 4 6 8 10 Sample size ● Direct Model 2 Model 3
Employed women (thousands)− IV/2011
Figure 4.3: Direct and model-based estimates of totals of employed men (left) and women (right) for counties with small sample size in the fourth quarter of 2011.
The appendix presents two alternative methods for estimating the mean squared errors of the plug-in estimator ˆmdt. The first procedure, given in (8.3), is based on a Taylor linearization of the link function. The second one, given in (8.4), is a parametric bootstrap approach. As the simulation experiment carried out in Section 5 shows that the second method gives better estimation results than the first one, we employ the parametric bootstrap in what follows.
Figure 4.5 plots the parametric bootstrap estimates of the relative root mean squared errors (RRMSE) in % of the model-based estimators of unemployment rates by assuming in both cases, as true generating model, the selected model (Model 3). The RRMSE of a given estimator is obtained by dividing its root-MSE by its absolute value.
The implementation of Model 2 is simpler and the corresponding calculations of model-based estimates and mean squared errors require less computational time. In this sense, Model 2 is a parsimonious model. As Model 2 has also an acceptably good fit to data, it is also interesting to analyze the behaviour of the RRMSE estimates obtained by applying Model 2 when the true
● ● ● ● ● ● ● ● ● ● ●● ● ● ●● ● ● ● ● ● ● ● ● ● ● ● ● ● ● ● ● ● ● ● ● ● ● ● ● ● ● ● ● ● ● ● ● ● ● 13 38 63 105 172 0 10 20 30 40 Sample size ● Direct Model 2 Model 3
Unemployment rate − men − IV/2011
● ● ● ● ● ● ● ● ● ● ● ● ● ● ●● ● ● ● ● ● ● ● ● ● ● ● ● ● ● ● ● ● ● ● ● ● ● ● ● ● ● ● ● ● ● ● ● ● 13 43 71 107 189 0 10 20 30 40 Sample size ● Direct Model 2 Model 3
Unemployment rate − women − IV/2011
Figure 4.4: Direct and model-based estimates of unemployment rates for men (left) and women (right) for counties with small sample size in the fourth quarter of 2011.
generating model is Model 3. Figure 4.5 shows that, under Model 3, the RRMSE estimates of Model 2 are quite larger than the corresponding ones of Model 3. As the RRMSEs of the direct estimates are much higher than their model-based counterparts, they are not plotted in Figure 4.5. Model 2 Model 3 5 10 15 20 25 30 35
RRMSE men unemployment rate − IV/2011
● Model 2 Model 3 10 20 30 40
RRMSE women unemployment rate − IV/2011
Figure 4.5: RRMSEs of model-based estimators of unemployment rates in the fourth quarter of 2011 when the true generating model is Model 3.
Table 4.5 presents some condensed numerical results about unemployment rates, for estima-tors based on Models 2 and 3 in the fourth quarter of 2011, when the true generating model is
County 27 49 15 34 44 53 27 11 10 41 42 53 nd 13 40 65 107 179 1347 13 45 75 108 193 1554 dir 18.6 18.1 19.0 28.5 29.3 21.7 37.2 23.3 21.1 22.7 27.6 25.4 mod2 15.5 19.0 18.2 19.6 21.0 20.5 20.0 17.1 20.7 17.7 25.1 22.5 mod3 15.3 19.4 18.3 19.9 20.7 20.4 19.2 16.7 20.3 17.9 25.0 22.9 dir 146.4 71.9 51.5 26.5 19.1 8.4 59.0 55.1 55.7 34.8 25.2 7.7 mod2 36.4 26.8 21.7 22.7 16.2 7.2 39.1 28.9 24.1 23.1 15.6 6.4 mod3 22.1 16.0 12.1 10.7 8.6 3.6 28.7 19.2 16.2 11.0 10.2 3.1
Table 4.5: Estimated unemployment rates (top) and their estimated RRMSEs in % (bottom) for men (left) and women (right) in the fourth quarter of 2011 when the true generating model is Model 3.
Model 3. For each sex (men on the left and women on the right) we first sort the domains by sample size, starting by the domain with smallest sample size. Then we choose six domains in each sex category (the sixtiles). We would like to emphasize that there are 53 official counties in Galicia, with codes going from 1 to 53, but there are only 51 counties with sample in the Spanish Labour Force Survey. In this paper, we use the official codes. This is the reason why we have a code 53 in Table 4.5, that represents the county of Vigo, which at 375,599 is the most populated of Galicia. This is also the county with the highest sample size. We present the direct and model-based estimates (labeled by ”dir” and ”mod”, respectively) on the top and the corresponding RRMSE estimates in % on the bottom. The sample sizes are labeled by
nd. Table 4.5 shows that, under Model 3, the Model 3 estimators of unemployment rates have lower RRMSEs than the Model 2 corresponding estimators. By observing the rows of estimated RRMSEs we also conclude that model-based estimators are preferred to direct ones.
For an Official Statistics Agency it is good to have a reference value for the coefficient of variation, which could be used (as a rule of the thumb) for deciding if some elaborated data is publishable or not. For example, the Office for National Statistics (ONS) in the United Kingdom considers that an estimate is publishable in the labour force statistics, and therefore official, if the coefficient of variation is less than 20% (ONS, 2004). The ONS reference value is also used as reference value for some Spanish Statistics Agencies, like the Spanish Institute of Statistics or the Galician Institute of Statistics. Most of the RRMSEs values appearing in the Table 4.5 are below 20% and therefore fulfill the cited rule of the thumb for being publishable.
A way of measuring the benefits of using Model 2 and Model 3 is to check the stability of the estimates along the time periods. Figure 4.6 presents the women unemployment rates for the six counties presented in Table 4.5 and the model-based estimates derived under Model 0-3. In all considered counties (except in county 53 where the sample size is large), we observe that Model 2 and Model 3 estimates are more stable than direct, Model 1 and Model 0 estimates. Stability is a property highly valued by the Statistical Offices when publishing the survey results. This is because it is unlikely to find counties with employment indicators having systematically high differences between each two consecutive quarters.
The Spanish Statistics Institute (INE) publishes LFS estimates of employment and unem-ployment totals at province level. In the case of extending these publications to the more disaggregated levels, the Statistical Offices might be interested in publishing data with the property that the sum of the estimated totals in all the domains within a province coincide with the official province total estimate. In order to fulfil this consistency criterion, we propose a modification of all the considered small area estimators for Model 3. Let Ybptdir be the SLFS
● ● ● ● ● ● ● ● ● ● 1 2 3 4 5 6 7 8 9 10 0 10 20 30 40 Time, n= 13 ● Direct Model 0 Model 1 Model 2 Model 3 Unemploment rate − women − County 27
● ● ● ● ● ● ● ● ● ● 1 2 3 4 5 6 7 8 9 10 0 10 20 30 40 Time, n= 47 ● Direct Model 0 Model 1 Model 2 Model 3 Unemploment rate − women − County 11
● ● ● ● ● ● ● ● ● ● 1 2 3 4 5 6 7 8 9 10 0 10 20 30 40 Time, n= 66 ● Direct Model 0 Model 1 Model 2 Model 3 Unemploment rate − women − County 10
● ● ● ● ● ● ● ● ● ● 1 2 3 4 5 6 7 8 9 10 0 10 20 30 40 Time, n= 115 ● Direct Model 0 Model 1 Model 2 Model 3 Unemploment rate − women − County 41
● ● ● ● ● ● ● ● ● ● 1 2 3 4 5 6 7 8 9 10 0 10 20 30 40 Time, n= 191 ● Direct Model 0 Model 1 Model 2 Model 3 Unemploment rate − women − County 42
● ● ● ● ● ● ● ● ● ● 1 2 3 4 5 6 7 8 9 10 0 10 20 30 40 Time, n= 1510 ● Direct Model 0 Model 1 Model 2 Model 3 Unemploment rate − women − County 53
Figure 4.6: Unemployment rates in some counties and all periods.
estimator of the total Ypt of a variabley in the province p and the time period t. Assume that the province p is partitioned in Dp domains, labelled by d= 1, . . . , Dp. LetYbp,1t, . . . ,Ybp,Dpt be
some given model-based estimators of the totalsYp,1t, . . . , Yp,Dptof the variableyin the domains
d= 1, . . . , Dpand the periodt. In domainsdwithnd= 0, direct estimates cannot be calculated.
In those cases model-based estimates are calculated by using the synthetic part of the linear predictor. In general, the consistency property
b Yptdir= Dp X d=1 b Yp,dt
does not hold. In such cases, Ybp,1t, . . . ,Ybp,Dpt can be transformed into consistent estimators by
b Yp,dtc =λptYbp,dt, λpt= b Ydir pt PDp d=1Ybp,dt .
The SLFS of Galicia has 51 counties grouped into four provinces. Table 4.6 presents the direct and the model-based estimates (under Model 3) of totals of employed and unemployed people at the province level for men (top) and women (bottom) in the SLFS for the last period. Table 4.6 also gives the consistency factors λpt. We observe that the deviations from the SLFS direct estimates at the province level are at most of 10% for employed people. This is something expected as the amount of people in the category of employed is large. However, the deviations
Employed people Unemployed people
Province n dir mod3 λpt dir mod3 λpt
1 2874 248517 234085 1.06 45970 41493 1.11 2 1541 72917 69491 1.05 9308 9445 0.99 3 1336 59824 59213 1.01 13883 10840 1.28 4 2988 192842 181080 1.06 53478 46475 1.15 Total 8739 574101 543868 1.06 122639 108253 1.13 1 3258 225489 210558 1.07 44697 38363 1.17 2 1659 63163 59484 1.06 9305 7954 1.17 3 1479 51726 50380 1.03 12418 10848 1.14 4 3427 158416 153534 1.03 51304 43024 1.19 Total 9823 498794 473955 1.05 117723 100189 1.18
Table 4.6: Estimated men (top) and women (bottom) province totals in the fourth quarter of 2011.
from the SLFS estimation at the province level goes up over 20% for unemployed people only in the province with lowest sample size.
Figures 4.7 and 4.8 map the estimates of unemployment rates in each county of Galicia for the fourth quarter of 2011 (left) and the changes of the unemployment rates between the fourth quarter of 2009 and the fourth quarter of 2011 (right) for men and women respectively. The colors are more intense in areas with higher unemployment rates and higher variation. We observe that the counties of the west coast are those that, in general terms, have higher unemployment rates. These counties are more populated and have a higher proportion of young people than in the the rest of Galicia. In those areas live the 75% of the Galician population and the unemployment rates are also high because companies can not absorb as many workers. In Figures 4.7 and 4.8 we also observe that in the west coast most of the unemployment rates increased between 2009 and 2011. This increase was much higher for men than for women.
Unemployment rate − men − IV/2011
<=10 (7) >10 <= 15 (25) >15 <= 20 (14) >20 (7)
Change estimator − men − IV/2009−IV2011
<=1 (14) >1 <= 3 (7) >3 <= 5 (10) >5 (22)
Figure 4.7: Model 3 estimates of men unemployment rates in Galician counties in IV/2011 (left) and of variations between men unemployment rates from IV/2009 to IV/2011 (right).
Unemployment rate − women − IV/2011
<=10 (6) >10 <= 15 (21) >15 <= 20 (15) >20 (11)
Change estimator − women − IV/2009−IV2011
<=1 (19) >1 <= 3 (11) >3 <= 5 (6) >5 (17)
Figure 4.8: Model 3 estimates of women unemployment rates in Galician counties in IV/2011 (left) and of variations between women unemployment rates from IV/2009 to IV/2011 (right).
By running a parametric bootstrap algorithm, we have calculated the bootstrap percentile 95% confidence intervals for the differences of the unemployment rates between the fourth quarter of 2011 and the fourth quarter of 2009. A difference (change) is significative if its confidence interval does not contain the 0. Figures 4.9 maps the significative changes of the unemployment rates for men (left) and women (right). In the case of men, we find 11 counties with a significative positive change in the unemployment rate. They appear in black color in the Figures 4.9. In the case of women, we find 4 counties with a significative positive change.
Significative change − men − IV/2009−IV2011
Not significant (42) Significant (11)
Significative change − women − IV/2009−IV2011
Not significant (49) Significant (4)
Figure 4.9: Significative variations between men (left) and women (right) unemployment rates from IV/2009 to IV/2011.
We investigate if it is worthwhile including spatial aspects in the considered models. For this sake, we compute the Moran’s I test statistic for the predicted domain random effects obtained from fitting Model 2 and Model 3 and for the last period, with weights given by the elements of
Men Women u11 u12 u21 u22 u11 u12 u21 u22 Model 2 I-value -0.007 0.021 -0.015 0.027 -0.039 -0.035 -0.031 0.0159 p-value 0.47 0.031 0.07 0.016 0.38 0.62 0.75 0.08 Model 3 I-value -0.006 0.022 -0.016 0.031 -0.027 -0.036 -0.035 0.0135 p-value 0.46 0.030 0.06 0.0087 0.34 0.58 0.61 0.10
Table 4.7: Moran’sI test statistics andp-values for Models 2 and 3.
the proximity matrix. The proximity matrix is a distance matrix calculated from the locations of the county centroids. We further generate a matrix of inverse distance weights, where entries for pairs of counties that are close together are higher than pairs of counties that are far apart. The Moran’s I statistic is calculated by means of the function Monran.I() in package ape of R statistical software. Table 4.7 presents the resulting I-values for the domain random effects of Models 2 and 3 and for each sex. From the obtained test results we cannot reject, in most cases, the null hypothesis of no spatial correlation (thep-values are higher than 0.05). Modeling the spatial correlation between counties for the totals of employed and unemployed people is a hard task. It might require defining appropriate proximity or neighborhood matrices between counties and developping the corresponding new models that takes into account the considered type of spatial correlation. This is still an open problem.
We investigate the correlation between the two labour categories that is not explained by the auxiliary variables. We calculate the sample correlations of the empirical predictors of the random effects in Model 3. The sample correlation between the ˆu1,d1’s and the ˆu1,d2’s (between labour categories) is 0.19 with confidence interval (−0.0043,0.39), so we can assume independence between the sets of random effects associated to the categories of employed and unemployed people.
We finally investigate the correlation between the two sexes. For this sake, we rewrite the domains d = 1, . . . ,102 as (c, s), where c = 1, . . . ,51 for counties and s = 1,2 for sexes. We define u1,c,k = (u1,c,s=1,k, u1,c,s=2,k). The sample correlation between the ˆu1,c,s=1,k=1’s and the
ˆ
u1,c,s=2,k=1’s (between sexes in the category of employed people) is 0.39 with confidence interval (0.13,0.60), and the correlation between the ˆu1,c,s=1,k=2’s and the ˆu1,c,s=2,k=2’s (between sexes in the category of unemployed people) is −0.039 with confidence interval (−0.31,0.23). Therefore, we can assume independence between sexes within the category of unemployed people, but not within the category of employed people. Further, model extensions would be required for taking into account the last cited correlation.
5
Simulation experiment
The simulation experiment is designed to study the behaviour of the two mean square error estimators, analytic (8.3) and bootstrap (8.4), in a pseudo-real setup. The simulations mimic the behavior of the real data and help deciding between the analytic and the bootstrap-based MSE estimators in a more realistic way. The simulation also investigate the behavior of Model 3 for several values of T.
We take the same D = 102 domains as in the real data case with T = 5 or T = 10 time periods. If T = 5 we use the real data from the auxiliary variables in the last 5 time periods (quarters IV/2010 to IV/2011). If T = 10 we use the corresponding data from all the 10 considered time periods (quarters III/2009 to IV/2011). For the sake of simplicity, we only take
CONSTANT and the auxiliary variable NIC for the category k = 1 of employed people and CONSTANT and REG for the category k = 2 of unemployed people. We construct a Model 3 with the cited auxiliary variables and the parameters appearing in Table 4.4. This is to say, with β11 =−1.47, β12 = 1.50, ϕ11 = 0.024, ϕ21 = 0.013 and φ1 = 0.58 for the category k= 1 and β21=−4.40, β22= 12.40, ϕ12= 0.081, ϕ22 = 0.098 andφ2 = 0.29 for the categoryk= 2. We denote the vectors containing the regression and the variance component parameters by β= (β11, β12, β21, β22)0 andσ = (ϕ11, ϕ12, ϕ21, ϕ22, φ1, φ2), respectively.
By using the Model 3 with the above cited auxiliary variables and parameters, we simulate
u1,dk ∼N(0, ϕ1k),u2,dk∼N(0, ϕ2kΩ(φk)),pdkt,mdkt andydt ∼M(ndt, pd1t, pd2t),d= 1, . . . , D,
k= 1,2,t= 1, . . . , T.
The steps of the simulation are
1. Repeat I = 500 times (i= 1, . . . ,500)
1.1. Generate u(1i,dk) ,u2(i,dk) ,p(dkti),m(dkti),y(dti) and calculate ˆσ(i), ˆβ(i), ˆp(dkti), ˆm(dkti) and
mse(dkti) =G1(idkt) ( ˆσ(i)) +G2(idkt) ( ˆσ(i)) + 2Gdkt(i)( ˆσ(i)), d= 1, . . . , D, k= 1,2, t= 1. . . , T. 1.2. Repeat B= 500 times (b= 1, . . . , B) 1.2.1. Ford= 1, . . . , D,k= 1,2,t= 1. . . , T, generate u∗1(,dkib)∼N(0,ϕˆ(1ik)), u2∗(,dkib)∼N(0,ϕˆ2(ik)Ω( ˆφ(ki))),ydt∗(ib)= (yd∗(1ibt), yd∗2(ibt))0 ∼M(ndt, p ∗(ib) d1t , p ∗(ib) d2t ), and m∗dkt(ib)=Ndtp ∗(ib) dkt , where p∗dkt(ib)= exp{η ∗(ib) dkt } 1 + exp{η∗d(1ibt)}+ exp{ηd∗(2ibt)}, η ∗(ib) dkt = ˆβ (i) k1 + ˆβ (i) k2xdkt+u ∗(ib) 1,dk +u ∗(ib) 2,dkt. 1.2.2. Calculate ˆσ∗(ib), ˆβ∗(ib), ˆmdkt∗(ib),d= 1, . . . , D,k= 1,2,t= 1. . . , T. 1.3. Calculate mse∗dkt(i) = 1 B B X b=1 ( ˆm∗dkt(ib)−mdkt∗(ib))2, d= 1, . . . , D, k= 1,2, t= 1. . . , T.
2. Output: msedkt,mse∗dkt,d= 1, . . . , D,k= 1,2,t= 1. . . , T,i= 1, . . . ,500.
Figure 5.1 presents the box-plots of the values of the two simulated estimatorsmse(dkti), mse∗dkt(i),
k= 1,2,i= 1, . . . ,500, ford= 51 andt=T, withT = 5,10 and D= 102. The first column is
for T = 5 and the second column is for T = 10. The true MSE is plotted in a horizontal line. The true MSE and RRMSE have been calculated by the Monte Carlo formulas
M SEdkt= 1 I I X i=1 ( ˆm(dkti) −mdkt(i))2, RRM SEdkt = √ M SEdkt mdkt ,
under I = 1000 iterations of the simulation experiment, excluding the bootstrap step. We observe in Figure 5.1 that the analytic estimator msehas larger variability than the bootstrap estimator mse∗ and that the estimator behaving best ismse∗.
By assuming Model 3 as the true generating model, Figure 5.2 presents the box-plots of the
true RRM SEdkt, k = 1,2, d = 1, . . . ,102, for t = T, with T = 4,6,8,10 and D = 102. For
the SLFS data, Figure 5.2 suggests employing Model 3 with at least T = 8 times periods. By assuming Model 2 as the true generating model, Figure 5.3 presents the box-plots of the true
RRM SEdkt,k= 1,2,d= 1, . . . ,102, for t=T, with with T = 4,6,8,10 and D= 102. For the
mse mse* 20 25 30 35 (d,t)=(51,5) Emplo yment mse mse* 16 17 18 19 20 21 (d,t)=(51,10) mse mse* 2 4 6 8 10 12 14 T=5 Unemplo yment mse mse* 1 2 3 4 5 6 7 T=10
Figure 5.1: Boxplots of MSE estimates (thousands) for d= 51 and t =T, withT = 5,10 and
D= 102. T=4 T=6 T=8 T=10 4 6 8 10 12 14 16
RRMSE − employment − mod 3
T=4 T=6 T=8 T=10 10 15 20 25 30 35 40 45
RRMSE − unemloyment − mod 3
Figure 5.2: Boxplots of the true RRMSE values under Model 3.
6
Discussion
One of the most interesting properties of the presented model-based approach is the smooth change across time of domain estimates. We have presented an application where the temporal models are fitted to the 10 most recent quarters. Another important issue is how the proposed models may be applied for repeated surveys and more concretely in the SLFS. The use of 10
T=2 T=4 T=6 T=8 T=10
5
10
15
RRMSE − employment − model 2
T=2 T=4 T=6 T=8 T=10
10
20
30
40
RRMSE − unemployment − model 2
Figure 5.3: Boxplots of the true RRMSE values under Model 2.
quarters is the consequence of using all our available data and therefore is arbitrary for this purpose. We have carried out some extra simulations to investigate how the fitting algorithms and the bootstrap method for MSE estimation works. These simulations suggest using at least the 5 and the 7 most recent quarters when using Model 2 and Model 3, respectively.
By using all the data up to the last quarter, the introduced temporal models give estimates for any of the considered quarters. Nevertheless, we suggest using these models for obtaining only estimates in the last quarter. Because of the practical difficulties that Statistical Offices have with revising published data and with running time consuming computational procedures, we propose using a dynamic fixed length time “window” by adding each time the current quarter and discarding the earliest one. If this methodology were ever put in production, we recommend windows of 5 and 7 past quarters for Models 2 and 3, respectively.
We would like to emphasize that the introduced approach to estimating labour force indi-cators, and also the ones by Molina et al. (2007) and L´opez-Vizca´ıno et al. (2013), are not adapted to the particularities of a complex sampling design. They are derived for simple ran-dom sampling and do not take into account for potential LFS sampling-design effects. The sampling weights are only used through ˆNdtdir when calculating the model-based estimates of domain totals of employed and unemployed people. They are also used in the calibration to the province totals. Many area-level small area estimation methods introduce the complex sampling design information through the direct estimator of the domain total or mean ( ˆYdktdir or ˆY¯dktdir) and their moments. As a multinomially distributed vector is the sum of i.i.d. multi-Bernoulli vectors, the survey domain totals of employed and unemployed people can be modeled by means of multinomial distributions. The modelization of a weighted sum of multi-Bernoulli vectors, like ( ˆYddir1t, . . . ,Yˆdqdir−1t), as multinomial seems to be unrealistic. A possible way of taking into account for potential LFS sampling-design effects is introducing the weights in the fitting algo-rithm. This approach could eventually enlarge the variance of the model-based estimators of the finite-population proportions. Therefore, some investigation will be needed to balance the positive and negative consequences of applying this suggestion.
An issue that should be taken into account is that true domain size Ndt is an unknown quantity and that it is assumed to be equal to ˆNdtdir. In practice, this is not true. Therefore, when estimating the MSE of the estimators of the domain totals of employed and unemployed
people we are ignoring the uncertainty in ˆNdtdir and its correlation with ˆpdkt. To proceed in a rigorous way, the estimation of the extra variability and of the ignored correlation is needed. This might require implementing some bootstrap or Jackknife method at the unit-level, something that might have a high computational cost. Nevertheless, the direct domain size estimates, ˆNdtdir, are constructed from the official calibrated sampling weights, that are obtained after correcting the non response and after calibrating to some “known” populations sizes. In this sense, we may admit the simplification of assuming that the true domain sizes are equal to the direct domain size estimates.
As calibrated weights enter in the estimation process through the direct estimators ˆNdtdir, it is worthwhile to investigate how large is the correlation between the ˆNdtdir and the ˆpdkt values. The estimated correlations for the target period IV/2011 are 0.27 and 0.29 for the categories of employed (k = 1) and unemployed (k = 2) people, respectively. From the socioeconomic perspective, this positive correlation shows something that it is well known. The Galician rural counties tend to have lower population size and higher proportion of inactive people.
It is interesting to analyze if the estimation procedure uses direct estimators ˆNdtdir based on weights that are calibrated for the model covariates. In the presented application to real data, the multinomial models use the auxiliary variable SEXAGE at the county level. On the one hand, SEXAGE contains the combinations of sex and age groups with 3 age groups. On the other hand, the weights are calibrated to 11 age groups at the whole population (Galicia), which is in strict sense a different auxiliary variable. Therefore, we have not applied the proposed methodology by using twice the same auxiliary variables, first in the calibration of weights and second in the multinomial models.
This paper produces estimates for sex by county domains, but it does not deal with the fact that the multinomial outcomes for males and females from the same county might be correlated. The proposed Model 2 and Model 3 have not separate fixed effects for males and females and so essentially handle this problem via the correlation between males and female values of the model covariates. Further generalizations could be done by adding a new sex index s= 1,2 to the set of data indexes (d, k, t) and by considering possible correlation structures between sexes. The estimator defined in (4.1) is a plug-in estimator of the expected value of the small area proportion given the small area distribution of the covariates and the random effects in the model. It can be calculated with a low computational cost. The optimal estimator is the so-called Empirical Best Predictor (EBP) of the population proportion, which is a plug-in estimator of the conditional expectation of the small area proportion given the small area distribution of the covariates and the sample data. The EBP can be obtained by approximating two 2(T+ 1)-variate integrals by Monte Carlo or numerical integration and its corresponding mean squared error can be calculated by parametric bootstrap. The high computational cost is thus the main drawback for using the EBP under Model 3. This is the main reason why we prefer employing the plug-in estimator in this paper.
7
Conclusions
In this work we study the problem of estimating totals of employed and unemployed people and unemployment rates. We use four multinomial mixed models with area and time effects. The obtained model-based estimates for all models are compared with the direct ones. They have lower mean squared errors, especially for counties with small sample size. Another advantage of the proposed model-based estimators is their property of being consistent in the sense that estimates of domain totals of employed, unemployed and inactive people sum up to the size
of the domain. However, the benchmarking property at the province level is not an inherent property of this approach because the estimates of county totals do not sum up to the province total. Additionally, this paper proposes the use of a model with domain effects and correlated time effects. The inclusion of time effects allows to obtain estimates of employed, unemployed totals and of unemployment rates in a more accurate and stable form than if separate models were fitted for each time period, as shown in Figure 4.6. This is why we prefer Model 2 and 3 to Model 1 and 0. These properties make the proposed methodology very suitable for statistical offices. Further, as estimates follow the pattern of direct estimators for large counties and behave stably for small counties, the smoothing effect of using past time periods seems reasonable.
For the labor market results in Galicia we can conclude that unemployment rates have increased in the considered period, although this increase was greater for men. This can be explained by the sharp fall of employment in the construction sector, which employs mainly men. Due to the Spanish economic situation, with a fall in gross domestic product of 1.6% in 2012, this population was not able to find work in another field of activity.
8
Appendix: Model-based small area estimation
Let us write model (3.1)-(3.2) in the more general from with q−1 categories. This is to say, we assume that the response vectors ydt= (yd1t, . . . , ydq−1t)0, conditioned tou1,d and u2,dt, are independent with multinomial distributions
ydt|u
1,d,u2,dt ∼M(νdt, pd1t, . . . , pdq−1t), d= 1, . . . , D, t= 1, . . . , T; (8.1)
where νdt’s are known integer numbers and the natural parametersηdkt = log(pdkt/pdqt) follow the model ηdkt =xdktβk+u1,dk+u2,dkt, d= 1, . . . , D, k= 1, . . . , q−1, t= 1, . . . , T, (8.2) where xdkt = (xdkt1, . . . , xdktrk) 0, β k = (βk1, . . . , βkrk) 0 and r = Pq−1
k=1rk. For the random vectors u1 and u2 we assume the hypotheses 1-3 appearing in Section 3. Therefore, it holds that Vu = var(u) = diag(Vu1,Vu2), where Vu2 = var(u2) = diag
1≤d≤D ( diag
1≤k≤q−1
(Vu2,dk)).
In matrix notation, Model 3 is
η=Xβ+Z1u1+Z2u2 =Xβ+Zu, where Z= (Z01,Z02)0,η= col 1≤d≤D(ηd),X =1≤cold≤D(Xd),Z1 = diag1≤d≤D (Z1d), Z2 = diag 1≤d≤D (Z2d), ηd = col
1≤k≤q−1( col1≤t≤T(ηdkt)), Xd=1≤diagk≤q−1( col1≤t≤T(xdkt)), β=1≤kcol≤q−1(βk), Z1d = diag 1≤k≤q−1 (1T), Z2d= diag 1≤k≤q−1 ( diag 1≤t≤T (1)) =IT(q−1), 1T = col 1≤t≤T(1), where col 1≤d≤D(ad) and diag1≤d≤D
(ad) denote column or diagonal matrices with componentsa1, . . . ,aD. For deriving an approximation to the mean squared error of ˆmdkt=Ndtpˆdkt, let us write
mdkt=hdkt(ηdt) =Ndtpdkt=Ndt
exp{ηdkt} 1 +Pq−1
`=1exp{ηd`t}
.
The partial derivatives of hdkt are
∂hdkt ∂ηdkt =νdtpdkt(1−pdkt), ∂hdkt1 ∂ηdkt2 =−νdtpdkt1pdkt2, k1 6=k2.