A Sensor Network to Profile the Electrical Power
Consumption of Computer Networks
Ricardo Lent
Department of Electrical and Electronic Engineering Imperial College, London SW7 2BT, UK
Abstract—We introduce a sensor network to measure the individual power consumption of a large number of network elements in near-real time. A main application of this system is to obtain profiles of the power usage of network elements, i.e., a parameterization of power consumption with respect to workload. We discuss the design and implementation of both hardware and software aspects of the system as well as the application of the measurement results to achieve power-efficient routing.
I. INTRODUCTION
There is a growing interest in finding power efficient solu-tions for computer networks, motivated among other factors by environmental concerns, the introduction of “green” gov-ernment policies and the increasing energy bills. Computer networks proliferate at a rapid rate and the Internet and services continue their phenomenal expansion. The challenge is therefore, to introduce mechanisms to reduce the networks’ power usage levels without affecting the quality of service to end users, while allowing for a more sustainable and responsible expansion.
Much attention to power efficiency in computer networks has been devoted to mobile networks and to improved hard-ware design. In contrast, we seek to investigate how to achieve power-friendly distributions of network workload, which we expect would eventually reduce a network’s power (and en-ergy) consumption. Workload may represent traffic (i.e., the problem would be a routing problem) or computing load (i.e., scheduling accesses to services and how these services are provided). In this paper we focus only on the former case.
To effectively optimize traffic routes, accurate models of power consumption are needed (i.e., power consumption pro-files, to express power consumption with respect to traffic). It is important to notice that the power consumption of any particular network device may vary under the same workload if operating conditions change (e.g., a higher power consumption is expected in warmer operating conditions because of the extra energy used by cooling fans). Also, power consumption may depend on the traffic patterns. Therefore, an online profile construction should be adequate. The particular motivations for this work are the lack of power consumption models representative enough for power usage optimization through network routing, the limited information available from router vendors, often restricted to the maximum consumption of power supplies, and the lack of existing (commercial) systems
capable of monitoring a potentially large set of devices and within the desired power observation range.
The contributions of this paper are in two main aspects. The first one tackles the instrumentation a power consumption acquisition tool: (i) to enable the near real-time observation of power usage in network elements (either all or selected) and the network as a whole, and (ii) to allow individual elements to learn at least their own power consumption. The former design goal would enable a wide range of network monitors to track power usage in addition to traditional network metrics. It would also allow centralized optimizers to acquire the power information needed for their algorithms. The latter goal is mainly aimed to distributed optimization algorithms (e.g., to provide the information needed to achieve a power-efficient distributed routing). This system can be easily applied to power profiling (realized either offline or online). We discuss our sensor-network based approach to implement this system as well as our experiences in designing both its hardware and software aspects.
In the second part of the paper, we apply power profiles to achieve power-efficient routing. Power usage optimization is achieved by traffic re-routing, in a way that (i) some network elements are switched off when idle and, (ii) flows use the least power consuming paths.
II. RELATEDWORKS
The literature lists some energy consumption models of network components that although not suitable for routing optimization are worth mentioning. Tao et al. [1] proposed a methodology to evaluate the power consumption of switch fabrics in routers. Wang et al. developed an architectural-level power model applicable to different router microarchitectures [2]. On the opposite order of magnitude, Baliga et al. [3] estimated the energy consumption of access networks and the Internet as a whole.
Another set of related works addressed a number of ways to reduce energy consumption. One of the earliest works that suggested the need for energy efficiency in computer networks was done by Gupta and Singh [4], who although did not address an specific approach, discussed the impact of putting selected network elements to sleep, including routers, switches and interfaces. A related work proposed the use of on/off links in interconnection networks [5]. Another discussion was put
forward by Christensen et al. on power management for com-munication networks [6]. The case of putting idle ports to sleep was further addressed by Ananthanarayanan and Katz [7], who proposed three opportunistic power reduction schemes specific to network switches. It has also been suggested the use of rate adaptation in addition to sleeping [8].
Chiaraviglio et al. [9] proposed an algorithm for turning off nodes and links to minimize energy consumption by using the total network power consumption the objective function of a shortest path-based algorithm. Comparable approaches were proposed by Cardona et al., Gelenbe and Silvestre [10] and Cardona et al. [11]. These works assume an arbitrary model for nodes’ power consumption. An approach for guaranteed QoS while minimizing energy use was proposed by Qu and Potkonjak [12]
A discussion on the power consumption of p2p applications compared to their centralized versions was done by Nedevschi et al. [13]. An specific approach to reduce the energy consump-tion of BitTorrent was addressed by Blackburn and Christensen [14] . Optimizing server assignment by addressed in [15].
Related works involving power consumption measurements of network devices are rather limited in the literature. Chabarek et al. [16] measured power consumption in com-mercial routers. However, they focused on a very narrow operating space as their paper had a different aim than ours. Another related work was done by Kansal and Zhao [17], who discussed energy profiling for application design. A close work to ours, but with a different aim and approach, was developed by Bolla et al., who also measured power consumption in PC-based routers.
III. EPUMS SENSORNETWORK
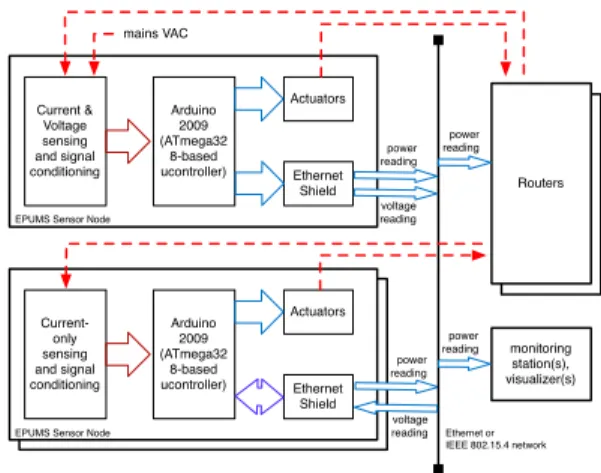
The Electrical Power Usage Monitoring System (EPUMS) sensor network consists of current-only sensing nodes, voltage-current sensing nodes, networks elements (e.g., routers and servers to monitor) and sinks (e.g., a monitoring station). Each current sensing node can measure the input AC current of up to six network devices, but requires an externally-provided voltage reading to do accurate power calculations. Voltage values are provided by voltage-current sensing nodes, which periodically determine and broadcast to the sensor network the mains RMS voltage. In most cases, only one voltage reference is needed (e.g., when all network elements are connected to the same electric grid). All sensor nodes periodically inform their power calculations to sinks. Figure 1 illustrates the main elements of the system. EPUMS allow to control a set of actuators, through Arduino’s DAC ports, to gain direct control over the power state of any network element (i.e., to switch an element on or off).
A. Hardware Aspects
EPUMS consists of a sensor network of Arduino-based nodes. Each node consists of anArduino Duemilanove micro-controller board (based on ATmega168), which consists of a 16 MHz clock and 6 ADC inputs. The board is connected to an Ethernet shield (WIZnet 5100) which provides TCP
Arduino 2009 (ATmega32 8-based ucontroller) Ethernet Shield Current & Voltage sensing and signal conditioning Routers voltage reading power reading Actuators monitoring station(s), visualizer(s) Arduino 2009 (ATmega32 8-based ucontroller) Ethernet Shield Current-only sensing and signal conditioning power reading Actuators Ethernet or IEEE 802.15.4 network voltage reading power reading power reading
EPUMS Sensor Node EPUMS Sensor Node
mains VAC
Fig. 1. Main components of the EPUM sensor network.
and UDP over IP support. Alternatively, the boards could be connected wirelessly with a IEEE 802.15.4 module. Because network elements normally draw electricity (AC) from the grid, an effective way to calculate power consumption is from measurements of both the input AC current and voltage. The basic idea is therefore to connect either a voltage or a current sensor (which will be connected to the element of interest) to a microcontroller ADC port, read the port, use the values to compute power usage, and report the results over the network. EPUMS’ hardware design was inspired by the Open Energy Monitor’s domestic meter design [18] which is also based on an Arduino microcontroller. However, the resulting designs differ, in particular the current signal conditioning part, given the different aims and requirements (such as the need for a much smaller power sensing range suitable for routers, monitor a large number of elements, and data communication among nodes). To sense AC current, we employed a non-invasive approach consisting in passing a devices’s power line through the core ring of a current transformer. The current generated at the secondary winding of the transformer is proportional to that of the power line but about 1000–2000 smaller. The output of the current transformer was first converted to voltage and increased with an operational amplifier and then filtered to remove higher harmonics before sending the signal to a microcontroller’s ADC input port. The voltage sensing part is similar in both designs and implemented with an AC/AC transformer with a positive offset prior to the microcontroller’s ADC input port. Further details are available online [19].
B. Software Aspects
The microcontroller was programmed to sample each ADC input port (for either current or voltage sensing) at about 2000 times per second. About 25–30 AC cycles are acquired and further digital filtered to remove noise and then used to calculate a root-mean square value of the input signal. Each RMS current or voltage result is multiplied by a correction factor that maps the sampling value to a physical value. Correction factors are determined by an initial calibration process by which the RMS results corresponding to each ADC
port are scaled to match the readings of an external and trusted current or voltage meter. Likewise, a similar process is applied to determine the power factor by comparing the RMS voltage-current product with an external power meter.
Both voltage and power values are represented by floating point numbers (4 bytes) so in both cases, they can be informed to the sinks within a single packet. Voltage readings do not change much in the short term so a small broadcast rate is applied (0.1 pkt/s). On the other hand, power readings are informed as soon as they are available, which corresponds to approximately 2 pkt/s in the system implementation. The amount of samples to collect can be adjusted to produce a finer or coarser monitoring resolution, which would also affect the system’s traffic load. There are two main types of data sinks for the power information provided by the EPUMS sensor network: power usage monitors and network elements.
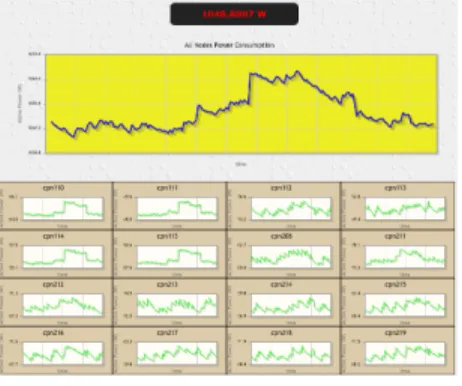
A power monitor provides network operators with a near-real time information of electric power usage on the network. The power monitor itself consists of the following compo-nents: data collector, visualizer, and data reporter. The former is implemented as a UNIX daemon (or Windows service). Runs in the background listening to broadcast transmissions in the UDP port assigned for power reports. It has a local database that is actualized with every new packet arrival. The data collector also implements a TCP port to listen for HTTP requests and reports the latest power readings from the network through this port with a JSON array. The visualizer was implemented in the form of a web service, which makes periodic requests to the collector for the latest power data (the JSON array) to plot the information in near-real time. A screen capture of the visualizer can be observed in Figure 2 depicting about 1 minute of operation of a network testbed of 16 PC-based routers. The top half shows the power consumption of all 16 routers. The bottom half shows the power consumption of each individual router. Finally, the data reporter is a command line program that provides a textual report of the latest power reading of the selected node (which is passed as an argument to the program). The data reporter either listens for broadcasts in the same way the data collector does (when no data collector is running) or opens an interprocess communication with a running data collector to retrieve the desired data.
Fig. 2. Power monitor visualizer web view.
The second type of potential data sinks for EPUMS’ sensor
network data are network elements themselves, which may use the information for power profiling (parameterizing their power consumption with respect to the traffic intensity) and power-efficient routing. In relation to power profiling, we con-sider both an offline and online cases. An example of an offline profiling will be given in the next section. Dynamic profiling can be achieved by continuously correlating observations of the power consumption and the traffic level handled by the router so that power variations (due to changes in the operating conditions for example) can be taken into account. In some cases, the operating system of the network elements involved would need to be extended to allow them read and make proper use of the power data. Currently, we are specifically experimenting with PC-based routers as network elements because they can operate with open source software and so they are easy to customize to our needs. The software consists of a user-level daemon similar to the data collector described before. The difference is that the power data acquired is reported to the system’s kernel (written to a /proc filesystem entry) so that the information becomes available to kernel-level routing protocol implementations.
IV. POWERPROFILING
To illustrate a direct use of EPUMS, we have used the system to conduct an offline profiling of a set of 5 PC-based routers and later used the acquired data in a simulation-based evaluation of a use case. For this, we implemented a data collection system to operate in conjunction with EPUMS and that enables an automated recording of observations of the packet processing rate, bit rate, CPU load, and chassis tem-perature at any router, in addition to its power consumption. We have done the data acquisition while driving the routers with a constant-bit rate packet flow.
We experimented with various packet sizes (16, 128, and 1024 bytes) and the use of concurrent traffic flows on multiple interfaces to acquire the power profiles. The measurements were done with a room temperature of 22C (air conditioned). From the results, we concluded that it is reasonable to express a router’s profile as a function of its packet processing rate (regardless of the packet sizes or the number of flows even when sending and receiving with different network ports).
While we have only used PC-based routers in this study, this methodology is perfectly applicable to regular network routers and other equipment as the only requirement is the possibility of reading the power consumption (provided by EPUMS) and at least the traffic level handled by the device (which can be obtained from the device itself in most cases, e.g. through SNMP, otherwise with an external traffic monitor).
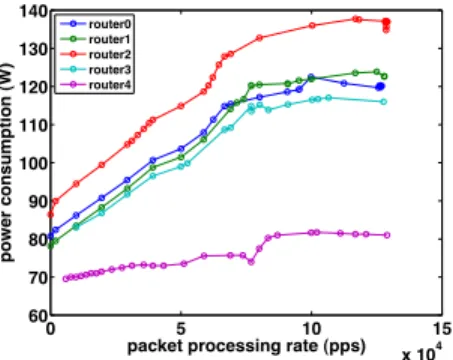
The profiles acquired by the system are depicted in Figures 3. Routers 0–3 are based on an Intel CPU Pentium 4 (2.4 GHz or 2.8 GHz). Router 4 is based on an Intel CPU E6300 1.86 GHz (dual core). All routers used Linux 2.6 and were equipped with one or two 4-port server board (D-Link DFE-580TX).
The results confirm the general intuition than routers oper-ating at a higher clock rate or equipped with a higher number of interfaces would produce a higher power consumption. It is
0 5 10 15 x 104 60 70 80 90 100 110 120 130 140
packet processing rate (pps)
power consumption (W) router0 router1 router2 router3 router4
Fig. 3. Power consumption profiles of 5 particular PC-based routers.
also interesting to observe that the power consumption “steps” up in the dual-core case after exceeding a certain processing level due to the second core starting to operate to handle excess of traffic (additional cores would had produced also additional steps). We did not observe compelling differences in power consumption when comparing packet transmissions with receptions, which suggest that the main consumption driver in a PC router is header processing.
V. A POWEREFFICIENTROUTING
The measured power consumption profiles can be used to determine node and link costs for routing purposes. Given that the profiles only list a finite set of operating points, any intermediate value between two measured samples can be estimated by interpolation.
Consider G(V, E) a finite directed graph where edges
(u, v) ∈ E have a positive, real-valued capacity c(u, v). G
carries a set F of traffic flows. Each flow fi ∈ F is
char-acterized by the tuple (s, d, b, Q), where s, d ∈ V represent the source and sink vertices, bthe traffic bandwidth, andQa set of QoS constraints. The set of working flows (i.e., flows that has been already routed into the network) is represented by Fw. Consider also a positive, real-valued traffic aggregate
for each edge: 0 ≤ z(u, v) ≤c(u, v) (with Z the set of all
z) and function pu : z(u) → <, z(u)≥0 mapping a node’s
packet processing ratez(u)(expressed in packets per second) to power consumption, wherez(x) =P
(u or v)=xz(u, v).
Routing flows while achieving network power efficiency is a combinatorial problem with a high computational complexity. Routing individual flows based on power may in fact lead to a higher network power consumption in some cases. In this paper, rather than seeking to achieve the global minimum, we focus on reducing the network power consumption of a standard hop-based routing. The idea is to route new flows based on a minimum hop count criterion and then to produce subsequent calls to Algorithm 1 to re-route flows with a power optimization criterion. On the other hand and to ensure that any QoS requirements are met, new traffic loads are checked to be within acceptable limits (done byqos invalidated(), which is not elaborated further given the limited space). In addition to routes, the algorithm produces the setV−A, which determine which routers should be switched off.
Algorithm 1 Power efficient routing, returnsR andV −A. Require: G,F
Initialize usage levelz(u, v)∈Z to zero for all u, v
Initialize set of active nodesA={}, routesR={}
for f inF do
Z←remove load(Z, f)
r←route flow(f, Z, A)(see Algorithm 2) if r is null orqos invalidated(z, r, b) then
reject flowf
else
Z←add load(Z, r, b)
insertf into Fw,v into A,rinto R
end if end for
Algorithm 2 Route flow. Require: G,f,Z,A
if f is not inFw then
Initialize link weightsw(u, v)∈W to one for allu, v
else
Initialize link weightsw(u, v)∈W to zero for allu, v
for (u, v)inE do if(z(u, v) +b)≥c(u, v)then w(u, v)← ∞ else wl←(pu(z(u) +b)−pu(z(u)))// power-based cost wr←0 ifv /∈A then
wr←pv(0)// i.e., switch router on
end if
w(u, v)←wl+wr
end if end for end if
returnshortest path(s, d, G, W)// Dijkstra’s alg.
A. Test Scenario
The scenario consists of a MPLS network similar to the AT&T Tier 1 topology ([20]) with 100 Mbps links to match the measured range. The study was done on a packet-level sim-ulator. The topology consists of 27 MPLS routers. Each router is associated with one of the five power consumption profiles previously acquired (Section IV), but scaled to match a factor of the published minimum and maximum power consumption of various Juniper routers (MX240, MX280, T1600, T640, and TX Matrix plus). We considered minimum and maximum values for the routers to be 8 times smaller than the published values, given that the values are provided for design purposes by the manufacturer. Therefore, the actual power consumption should be smaller. Power profile assignment to routers was done in a round-robin fashion.
Twenty additional nodes were arbitrarily connected to some of the MPLS routers to serve as sources and sinks for 20 bidirectional traffic flows of γ Kbps each. These flows
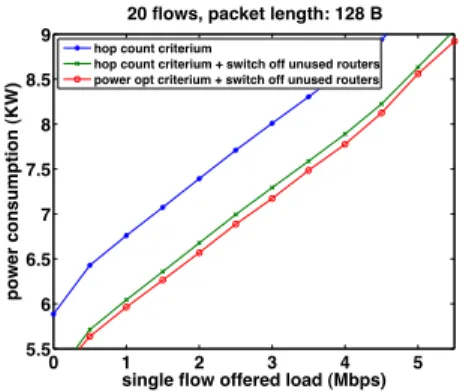
represent aggregated and sustained traffic entering the MPLS network. Out interest is in observing the network power consumption vs. γ. We considered a maximum processing bandwidth for routers, matching the observed value during the measurements. The aggregated power consumption of the 27 MPLS routers are depicted in Figure 4. We compare the network consumption of routing with or without optimization. In this context, no optimization means routing based on the minimum hop count. The optimization criterion used was only power consumption. Figure 4 considers the operative range for the network. For that range, the packet loss ratio was nearly zero for all cases and the average end-to-end packet delay remained almost constant within 11 to 14 ms. From the results, it is clear that major energy savings can be achieved by switching off unused routers, which produced a reduction of about 12% in power consumption. An extra reduction was achieved by re-routing packets (an extra 2%). Note that to avoid the high complexity of computing routes to achieve the global power consumption minimum, our flow re-routing algorithm only attempts to lower the power consumption compared to the standard hop-based routing.
0 1 2 3 4 5 5.5 6 6.5 7 7.5 8 8.5 9
single flow offered load (Mbps)
power consumption (KW)
20 flows, packet length: 128 B
hop count criterium
hop count criterium + switch off unused routers power opt criterium + switch off unused routers
Fig. 4. Power consumption vs. offered load (per flow).
VI. FINALREMARKS
We have presented the design and implementation of a sensor network for the acquisition of the electrical power consumption data of network devices. The system was ap-plied to profile PC-based routers, i.e., to parameterize power consumption in relation to the processing packet rate of nodes. The results were used to examine potential power savings on a simulated network.
While only PC-based routers were available to conduct this study, we do not expect any limitation to apply the system to regular routers, switches, or to a wider variety of devices. The system scales well given that each sensor node generates a small amount of traffic (about 1 Kbps for up to 6 power readings). Monitoring 1000 elements would consume about 0.1% (at 100 Mbps) of the network bandwidth. Power profiles could change over time in response to changes in the operating environment, functions carried on by the device (for example, packet marking, metering, etc.), or changes in traffic patterns. The proposed system can be easily applied to construct power profiles online to deal with these variations.
Finally, we studied an optimization algorithm that can lower the power consumption of a network when compared to regular hop-based routing. Extensions of this work will include further research into achieving larger power savings with QoS restrictions as as well as their realistic performance evaluation.
ACKNOWLEDGMENT
This work was partially supported by FP7 FIT4Green. REFERENCES
[1] Terry Tao Ye, Luca Benini, and Giovanni De Micheli, “Analysis of power consumption on switch fabrics in network routers”, inIn Proc. Design Automation Conference, 2002, pp. 524–529.
[2] Hang-Sheng Wang, Li-Shiuan Peh, and Sharad Malik, “A power model for routers: Modeling alpha 21364 and infiniband routers”,IEEE Micro, vol. 23, no. 1, pp. 26–35, 2003.
[3] J. Baliga, K. Hinton, and R. S. Tucker, “Energy consumption of the internet”, inProceedings of the First International Workshop on Green Communications, June 2009.
[4] Maruti Gupta and Suresh Singh, “Greening of the internet”, in SIGCOMM ’03: Proceedings of the 2003 conference on Applications, technologies, architectures, and protocols for computer communications, New York, NY, USA, 2003, pp. 19–26, ACM.
[5] Vassos Soteriou and Li-Shiuan Peh, “Dynamic power management for power optimization of interconnection networks using on/off links”, High-Performance Interconnects, Symposium on, vol. 0, pp. 15, 2003. [6] Kenneth J. Christensen, Chamara Gunaratne, Bruce Nordman, and
Alan D. George, “The next frontier for communications networks: power management”, Computer Communications, vol. 27, no. 18, pp. 1758 – 1770, 2004, Performance and Control of Next Generation Communications Networks.
[7] Ganesh Ananthanarayanan and Randy H. Katz, “Greening the switch”, Tech. Rep. UCB/EECS-2008-114, EECS Department, University of California, Berkeley, Sep 2008.
[8] Sergiu Nedevschi, Lucian Popa, Gianluca Iannaccone, Sylvia Rat-nasamy, and David Wetherall, “Reducing network energy consumption via sleeping and rate-adaptation”, inNSDI’08: Proceedings of the 5th USENIX Symposium on Networked Systems Design and Implementation, Berkeley, CA, USA, 2008, pp. 323–336, USENIX Association. [9] L. Chiaraviglio, M. Mellia, and F. Neri, “Energy-aware networks:
Reducing power consumption by switching of network elements”. [10] E. Gelenbe and S. Silvestri, “Reducing power consumption in wired
networks”, inProc. of the 24th International Symposium on Computer and Information Sciences (ISCIS’09), September 2009.
[11] J.C.C. Restrepo, C.G. Gruber, and C.M. Machuca, “Energy profile aware routing”, in Proceedings of IEEE International Conference on Communications Workshops, June 2009, pp. 1–5.
[12] Gang Qu and Miodrag Potkonjak, “Energy minimization with guar-anteed quality of service”, inISLPED ’00: Proceedings of the 2000 international symposium on Low power electronics and design, New York, NY, USA, 2000, pp. 43–49, ACM.
[13] Sergiu Nedevschi, Sylvia Ratnasamy, and Jitendra Padhye, “Hot data centers vs. cool peers.”, inHotPower, Feng Zhao, Ed. 2008, USENIX Association.
[14] J. Blackburn and K. Christensen, “A simulation study of a new green bittorrent”, inCOIN-ACOFT, 2007.
[15] Luca Chiaraviglio and Ibrahim Matta, “GreenCoop: Cooperative Green Routing with Energy-efficient Servers”, Tech. Rep. BUCS-TR-2009-034, CS Department, Boston University, November 24 2009.
[16] Joseph Chabarek, Joel Sommers, Paul Barford, Cristian Estan, David Tsiang, and Steve Wright, “Power awareness in network design and routing”, inIn Proc. IEEE INFOCOM, 2008.
[17] Aman Kansal and Feng Zhao, “Fine-grained energy profiling for power-aware application design”, SIGMETRICS Perform. Eval. Rev., vol. 36, no. 2, pp. 26–31, 2008.
[18] http://openenergymonitor.org, “The open energy monitor website”. [19] Ricardo Lent, “Electrical power usage monitoring system”,
http://www.iis.ic.ac.uk/rlent/epums.
[20] http://www.ssfnet.org/Exchange/gallery/index.html#routing, “At&t tier-1 internet provider network”.