Mining Heterogeneous Urban Data at Multiple Granularity Layers / Attanasio, Antonio. - (2018 Jun 19). Original
Mining Heterogeneous Urban Data at Multiple Granularity Layers
Publisher:
Published
DOI:10.6092/polito/porto/2709888 Terms of use:
Altro tipo di accesso
Publisher copyright
(Article begins on next page)
This article is made available under terms and conditions as specified in the corresponding bibliographic description in the repository
Availability:
This version is available at: 11583/2709888 since: 2018-06-21T14:58:46Z Politecnico di Torino
Doctoral Dissertation
Doctoral Program in Computer and Control Engineering (30.th cycle)
Mining Heterogeneous Urban Data
at Multiple Granularity Layers
Antonio Attanasio
* * * * * *Supervisors
Prof. Silvia Anna Chiusano, Supervisor Prof. Tania Cerquitelli, Co-supervisor
Doctoral Examination Committee:
Prof. Robert Wrembel, Referee, Poznan University of Technology Prof. Rosa Meo, Referee, Università degli Studi di Torino
Prof. Enrico Masala, Politecnico di Torino Prof. Elisa Quintarelli, Politecnico di Milano Prof. Antonio Servetti, Politecnico di Torino
be reproduced for non-commercial purposes, provided that credit is given to the original author.
I hereby declare that, the contents and organisation of this dissertation constitute my own original work and does not compromise in any way the rights of third parties, including those relating to the security of personal data.
. . . . Antonio Attanasio
Summary
The recent development of urban areas and of the new advanced services supported by digital technologies has generated big challenges for people and city administrators, like air pollution, high energy consumption, traffic congestion, management of public events. Moreover, understanding the perception of citizens about the provided services and other relevant topics can help devising targeted actions in the management. With the large diffusion of sensing technologies and user devices, the capability to generate data of public interest within the urban area has rapidly grown. For instance, different sensors networks deployed in the urban area allow collecting a variety of data useful to characterize several aspects of the urban environment.
The huge amount of data produced by different types of devices and applications brings a rich knowledge about the urban context. Mining big urban data can provide decision makers with knowledge useful to tackle the aforementioned challenges for a smart and sustainable administration of urban spaces.
However, the high volume and heterogeneity of data increase the complexity of the analysis. Moreover, different sources provide data with different spatial and temporal references. The extraction of significant information from such diverse kinds of data depends also on how they are integrated, hence alternative data representations and efficient processing technologies are required.
The PhD research activity presented in this thesis was aimed at tackling these is-sues. Indeed, the thesis deals with the analysis of big heterogeneous data in smart city scenarios, by means of new data mining techniques and algorithms, to study the nature of urban related processes. The problem is addressed focusing on both infrastructural and algorithmic layers. In the first layer, the thesis proposes the enhancement of the current leading techniques for the storage and elaboration of Big Data. The integra-tion with novel computing platforms is also considered to support parallelizaintegra-tion of tasks, tackling the issue of automatic scaling of resources. At algorithmic layer, the re-search activity aimed at innovating current data mining algorithms, by adapting them to novel Big Data architectures and to Cloud computing environments. Such algorithms have been applied to various classes of urban data, in order to discover hidden but im-portant information to support the optimization of the related processes. This research activity focused on the development of a distributed framework to automatically ag-gregate heterogeneous data at multiple temporal and spatial granularities and to apply
putational scalability. By exploring manifold data resolutions in a relatively short time, several additional patterns of data can be discovered, allowing to further enrich the de-scription of urban processes. Such framework is suitably applied to different use cases, where many types of data are used to provide insightful descriptive and predictive anal-yses.
In particular, the PhD activity addressed two main issues in the context of urban data mining: the evaluation of buildings energy efficiency from different energy-related data and the characterization of people’s perception and interest about different topics from user-generated content on social networks. For each use case within the considered applications, a specific architectural solution was designed to obtain meaningful and actionable results and to optimize the computational performance and scalability of algorithms, which were extensively validated through experimental tests.
I would like to thank my tutors, Prof. Silvia Chiusano and Prof. Tania Cerquitelli, for their fundamental advices and for all the time they spent to help me during the PhD activity.
In addition, I would like to thank all the other researchers who worked with me during these years and in particular those of the Database and Data Mining Group of the Politecnico.
I want to express my gratitude to my colleagues at ISMB for letting me take this opportunity and for their support.
Finally, I want to thank my family and especially Marta, who always encouraged me and helped me to get over the hardest periods.
Contents
List of Tables ix
List of Figures xi
1 Introduction 1
1.1 Research topics description . . . 2
1.2 Research activity overview . . . 3
2 The MuSTLE framework for big urban data mining 7 2.1 Context for heterogeneous urban data mining . . . 8
2.2 Related work . . . 10
2.3 MuSTLE architecture . . . 11
2.3.1 Data ingestion and storage . . . 11
2.3.2 Distributed space-time data aggregation . . . 12
2.3.3 Distributed data analysis . . . 14
2.4 Examples of data analysis . . . 15
2.5 Computing performance of algorithm . . . 19
2.6 Discussion . . . 19
3 Evaluation of buildings energy efficiency using real energy-related data 21 3.1 Urban context for the analysis of buildings energy data . . . 22
3.2 Related Work. . . 23
3.3 Proposed data analytics architecture for operational energy rating . . . 25
3.4 Descriptive analytics for operational energy rating. . . 28
3.4.1 The DA-BOR platform architecture . . . 28
3.4.2 Energy efficiency indicators with MuSTLE . . . 31
3.4.3 Experimental Results . . . 34
3.4.4 Computing performance of algorithm . . . 36
3.5 Predictive analytics in real time for operational energy rating . . . 37
3.5.1 The PA-BOR platform architecture . . . 37
3.5.2 Power demand prediction algorithms . . . 42
4 Energy demand modeling for buildings asset rating 59
4.1 Building characterization through Energy Performance Certificates (EPCs) 61
4.2 Related work . . . 63
4.3 HEDEBAR methodology . . . 64
4.3.1 Data preprocessing . . . 65
4.3.2 Two-layers approach for the estimation of heating energy demand 67 4.4 Experimental results. . . 68
4.4.1 Data dimensionality reduction using HEDEBAR . . . 69
4.4.2 Characterization of building segments . . . 70
4.4.3 Segment estimation. . . 72
4.4.4 Local energy demand prediction . . . 73
4.4.5 Comparison with other approaches . . . 75
4.4.6 Interpretation of the Segment estimation model . . . 77
4.4.7 Parameters setting of algorithms . . . 79
4.5 Discussion . . . 81
5 Characterization of relevant urban topics from social networks 83 5.1 Context for the analysis of relevant urban topics from Twitter . . . 84
5.2 Related work . . . 86
5.3 TCharM architecture . . . 87
5.3.1 Twitter data representation . . . 88
5.3.2 Clustering analysis of tweets . . . 89
5.3.3 Clusters characterization with Association Rules . . . 92
5.4 Experimental Results . . . 94
5.4.1 TCharM implementation . . . 94
5.4.2 Clustering analysis . . . 95
5.4.3 Clusters characterization . . . 95
5.5 Computing performance of algorithm . . . 98
5.6 Analytical comparison of spatio-temporal clustering methods . . . 98
5.7 Discussion . . . 103
6 Conclusion 107
List of Tables
2.1 PPMC coefficient𝜌𝑋,𝑌 between building energy consumption and pol-lutants concentration . . . 16
2.2 Pearson’s correlation coefficient between weather parameters and build-ing energy consumption and pollutants . . . 17
3.1 MAPE and SMAPE values of PP algorithm applied to the 12 test buildings 49
3.2 Sensitivity analysis ontraining window size . . . 52
3.3 Sensitivity analysis onslots duration . . . 52
3.4 Sensitivity analysis onweather maximum error . . . 53
4.1 Starting list of attributes selected to characterize the building heating energy demand with the proposed HEDEBAR methodology. . . 62
4.2 Features selected for the prediction of𝑃 𝐸𝐷ℎ. PPMC coefficient values with respect to target variable𝑃 𝐸𝐷ℎare expressed for each input feature. 71
4.3 Overall classification accuracy of ANN, REPT, RF and SVM algorithms 73
4.4 Overall percentage classification precision, recall and F1-measure of ANN, REPT, RF and SVM algorithms for each building segment. . . 74
4.5 Errors in predicting 𝑃 𝐸𝐷ℎ for ANN, REPT, RF, and SVM algorithms and for each building segment. . . 75
4.6 Errors in predicting 𝑃 𝐸𝐷ℎ for ANN, REPT, RF and SVM algorithms using a single step regression. . . 76
4.7 Main rules of the REPT model for classification. For each row, intervals are specified only for the variables used by the corresponding rule. The last column contains the segment assigned by the rule. . . 79
5.1 Main characteristics of selected reference tweets data sets. . . 94
5.2 Example rules (class TC) characterizing clusters in UK and USA areas in time window#1 (datasets𝒟(𝑇 𝑊 1,𝑈𝐾)and𝒟(𝑇 𝑊 1,𝑈𝑆𝐴)) . . . 96
5.3 Example rules (class TC) characterizing clusters across the three time windows in UK cities (datasets𝒟(𝑇 𝑊 1,𝑈𝐾),𝒟(𝑇 𝑊 2,𝑈𝐾),𝒟(𝑇 𝑊 3,𝑈𝐾)) . . 97
5.4 Distance measures for tweet comparison proposed in four reference previous studies and in TCharM. For a pair of tweets(𝜏𝑖,𝜏𝑗), their
spa-tial distance 𝑑𝑠(𝑠𝑖,𝑠𝑗) is shortly denoted by 𝑑𝑠, the temporal distance
𝑑𝑡(𝑡𝑖,𝑡𝑗) by 𝑑𝑡, the content distance 𝑑𝑊(𝑊𝑖,𝑊𝑗) by 𝑑𝑊, and the social
List of Figures
2.1 Data analysis steps of the proposed MuSTLE framework . . . 11
2.2 Daily average buildings energy consumption per volume unit vs aver-age CO concentration . . . 16
2.3 Daily average wind speed vs average CO concentration . . . 17
2.4 Daily average temperature vs average building energy consumption per volume unit . . . 18
2.5 Linear regression plot between daily building energy consumption per volume unit and CO concentration . . . 18
2.6 Execution time of the MapReduce aggregation algorithm on about 68k records using up to 7 computing nodes . . . 19
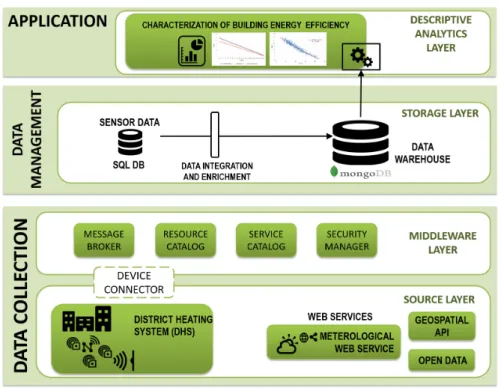
3.1 The general system architecture for operational energy rating of buildings. 26 3.2 The DA-BOR architecture for descriptive analytics of buildings energy data.. . . 29
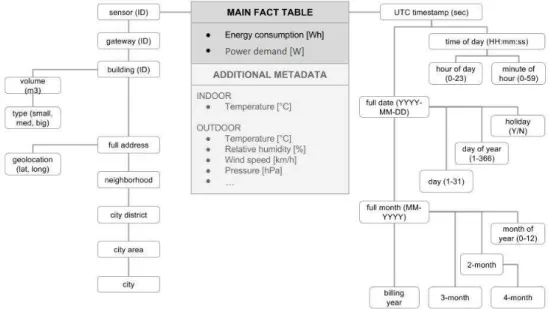
3.3 The data warehouse design.. . . 30
3.4 Energy Signature plots for residential buildings . . . 35
3.5 Speedup on a 300GB-sized data set (2,000 buildings).. . . 36
3.6 Heating Cycles in a day . . . 38
3.7 The PA-BOR architecture for predictive analytics of buildings energy data. 39 3.8 Data flow feeding the three algorithms, Status and Outlier Detection (SOD), Peak Detection (PD), Power Prediction (PP). . . 42
3.9 Daily 15 minutes average power prediction for a single-cycle building with 1 hour advance (5% maximum error on weather forecast) . . . 49
3.10 Daily 15 minutes average power prediction for a triple-cycles building with 1 hour advance (5% maximum error on weather forecast) . . . 50
3.11 Percentile distribution of APE and SAPE over the whole season for a single-cycle building . . . 50
3.12 Execution time of the Power Prediction algorithm with respect to the number of buildings per node . . . 55
4.1 The proposed HEDEBAR methodology for automatic asset rating of buildings . . . 65
4.2 Distribution of 𝑃 𝐸𝐷ℎ variable in the considered dataset. The dashed lines delimit the three segments. . . 71
4.4 REPT model of the classification phase. The first four levels of the tree are illustrated and, for each path, the histogram illustrates the number of leaves assigned to each segment. . . 78
4.5 Overall prediction errors for algorithms parameter tuning: (top-left) ANN algorithm with respect to the size of the hidden layer; (top-right) SVM algorithm with respect to the complexity constant𝐶; (bottom-left) REPT algorithm with respect to the minimum number of instances per leaf𝑀; (bottom-right) RF algorithm with respect to the number of trees. . . 80
5.1 The TCharM architecture . . . 88
5.2 Sample tweets about 2014 FIFA World Cup with TASTE distance values 92
5.3 Distributions of the average temporal, spatial, text content distances from cluster centroids, for each method. The temporal box plot for Kim-11 is not represented as its values are too high. Parameter configurations are as follows. Arcaini-16: 𝜖𝑠 = 2𝑘𝑚, 𝜖𝑡 = 1200𝑠, 𝛽 = 1; Cunha-14:
Chapter 1
Introduction
In the last few years, the capability to both generate and collect data of public inter-est within urban areas has increased at an unprecedented rate, to such an extent that data rapidly scale towardsbig urban data.
A large variety of data can be collected in the urban context, ranging from data gen-erated by citizens to those collected through sensors deployed in the city and monitor-ing environmental variables.Air qualitymeasures,weather conditions, geo-referenced people’s activities, contents fromsocial networks, electric and thermalenergy consump-tion,traffic flows and use of transport systems are just some examples of information that can be retrieved from a smart city.
The abundance and variety of data describing the urban context provide a remark-able opportunity to tackle interesting challenges and to add intelligence in several urban scenarios. Various types of analysis can be executed for many applications, like environ-mental monitoringto control pollution and reduce its effects over people; optimization ofbuildings energy consumption; detection ofsimilar interests and activities among cit-izens;road traffic management; enhancement oftransportation systems, etc. [1,2].
The integrated analysis of all such types of data yields a more thorough outlook on the factors that characterize urban scenarios, useful to support a smarter administration of cities. Whenhuge amounts of heterogeneous dataare available, devising efficientdata miningtechniques that leverage on their highly informative power can effectively boost the evolution of urban areas into smart cities.
However, the hugevolumeand theheterogeneity of urban data collected from man-ifold sourcesand expressed with differentspace and time granularitiesincrease the com-plexity of the analysis. To deal with such issues and to extract meaningful results, in-novativedata management and processing techniquesshould be devised.
1.1 Research topics description
This PhD activity mainly focuses on the characterization (i) ofbuildings energy ef-ficiency from energy-related data and (ii) of popular topics among citizens from user-generated content on social networks. The proposed analyses are aimed at supporting the enhancement of urban services, like the distribution of heating energy for residen-tial buildings, and at understanding the perception of citizens about such services and other related topics. The two application domains are introduced below, while the de-tailed research activities are described in Section1.2.
Energy efficiencyis a growing policy priority for many countries worldwide. Accord-ing to the International Energy Agency (IEA),buildingsrepresent roughly 40% of total final energy consumption in most countries. The amount of energy used for heating and cooling systems is about 60% in the residential sector [3], thus particular attention has been devoted to carry out innovative strategies for both monitoring and improving en-ergy efficiency ofbuilding heating systems. To achieve this aim, many energy firms have begun exploiting Internet of Things (IoT) technologies to monitor theHeating Distribu-tion Networks (HDN) in urban environments. Thanks to the pervasive proliferation of sensorsandsmart meters, the data generation capability of energy-related applications has rapidly increased, providing energy managers with tons of different fine-grained measures to be managed and analyzed. In addition, the integration of variables related with energy consumption (e.g., indoor and outdoor temperatures) makes possible to analyze a richer data collection and to obtain more significant results.
The analysis of energy-related data collections has received increasing attention from the research community. Indeed, they hold a great potential in terms of interest-ing knowledge that can be discovered to support the efficient management of heatinterest-ing systems. For instance, a critical challenge is the prediction of future buildings ener-gy/power demandand of their daily peak values. An accurate estimation of these values makes possible the implementation of more efficient strategies to satisfy the aggregate energy demand.
Nevertheless, efficient data integration and data analytics methods should be de-vised to extract meaningful results from suchheterogeneous data collected from mani-fold sourcesand expressed with differentspace and time granularities.
Social networksare often used by people to report information related to a variety of urban aspects. The analysis of such data can provide useful information to discover pop-ular topics among people in a city. Understanding the collective dynamics of people’s interests and needs can be a powerful advantage to devise effective targeted actions in the management of a smart city. Policy makers can exploit information from social networks to better understand people’s opinions regarding highly debated topics such as transport networks, health-care systems, public safety [4], taxes, services, etc.
1.2 – Research activity overview
networks can enable a more complete characterization of frequent patterns of user in-terests across different cities and of their evolution over time. However, the ever increas-ing volumeand the ratherheterogeneous dimensionscharacterizing such data (space,time andtext content) increase the complexity of the mining process. A further issue is repre-sented by thesparsity that often characterize collections of data from social networks. Moreover, text content must be elaborated with appropriate algorithms to accurately quantify itsrelevancy to a given topic.
For both the aforementioned application domains, an additional challenge is rep-resented by the computingperformance and scalability of algorithms and underlying platforms, that often require parallelized computations and distributed databases. To properly deal with such challenges, advanced data management platforms and efficient processing algorithms are required.
1.2 Research activity overview
The overall PhD activity described in this thesis dealt with thecollection, aggrega-tionandanalysisof different kinds of urban data, with a specific focus on the manage-ment of heterogeneity inspatio-temporal data granularities. Big Data challenges were addressed at both architectural and algorithmic layers. In thearchitectural layer, novel techniques for the storage and elaboration of big data, likeNoSQL distributed databases andin-memory cluster computingplatforms, were studied and employed. In the algorith-mic layer, the thesis aimed at innovating current data mining algorithms, by operating withparallel programming modelsandreal-time stream processingarchitectures, to fully exploit the underlying platforms. More specifically, the challenges addressed by the re-search activities are described below.
One of the main challenges of the research activity is to find efficient and effec-tive integration strategies to extract relevant patterns for the objeceffec-tives of the anal-ysis. For this purpose, a distributed business intelligence framework, called Multiple Spatio-Temporal Layers Explorator (MuSTLE), was developed to support data mining algorithms by exploring heterogeneous data at multiple layers of space and time ag-gregation, using a scalable approach. The MuSTLE framework relies on the MapReduce paradigm to aggregate data from different sources and to build multiple layers of space-time granularity for the analysis, keeping in the database only data with the original granularity. The application of MuSTLE enables the exploration of multiple representa-tions of data in a relatively short time (on-the-fly) and the extraction of patterns that can be detected only when data are expressed at given spatial and/or temporal resolutions. This approach increases the possibility to extract more significant patterns among data and to highlight phenomena that wouldn’t be obtained with a unique data representa-tion.
basically within two kinds ofapplications: the evaluation of buildings energy efficiency (energy application) and the estimation of main interests among people (social appli-cation). For each use case within the considered applications, a specific architectural solution, based on a particular instance of MuSTLE, was designed to optimize the com-putational performance and scalability of algorithms, which were extensively validated through experimental tests.
For theenergy application, a full assessment of buildings energy efficiency was car-ried out analyzing both real consumption data (operational rating) and buildings fea-tures (asset rating). The MuSTLE framework was used for space-time characterization of energy-related variables at multiple granularities and for correlation and regression analysis.
Within the context ofoperational rating, two different platforms have been designed and implemented, based on a common architecture and extended according to the char-acteristics of the analysis: DA-BOR for descriptive analytics and PA-BOR for predictive analytics.Descriptive analyticsalgorithms were used to compute different classes of Key Performance Indicators (KPIs) for building energy efficiency, also taking into account the relationship with other variables like external temperature. In this activity aNoSQL distributed databaseand aparallel programming modelwere used to speed-up the com-putation of KPIs from huge amounts of energy-related data.
On the other hand,predictive analyticsalgorithms were devised to forecast instan-taneous power demand values of heating systems at fine-grained time granularity. A correct estimation of the power (and energy) demand of buildings heating systems is useful to devise strategies for improving the overall energy utilization. However, the estimation of the power required during a short time interval is a complicated task, as it is affected by several elements difficult to be modeled. Moreover, when estimations are based on data collected in real-time, a specific issue is represented by the sizing of computational resources needed to provide results for thousands of buildings in time. Therefore, in this activityin-memory cluster computing platforms andreal-time stream processingalgorithms were used to estimate future heating power demand in near-real-time and with a small prediction error.
Within the context ofasset rating, a suitable data mining approach, called HEDE-BAR, was devised to model the relationship between building features and heating en-ergy demand, using data from Enen-ergy Performance Certificates (EPCs). Enen-ergy perfor-mance certification of buildings is considered as a cornerstone for improving energy efficiency, however, the proliferation of several certification methods does not facilitate a uniform evaluation of buildings located in different areas. Moreover, such methods are often based on a plethora of parameters and are hardly interpretable by experts. There-fore, the challenge of this activity was the definition of an asset rating methodology to generate accurate building energy demand models based on few relevant features and that are easily interpretable by domain experts. In this activity various data mining algorithms were suitably employed in all the steps of the methodology.
1.2 – Research activity overview
For the social application, the PhD activity focused on the analysis of data from social networks to provide useful information about the relationship, in several respects, between citizens and various popular topics relevant for the city. The proposed analysis has a specific focus on thetext and space-time characterizationof user posts on Twitter (tweets), to highlight the common interests among people from different cities.
Specifically, a data analytics methodology, called TCharM, based onclustering anal-ysisandassociation rules, has been developed for the exploration of large collections of Twitter data along three dimensions, i.e., text content, posting time and place, to support context-aware topic trend analysis. The main obstacle to the extraction of significant patterns from large collections of tweets is represented by the inherent sparseness of tweets and the consequent low cohesion of clusters extracted using distance measures proposed by existing related works. Therefore, a new distance measure has been also defined and extensively validated through an analytical comparison with other mea-sures. The methodology provides results describing the most discussed topics across space and over time, thus enabling to highlight the main differences of users’ interests among multiple cities and their temporal evolution. In this activity clustering and as-sociation rules mining algorithms were implemented and executed over anin-memory cluster computing platform.
This thesis is organised as follows. The MuSTLE architecture is described in Chapter2. Chapter3presents the research activities focused on the evaluation of thermal energy efficiency of buildings through operational rating, while Chapter4investigates the re-lationships between buildings features and thermal energy demand with asset rating. Chapter5presents the research activities focused on the characterization of people’s in-terests from social networks. Chapter6summarizes the achieved results and discusses future developments for the proposed approaches.
Chapter 2
The MuSTLE framework for big
urban data mining
Interest in urban data mining has rapidly grown during the last few years, both in the industrial and research domains, as well as in the Public Administration [1]. The joint analysis of data coming from different sources enables the discovery of meaningful relationships among various aspects of the urban environment and thus could increase the awareness of policy makers for city planning. For instance, discovering the correla-tion between traffic flow in a given area of the city and high pollucorrela-tion in the same area can help administrators in defining more targeted and effective environmental policies. Challenging issues come from the application of innovativedata management anddata miningtechniques to new and more complex fields, as well as from the design of inno-vative systems able to continuously monitor and analyze a smart city environment.
Urban data mining is often characterized by highdata volumeanddata heterogene-ity, which increase the complexity of the analysis. Therefore, alternative efficientdata storage and data processing techniques are required. Also data integration should be smart enough to produce suitable data sets from data generated by several sources that make use of differentspace and time references. To discover useful results, it is impor-tant to express features with appropriatespace and time granularities. According to the type of targeted analysis, the exploration of data at multiple space-time granularities can bring out interesting knowledge at different levels.
The research activity described in this thesis, focused on the analysis of big heteroge-neous urban data, led to the design and development of adistributed business intelligence engine, calledMultiple Spatio-Temporal Layers Explorator(MuSTLE), that efficiently sup-ports theintegrationandanalysisof huge and heterogeneous data collections generated in the smart city context.
With the aim of supporting different data analyses with various spatial and tem-poral abstraction levels, MuSTLE stores fine-grained data collected in the urban area. To efficiently deal with big heterogeneous data sets, in MuSTLE data are stored in a
distributed NoSQL repositorybased on MongoDB [5,6].
Then, MuSTLE computesspace-time aggregationto transpose the original data into the proper resolution for the analyses.
To gain useful insights from the stored collections, e.g., to predict future values of some parameters, MuSTLE runscorrelation and regression analysis among different urban data, for multiple space-time abstraction level.
MuSTLE exploits theMapReduce paradigm[7] to quickly perform data aggregation and data analysison-the-fly, i.e., it stores data only at the original space-time granular-ities and aggregates them once for each target granularity. The MapReduce operations make possible to distribute computation load over multiple nodes, reducing execution time and scaling up to bigger data collections.
In this chapter the overall architecture of MuSTLE is described. A representative use case is also presented to demonstrate the use of MuSTLE with different kinds of urban data. The work presented in this chapter has been published in [8].
This chapter is organized as follows. The overall context for the analysis of urban data is described in Section2.1. Section 2.2presents the related research work on ur-ban data mining. Section 2.3 introduces the components of the MuSTLE framework. Section 2.4 illustrates some demonstrative examples of urban data analysis with the MuSTLE framework. Section2.5demonstrates the scalability of data aggregation with MuSTLE. Section2.6discusses in depth the experimental results.
2.1 Context for heterogeneous urban data mining
In a smart city context, many data sources are usually employed to monitor different urban processes. Monitoring devices may be deployed in different city areas and they may use a different timeline in sampling values.To take into account the various facets of the urban environment, the MuSTLE sys-tem collects and analyses measures of different data types asair pollutant concentrations, weather conditions,vehicle traffic, andbuilding energy consumption data. More specifi-cally, the following categories of data are currently collected and analysed in MuSTLE. Meteorological measures.Weather conditions are monitored by collecting the most common meteorological indicators (as air temperature, relative humidity, cumulated precipitations and precipitation rate, wind speed, atmospheric pressure) from weather stations distributed throughout the city. Data are collected with a sampling period of few minutes (usually 5 minutes), but different and variable resolutions can be used by some stations.
Pollutant concentration.Concentration measures for each air pollutant are periodi-cally collected through dedicated sensors deployed in monitoring stations. Various pol-lutants are monitored, including particulate matters (PM10and PM2.5), benzene (C6H6), nitric oxide (NO), nitrogen dioxide (NO2), sulfur dioxide (SO2), carbon monoxide (CO).
2.1 – Context for heterogeneous urban data mining
Each station monitors the concentrations of various pollutants at a fixed time granu-larity. Data are usually collected daily or hourly, according to the specific pollutant.
Urban facilities as theenergy consumption and power level measures registered by the heating systems of residential buildings. These buildings represent the nodes of a monitoring network. The volume of each building is also used to normalize energy and power values, to make comparisons in terms of consumption per volume unit. Data are collected with a variable sampling period (with a mean value of about 5 minutes).
Citizen mobility as vehicle traffic data. Road traffic flow is measured by roadside traffic recording stations that count the number of vehicle transits per minute. Data are usually collected every minute.
The research study presented in this chapter aims at discovering interesting re-lationships among different factors characterizing the urban environment, inspecting multiple layers of space and time granularity. Two different kinds of analysis are pro-posed: correlation analysis, through the computation of a correlation coefficient that quantifies the degree of connection of couples of variables;regression analysis, that tries to model the relationship between variables according to a (linear) equation. A proper regression equation allows also to estimate the unknown values of a variable through the measured values of the other (e.g., estimate the concentration of a pollutant when the energy consumption of buildings is known).
Data analyzed in this chapter are referred to the city of Torino (Italy), administra-tively organized in 10 districts, each one including one or more quarters. As a reference case study for data analysis, aSpace Frame (SF) corresponding to a quite large district (about 7 km2) located in the central part of Torino was considered. This district in-cludes one station for air pollution monitoring, one traffic recording station, 5 weather stations, and around 100 monitored heating systems of residential buildings. As aTime Frame (TF) for data analysis, a 7-month time period from October 2014 to April 2015 was considered.
Pollutant concentration data were gathered by the ARPA Piemonte [9] through monitoring stations equipped with a set of sensors, each one measuring a different pol-lutant, and provided by the Sistema Piemonte open data portal [10]. Meteorological measures were collected through the Weather Underground web service [11], which gathers data from a geo-referenced network of Personal Weather Stations registered by users.Vehicle traffic andbuildings energy consumptionwere provided by the Smart-datanet open data platform [12] managed by Regione Piemonte. Traffic data register the number of vehicles per minute that pass by the sensors placed in some fixed points of the city. Buildings energy data register the energy consumptions for space heating of residential buildings.
2.2 Related work
Analysis of data related to the urban context is often aimed at evaluating perfor-mance indicators [13], discovering relevant relationships [14,15], detecting particular events [16,17] or building predictive models [18]. Also data associated to citizens are often extracted from phone networks and social media to take into account the human perception of the urban environment [19].
Some works like [20,21,22], are based on the active involvement of people in data collection through feedbacks from mobile devices. Since multiple kinds of data from heterogeneous sources are often considered for such analyses, the integration issue has already emerged in literature. As an example, authors in [15] propose a platform for the integration of data gathered from independent organizations, to deliver an integrated research environment for analysis of urban data. Authors in [14] focus on the problem of data aggregation over spatial and temporal dimensions, before evaluating the corre-lations between a single dynamic record set of mobile phone calls and other contextual and static datasets like urban demographics and points-of-interest (POIs). Two spatial resolutions are considered: the smaller squared cells used in mobile phone networks and the larger administrative districts. Pearson’s and Spearman’s coefficients are used for correlation analysis and multiple linear regression for prediction.
In [16], integration is achieved through the use of data fusion techniques like Cum-Sum algorithm [23] for outlier detection and the linear opinion pool method [24] for deriving the final value. [25] presents another space-time model for the integration of vector data based on ontology classification and geocoding techniques. In [26] the fu-sion of data from heterogeneous sources relies on existing open source ETL tools, like Pentaho, CloverETL, Talend. Other web and cloud based services for heterogeneous urban data integration and analysis are proposed in [27], where semantic enrichment is included and in [17] as a monitoring tool for energy management of the whole city infrastructure. In [16] fusion techniques, regression and fuzzy logic are employed to derive a decision making tool for the identification of city environmental events.
Other works aim at characterizing the impact of different spatial [28], [29] and tem-poral [30] aggregation techniques over the analysis.
On the technological side, other works have exploited the flexibility of NoSQL databases for the storage of heterogeneous urban data. For instance, in [31] a NoSQL database schema is defined to enhance scalability and facilitate searches for the analysis of some urban metrics. However, the final results of the analyses are stored in a relational database. The adoption of MapReduce paradigm to deal with data integration is experimented in [32], where it is used for heterogeneous query execution on large datasets, based on the concept of Virtual Database (VDB), a container for components used to integrate data from multiple data sources, so that they can be accessed through a uniform API. [33] addresses the problem of large scale data integration with a service oriented data integration architecture based on Hadoop and MapReduce, to exploit distributed pro-cessing and data replication. [34] presents a tool for heterogeneous data integration
2.3 – MuSTLE architecture
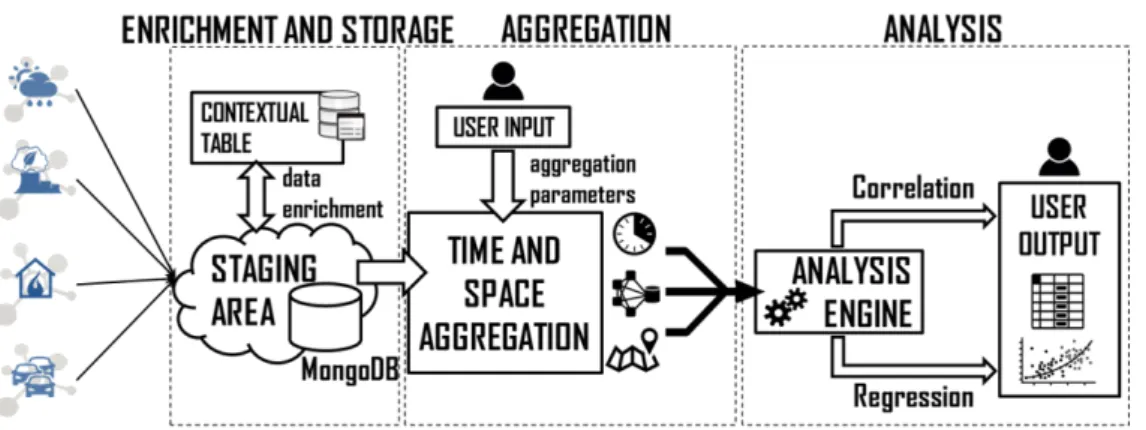
Figure 2.1: Data analysis steps of the proposed MuSTLE framework
based on Hadoop, that integrates also visual analysis. In this case, MapReduce is used just to compare individual records in order to reduce redundancy.
Contribution of the research activity. This research activity proposes the MuSTLE framework that executes data aggregation on-the-fly at different spatial and temporal resolutions, using the MapReduce computational paradigm, to facilitate the discovery of relevant relationships among data. None of the cited works has proposed a similar solution for the integration of different kinds of heterogeneous data.
2.3 MuSTLE architecture
Figure2.1represents the data analysis steps of MuSTLE framework, which is fed with data collected from devices distributed all over the city. Data elaboration is exe-cuted in three stages:data ingestion and storage,temporal and spatial data aggregation anddata analysis.
In the first stage, collected data are stored in adocument-oriented distributed database. Since data analysis can be based on different space and time resolutions, the interme-diate stage performs thetemporal and spatial aggregationfor each target value ofSpace Granularity (SG) andTime Granularity (TG). Therefore, data of different types are ag-gregated into documents, which represent the input for the data analysis stage. The MuSTLE components are detailed in the following subsections.
2.3.1 Data ingestion and storage
Raw data received from various sources includecontextual metadatato characterize the spatial and the temporal contexts in which measures have been acquired. More specifically, spatial metadata describe the geographical position of each data source
in the urban area, whiletemporal metadata describe the time when data values were measured or generated by the data source.
Data are then formatted as JSON documents and stored in a distributed repository based onMongoDB. This choice is motivated by multiple factors. (i) First of all, the hor-izontal scalability is enhanced by the sharded cluster architecture, that stores data in a distributed fashion. As the size of the data increases, adding more servers allows to scale and satisfy the demand of a higher number of read and write operations. (ii) The overallcomputational time is also reduced by processing data in parallel, through the built-in MapReduce engine, used in MuSTLE for both data aggregation and data analy-sis. (iii) Moreover, the sharded cluster architecture provideshigh redundancy and avail-ability, since data are replicated on different shards, thus reducing the risk of data loss from a single server failure. (iv) Finally, the document-oriented data model of MongoDB eases the storage ofheterogeneous dataas well as the integration of new data types, as it doesn’t require to define a schema before storing data. Even if special purpose databases can provide advanced features for the management of time series, MongoDB has been preferred due to other important features that make it well suited for the requirements of the analysis. First, MongoDB has an integrated MapReduce engine that can be di-rectly executed on the storage nodes. Other databases do not didi-rectly support MapRe-duce operations, but they need a connector to other platforms like Apache Hadoop. Other popular databases, specifically designed for time series management, do not sup-port MapReduce operations at all. Second, MongoDB provides a configurable sharding strategy, that allows the user to optimally distribute data across storage nodes and to improve the performance of queries. This feature is available in few other databases. Finally, even if time series databases provide an easy management of time series syn-chronization, MuSTLE entails also the aggregation of data along the space dimension, which needs to be addressed separately.
Horizontal scalability is obtained by exploiting data sharding, i.e., by dividing the collection and storing its data documents across distributed servers (shards). Data are distributed across shards using the hash value of thedocument IDassharding key. This random policy provides uniform data distribution independently of temporal and spa-tial attributes and also computational effort for aggregation is evenly distributed across all shards, whatever the target space-time granularity.
Replication is obtained by exploitingreplica setsof MongoDB. Each replica set con-sists of a primary node and a secondary node. All write requests go to the primary node, while the secondary node can be exploited to increase the read capacity, even if with possible data inconsistencies which are easily tolerated at the application layer.
2.3.2 Distributed space-time data aggregation
In the previous stage, collected data are stored in the data repository with their original spatial and temporal resolutions. To analyse different types of data, they must be expressed according to a unique combination of space and time resolutions.
2.3 – MuSTLE architecture
The data aggregation process is driven by the following two parameters: Spatial Granularity(SG) andTemporal Granularity(TG). They represent the common values of resolution, respectively in space and time, used to express the input data of the analysis. The concept ofgranularity identifies elementary units of time and space for data rep-resentation. For each pair of time and space unit, every feature takes a single value in the input data set. The elementary unit can have either fixed or variable dimension. In the former case, SG can have, e.g., a length of1𝑘𝑚, a square surface of1𝑚2, etc., while TG can last, e.g., 1 hour, 1 day, 1 week, etc. In the latter case, SG can take the dimension of, e.g., a building (in a city of buildings with variable dimensions), a quarter, a district, etc., while TG can last, e.g., 1 month (28, 29, 30 or 31 days), 1 year (365 or 366 days), or the duration of a given process. The target values of SG and TG, used for the analysis, should be equal to or higher than all the granularities of the original data.
The exploration of multiple granularities in both dimensions increases the possibil-ity to extract more significant patterns among data and to highlight phenomena that wouldn’t be obtained with a single pair of SG and TG. For this reason, MuSTLE explores data at multiple space-time granularities by means ofon-the-fly aggregations. For each data collection, the data aggregation task is organized as a two-phase process.
The first phase computes thetemporal data aggregationaccording to the target TG value. For each data source, measures collected during the same time slot are combined together to obtain a singletemporal aggregated valuefor the time slot. The aggregation operator used to combine measures may vary based on the considered feature and on the scope of the analysis. For instance, mean and median values can be suitable opera-tors for this phase.
The second phase computes thespatial data aggregation, i.e., data aggregation over subsets of sources grouped according to the SG value. For each area defined by SG, temporal aggregated values referred to the same time slot are combined in turn to ob-tain a single space-time aggregated value. The aggregation operator used to combine measures may vary based on the considered feature and on the scope of the analysis. For instance, when the number of measures that contribute to thetemporal aggregated values varies from one source to another, the weighted mean value can be a suitable operator for this phase. In this case, the weight associated to a source depends on the number of measures that contribute to the temporal aggregation for a given slot.
The aggregation process relies on operations based on the MapReduce paradigm, which is well suited to compute summations and also (weighted) mean values. For each processed document (containing a measure), (i) themap function emits its value and thekey that identifies its time window or space area and (ii) thereduce function both counts and sums the values of all the measures emitted for the same key. For spatial aggregation, the values are first multiplied by their weights and the sums of weights are computed too. Finally, (iii) afinalizefunction computes the aggregated values dividing each sum by the respective count (or sum of weights).
2.3.3 Distributed data analysis
Data aggregated at the desired time and space granularities are ready to be eventu-ally processed, using the MapReduce engine integrated in MuSTLE. As an example, (i) correlation analysisand (ii)regression analysisare presented in this section.
Correlation analysis in MapReduce
Let𝑋 = {𝑥𝑖,𝑖 = 1,...,𝑛}and𝑌 = {𝑦𝑖,𝑖 = 1,...,𝑛}be two time series monitored in a same space area in the city, where𝑖value determines the time frame (e.g., a pollutant concentration and the temperature value at different time instants). MuSTLE analy-ses the pairwise correlation between time series𝑋and𝑌through thePearson Product Moment Correlation(PPMC) coefficient 𝜌𝑋,𝑌 [35], which is a measure of linear depen-dence not influenced by the unit of measure of𝑋and𝑌. The higher the𝜌𝑋,𝑌value, the stronger the correlation (either negative or positive, according to the sign of the coeffi-cient). In MuSTLE, the𝜌𝑋,𝑌coefficient between time series𝑋and𝑌has been computed on MapReduce using the following equation [36]
𝜌𝑋,𝑌 = 𝑛∑𝑛 𝑖=1𝑥𝑖𝑦𝑖− 𝑛 ∑ 𝑖=1𝑥𝑖 𝑛 ∑ 𝑖=1𝑦𝑖 √𝑛 𝑛 ∑ 𝑖=1𝑥 2 𝑖 − ( 𝑛 ∑ 𝑖=1𝑥𝑖) 2 √𝑛 𝑛 ∑ 𝑖=1𝑦 2 𝑖 − ( 𝑛 ∑ 𝑖=1𝑦𝑖) 2 . (2.1)
Based on the MapReduce paradigm, themapfunction emits key-value pairs, wherekey identifies the dataset for the current analysis andvalueis the set of linear and quadratic terms that appear in Equation2.1. Thereducefunction collects and condenses the values with the same key to calculate the summations used in Equation2.1, that is eventually computed by thefinalizefunction.
Regression analysis in MapReduce
Regression analysis allows estimating the unknown values of a dependent variable (𝑌) through the measured values of an explanatory one (𝑋).
Simple linear regression analysis [37] is provided in MuSTLE to model the relation-ships between variables𝑌 and 𝑋 based on equation 𝑌= 𝑎𝑋 + 𝑏. Parameters 𝑎 and 𝑏 are respectively the slope and the intercept of the linear function; they are computed in MapReduce using the following equations [38]
𝑎 = ( 𝑛 ∑ 𝑖=1𝑦𝑖)( 𝑛 ∑ 𝑖=1𝑥 2 𝑖) − ( 𝑛 ∑ 𝑖=1𝑥𝑖)( 𝑛 ∑ 𝑖=1𝑥𝑖𝑦𝑖) 𝑛(∑𝑛 𝑖=1𝑥 2 𝑖) − ( 𝑛 ∑ 𝑖=1𝑥𝑖) 2 , (2.2)
2.4 – Examples of data analysis 𝑏 = 𝑛( 𝑛 ∑ 𝑖=1𝑥𝑖𝑦𝑖) − ( 𝑛 ∑ 𝑖=1𝑦𝑖)( 𝑛 ∑ 𝑖=1𝑥𝑖) 𝑛(∑𝑛 𝑖=1𝑥 2 𝑖) − ( 𝑛 ∑ 𝑖=1𝑥𝑖) 2 . (2.3)
Since the linear and quadratic terms are the same of Equation2.1, regression analysis employs the samemapandreduce functions of correlation analysis.
2.4 Examples of data analysis
This section reports the results of correlation analysis and regression analysis per-formed on a collection of urban data, described in Section2.1, using MuSTLE.
Experiments address the analysis of the correlation between different factors char-acterizing the urban environment, i.e., meteorological data, concentration of air pol-lutants, buildings energy consumption and traffic flows. For instance, air pollution is usually assumed to be affected, to different extents, by all the other factors, while en-ergy consumption of buildings can be influenced by climate condition. The proposed analysis are aimed at assessing such hypotheses and, possibly at discovering new un-expected relationships.
Both data aggregation and analysis have been implemented as described in Sec-tion2.3.2and Section2.3.3respectively.
Correlation analysis
To analyse the pairwise correlation between urban variables, the PPMC coefficient 𝜌𝑋,𝑌 has been computed in MapReduce (see Section2.3.3) at different time granularity
(TG) values. The most relevant results, i.e., those with overall highest values of 𝜌𝑋,𝑌, were obtained withTG = 1 day and are reported in Table2.1and Table2.2.
Although there are no hard rules for describing the correlation strength based on the 𝜌𝑋,𝑌 value, after an extensive survey, the following rule-of-thumb has been used to evaluate the results: the𝜌𝑋,𝑌 value can reveal aweak (0 < |𝜌𝑋,𝑌| ≤ 0.3),moderate (0.3 < |𝜌𝑋,𝑌| ≤ 0.7), orstrong (0.7 < |𝜌𝑋,𝑌| ≤ 1) correlation between variables𝑋and 𝑌.
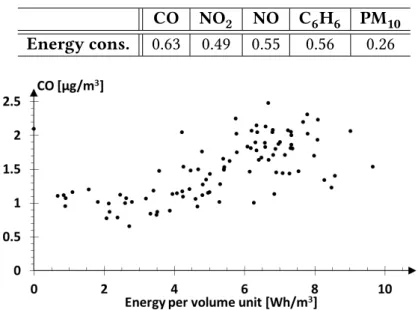
Table 2.1 shows the value of 𝜌𝑋,𝑌 between building energy consumption and the concentration of various air pollutants. Results point out a moderate correlation with Carbon Monoxide (CO) (𝜌𝑋,𝑌 = 0.63), Benzene (C6H6) (0.56), Nitric Oxide (NO) (0.55), Nitrogen Dioxide (NO2) (0.49); and a weak correlation with Particulate Matters PM10 (0.26).
The scatter plot in Figure2.2further details the correlation between values of build-ing energy consumption and CO pollutant concentration for different days.
Table 2.2 reports the correlation between various weather variables and both air pollutants concentration andbuilding energy consumption. Both temperature and wind
Table 2.1: PPMC coefficient𝜌𝑋,𝑌 between building energy consumption and pollutants concentration
CO NO2 NO C6H6 PM10
Energy cons. 0.63 0.49 0.55 0.56 0.26
Figure 2.2: Daily average buildings energy consumption per volume unit vs average CO concentration
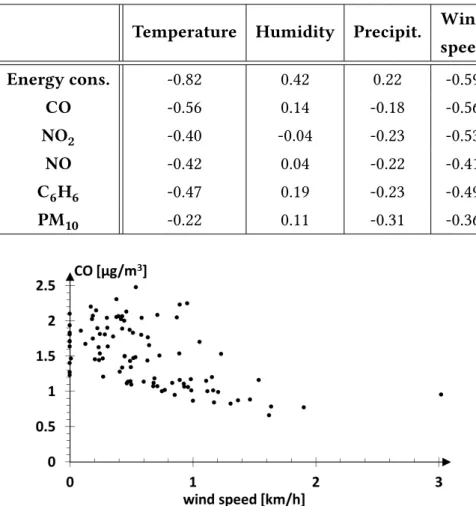
speed have amoderate (negative) correlationinfluence over CO (-0.56 for both), NO2(-0.4 and -0.53 respectively), C6H6(-0.47 and -0.49) and NO (-0.42 and -0.41). Pollutants have a low (negative) correlation with precipitation rate (values in the range from -0.31 to -0.18). The negative correlation values indicate an inverse dependency between the two variables. For instance, the CO concentration is higher for lower values of temperature and wind speed.
As an example, the scatter plot in Figure2.3 details the correspondence between wind speed and CO values. Humidity shows a weak correlation with all pollutants.
Concerning thebuilding energy consumption, it shows astrong correlationwith tem-perature (-0.82) and amoderate correlationwith humidity (0.42) and wind speed (-0.59). Thus, the energy consumption is higher for lower values of temperature and wind speed and for higher values of humidity.
The scatter plot in Figure 2.4shows the distribution of temperature and building energy consumption values.
Regression analysis
Simple linear regression analysis has been applied to couples of variables with high and moderate correlation. In order to assess the predictive power of the model, tests have been performed on the available data using a 10-fold cross validation. TheMean Absolute Percentage Error (MAPE) and the Symmetric Mean Absolute Percentage Error
2.4 – Examples of data analysis
Table 2.2: Pearson’s correlation coefficient between weather parameters and building energy consumption and pollutants
Temperature Humidity Precipit. Wind
speed Energy cons. -0.82 0.42 0.22 -0.59 CO -0.56 0.14 -0.18 -0.56 NO2 -0.40 -0.04 -0.23 -0.53 NO -0.42 0.04 -0.22 -0.41 C6H6 -0.47 0.19 -0.23 -0.49 PM10 -0.22 0.11 -0.31 -0.36
Figure 2.3: Daily average wind speed vs average CO concentration (SMAPE) metrics are used to measure the predictive performance of the model:
𝑀𝐴𝑃 𝐸 = 1𝑛∑𝑛
𝑖=1|
𝐴𝑖− 𝑃𝑖
𝐴𝑖 | (2.4)
𝑆𝑀𝐴𝑃 𝐸 = 1𝑛∑𝑖=1𝑛 |𝐴|𝐴𝑖| + |𝑃𝑖− 𝑃𝑖|𝑖| (2.5) In both equations,𝐴𝑖is the actual value of the target variable for sample 𝑠(𝑖), while 𝑃𝑖 is the corresponding predicted value.
MAPE is not a well suited metric when many actual power levels close to zero are also included. In this case, MAPE may significantly increase as it poses no upper bound to the error rate of overestimated predictions (while MAPE→ 100%when𝑃𝑖 → 0∧𝐴𝑖 ≥
Figure 2.4: Daily average temperature vs average building energy consumption per vol-ume unit
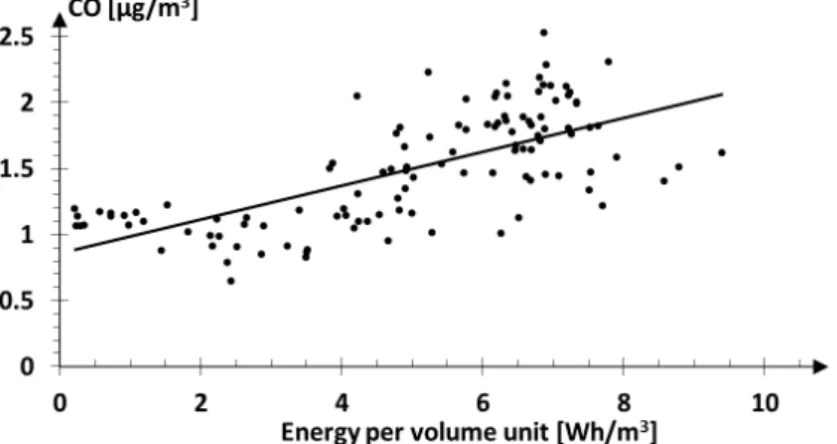
Figure 2.5: Linear regression plot between daily building energy consumption per vol-ume unit and CO concentration
0). On the other hand, SMAPE is always in the range [0%, 100%], thus limiting the error rate on the predictions of lower values and reducing their influence on the overall error. The only drawback of SMAPE is that it is not symmetric between overestimated and underestimated forecasts of the same actual values. Specifically, for a same value of absolute prediction error, the underestimated forecast has a greater impact on the overall SMAPE value.
As an example, Figure2.5shows the regression equation two moderately correlated parameters: building energy consumption against CO pollutant concentration. The re-sulting model is quite accurate in predicting the CO concentration knowing the building energy consumption, since it exhibits a MAPE equal to 18.8%.
2.5 – Computing performance of algorithm
2.5 Computing performance of algorithm
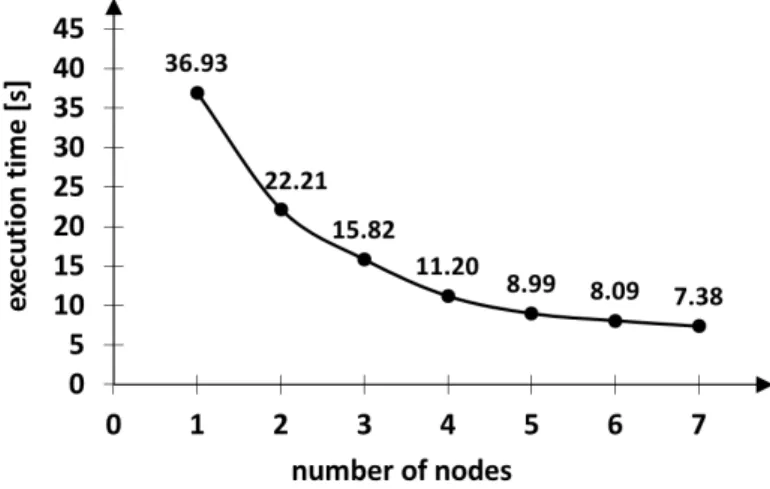
The algorithm for time and space data aggregation has been tested on a MongoDB cluster of 7 nodes, measuring the variation of the execution time with respect to the number of employed nodes (from 1 to 7). The plot in Figure2.6refers to daily aggre-gation (TG = 1 day) of about 68 thousands records related to a 7-months period. The execution time goes down but with a decreasing rate. The highestefficiency (speedup divided by the number of nodes) is reached with 2 nodes (0.83) and significantly de-creases from 5 (0.82) to 6 nodes (0.76). Therefore, 5 nodes can be considered a good balance between the speed-up and the need to minimize the employed nodes.
Despite the small size of the data set, the plot allows to evaluate the speedup and the efficiency for different sizes of the cluster. A more challenging use case, where the use of parallel processing is adequate, is the one of Section3.4.4, where the same algorithm is applied to data about 2000 buildings (more than 50 million records).
Figure 2.6: Execution time of the MapReduce aggregation algorithm on about 68k records using up to 7 computing nodes
2.6 Discussion
The experimental Section 2.4 has introduced some examples of information pro-vided by MuSTLE, through the exploration of different kinds of data at multiple space and time layers. MuSTLE does it by processing data in a distributed way, ensuring a good scalability of algorithms, as demonstrated in Section2.5.
Some significant information about the relationship among variables of different type was discovered. For instance, we discovered a strong correlation between air tem-perature and buildings energy consumption and a moderate negative correlation be-tween wind speed and pollutants concentration. The PPMC coefficient has been used
to quantify the correlation between variables of different type. The use of distance mea-sures for time series, likeDynamic Time Warping (DTW) [39], has not been taken into account as they are not really suitable for the considered experiments, where the dis-tance between time series related to the same variable is not considered. Moreover, DTW expresses a measure of distance between time series. The correlation analysis proposed in this study is aimed at discovering variables that are correlated, but not nec-essarily because they have similar values (either at the same time or at shifted times).
It is important to note that these highstatistical correlationsdo not necessarily imply a physical dependence among the variables (e.g., cause and effect). Nevertheless, no apparent statistical correlation was found into the analysed data between the observed traffic flow and the other variables. These results may be due to the fact that the selected district is located in the central city area. Thus, the average daily traffic shows a low variability, loosely dependent from the other factors. With a view to improving the results of this study, Bayesian networks [40] could be a good tool to infer and quantify the dependencies among the analysed variables and will be taken into account for a future extension of the MuSTLE engine.
In next Chapters3 and5, MuSTLE has been enriched with advanced data mining algorithms, for different kinds of analysis: (i) by assessing the data abstraction level that highlights the most interesting correlations among available data, in particular for energy-related data and (ii) to discover the most relevant topics discussed by users in different urban areas, for user-generated data on social networks. Additional urban data types can be collected and integrated in MuSTLE.
Chapter 3
Evaluation of buildings energy
efficiency using real energy-related
data
Energy efficiency is a growing policy priority in many countries. A notable portion of total final energy consumption is ascribed to the heating and cooling systems of residential buildings. Thus, innovative strategies for improving energy efficiency are needed. The recent availability of different energy-related data collected through IoT devices makes possible a more in depth assessment of buildings energy consumption. Indeed, interesting knowledge can be discovered from those data to support a more targeted management of heating systems, reducing inefficiencies and energy waste.
In this chapter, the characterization of the urban context is focused on the analysis of real data related to buildings energy consumption for space heating. These values have been measured by devices placed inside and around buildings. The research activity presented in this chapter has been published in [13,41].
The overall purpose of this study, in the context ofurban data mining, is to provide data analytics services useful to improve the energy efficiency of buildings. Theenergy efficiency of a building is evaluated by comparing its energy consumption per unit of volume (or floor area) with the average values of energy consumption of buildings of the same type, under similar environmental conditions.
The research activity addressed two different kinds of analysis to thoroughly inves-tigate theenergy consumptionof residential buildings for space heating, using real data (operational rating). The two analyses have different purposes:descriptive and predic-tive. In Section3.4descriptive analytics algorithms are used to compute different classes of Key Performance Indicators (KPIs) about thermalenergy efficiency of buildings. Sec-tion3.5is still focused on operational rating but with a predictive purpose, as the aim is to forecast instantaneouspower demand values of heating systems at fine-grained time granularity.
of urban parameters, collected throughgeo-referenced devicesand expressed astime se-ries. In particular, we combinedmeteorological datawithenergy-related measures, due to the well-assessed strong correlation between climate conditions and thermal energy consumption in buildings. Such data are analysed at different space and time granu-larities, adopting the aggregation strategy of the MuSTLE framework described in Sec-tion2.3.2.
This chapter is organized as follows. The description of the urban context consid-ered for the analysis of buildings energy data is provided in Section 3.1. Section 3.2
presents the research work related to the management and analysis of real building en-ergy consumption data. Section3.3describes all the layers of the general architecture for operational rating. Section3.4and Section3.5present and comment the experimen-tal results, respectively for descriptive and predictive analytics. Section3.6discusses in depth the achieved results.
3.1 Urban context for the analysis of buildings energy
data
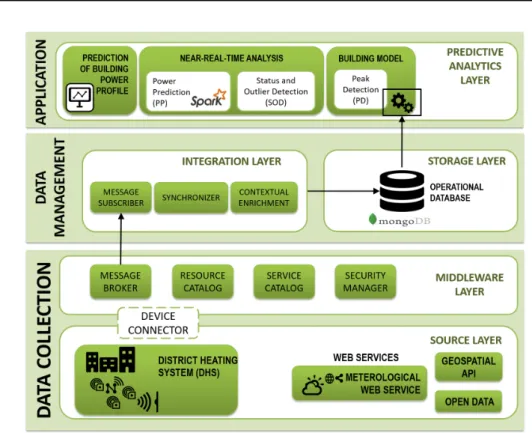
The PhD research activity presented in this chapter focuses on the analysis of heat-ing energy data collected fromurban buildings. The reference city context is organised in various districts. A district includes several buildings which are provided with en-ergy coming from aDistrict Heating System (DHS) and transferred through aHeating Distribution Network(HDN). Each building has one (or more)heat exchanger connected to the HDN to receive energy for space heating.Smart meters and sensors placed in-side buildings monitor the status of the heat-exchangers by measuring several vari-ables, like energy and power levels and heat temperatures. Othersensor networks are deployed throughout the city and monitor the environmental conditions surrounding the buildings, like temperature and humidity.
For the analyses described in this chapter, two types of data have been used to in-vestigate the energy efficiency of buildings:dynamic data, measured roughly every few minutes and potentially exhibiting huge volume and highly variable values; andstatic data, describing some time invariant properties of the data source.
Dynamic datainclude energy-related data, continuously acquired from each build-ing, and other variables that characterize the environmental conditions, both inside and outside buildings. Smart meters installed in buildings provide fine-grained data related to building thermal energy, like instantaneouspower demand, cumulativethermal en-ergy consumption,water flowand correspondingtemperatureinside the heat exchanger. Sensors placed inside and outside buildings collect measure aboutclimate conditionsfor different points of the city and at different time instants. Meteorological web services (e.g., Weather Underground [42]) can be queried to access such data, which include dif-ferent kinds of meteorological variables as temperature, relative humidity, precipitation, wind direction, UV index, solar radiation and atmospheric pressure.
3.2 – Related Work
Static datareport features characterizing the data source as itsgeographical location (longitude and latitude). Static data also include information characterizing buildings as the volume and floor area of each building where smart meters are located. These values are used to normalize energy and power values to compare different buildings in terms of consumption per volume/surface unit. Also the indication of building type (residential, schools, etc.) is useful to compare buildings of the same type.
The PhD research activity addressed the design and development of a platform to monitor thermal energy consumption in a DHS, to efficiently compute the energy per-formance and forecast future consumption of every building in a city district, and to eventually improve the energy efficiency and the overall management of the DHS. The following two different kinds of analysis are proposed: descriptive analytics and pre-dictive analytics.
Descriptive analytics is used in Section3.4to characterize the energy efficiency of buildings by computing different classes of KPIs based on real energy-related data. KPIs are based either on a single energy-related variable or on the joint analysis of manifold energy-related variables. In both cases, their purpose is to make possible a proper com-parative analysis of the energy efficiency of a building. KPIs are computed using the MuSTLE framework.
Predictive analyticsis used in Section3.5to forecast the instantaneouspower demand and the heating energy consumption of a building, based on the relationship between these parameters and the climate conditions surrounding the building. The proposed algorithms estimate the power level of heat exchange during various time slots, using a fine-grained time resolution. The correct estimation of peak values for each building allows energy manager to properly size the HDN and manage the whole DHS for the next days.
The research studies presented in this chapter are based on energy-related data col-lected in a real world system in the city of Turin (Italy), where several residential build-ings are served by the HDN. Energy-related variables are measured from about 4,000 monitored buildings, each one generating about 2,000 data frames per day, thus result-ing in a growresult-ing database of at least 8 million data frames per day. Meteorological data are collected from the Weather Underground web service [42]. Data from many weather stations are collected to estimate the weather conditions nearby each building.
3.2 Related Work
In Smart City and Smart Grid scenarios, different solutions have been proposed to enable a pervasive monitoring and management of energy data and to provide general purpose services [43,44,45,46,47,48,49]. These solutions are mainly focused on the system architecture and device interoperability, without really innovative systems that continuously collect useful data and provide advanced analytics services to eventually improve energy efficiency.
Significant research activities have been carried out using database management systems, exploratory data mining techniques, and statistical tools in the field of storage and analysis of energy data, to evaluate the energy efficiency of buildings [50,51]. The proliferation of sensor networks for monitoring indoor and outdoor environmental pa-rameters has brought to facility managers huge archives of measures with temporal and spatial references. Research contributions on these large data volumes have been carried out for: (i) supporting data visualization and notification of anomalies [52]; (ii) efficient storage and retrieval of sensors data for energy data inspection [53, 54]; (iii) charac-terizing consumption profiles among different users [55,56]; (iv) identifying the main factors that increase energy consumption (e.g., floors and room orientation [57], loca-tion [56]).
A parallel effort has been devoted to designing and implementing systems based on Big Data technologies to provide different kinds of descriptive analytics for buildings energy consumption. Proposed solutions are general purpose [58,59] or tailored to a given application domain, such as thermal energy consumption for space heating [60], residential energy use [61,62], renewable energy [63], air pollution levels [64]. Authors in [58] highlight the key components that should be included in an analytics cloud service: service management, workflow management and data management. The work in [60] tries to point out the key features of an Energy Management System (EMS), to support frequent pattern discovery on event streams. A Data Stream Management Sys-tem (DSMS) is used, to better suit the typical queries of real-time EMSs on time-varying data streams. Belussi and Danza [65] presents a research project aimed at establishing an analytical methodology to analyse energy performance of buildings throughenergy signature and to highlight malfunctions. Ghiaus [66] proposes a robust analysis of ES with linear regression, to calculate thetotal heat loss coefficient of the building and the associated external temperature. The data used are referred to the daytime in the range [10𝑎𝑚 − 6𝑝𝑚], in order to reduce dynamic effects.
Different research efforts have been carried out also in the development of novel pre-dictive analyticsalgorithms to forecast buildings energy consumption and performace indexes (e.g.,power demand,energy consumption,heat loss coefficient). Some works have been devoted to characterizing energy consumption, using data driven approaches [67] also with the support of machine learning algorithms like Neural Networks [68, 69], Gaussian Mixture Models [70], and Support Vector Machines [71] as well as energy efficiency by extracting relevant features of heating systems [72] and through Energy Signature (ES) analysis. Sjögren, Andersson, and Olofsson [73] studied the sensitivity of the heat loss coefficient and internal temperature estimated with the ES method to dif-ferent time periods and gained energy. The data us