Feature Selection of Network Intrusion Data using Genetic
Algorithm and Particle Swarm Optimization
Iwan Syarif
Politeknik Elektronika Negeri Surabaya E‐mail: [email protected]
Abstract
This paper describes the advantages of using Evolutionary Algorithms (EA) for feature selection on network intrusion dataset. Most current Network Intrusion Detection Systems (NIDS) are unable to detect intrusions in real time because of high dimensional data produced during daily operation. Extracting knowledge from huge data such as intrusion data requires new approach. The more complex the datasets, the higher computation time and the harder they are to be interpreted and analyzed. This paper investigates the performance of feature selection algoritms in network intrusiona data. We used Genetic Algorithms (GA) and Particle Swarm Optimizations (PSO) as feature selection algorithms. When applied to network intrusion datasets, both GA and PSO have significantly reduces the number of features. Our experiments show that GA successfully reduces the number of attributes from 41 to 15 while PSO reduces the number of attributes from 41 to 9. Using k Nearest Neighbour (k‐NN) as a classifier,the GA‐reduced dataset which consists of 37% of original attributes, has accuracy improvement from 99.28% to 99.70% and its execution time is also 4.8 faster than the execution time of original dataset. Using the same classifier, PSO‐ reduced dataset which consists of 22% of original attributes, has the fastest execution time (7.2 times faster than the execution time of original datasets). However, its accuracy is slightly reduced 0.02% from 99.28% to 99.26%. Overall, both GA and PSO are good solution as feature selection techniques because theyhave shown very good performance in reducing the number of features significantly while still maintaining and sometimes improving the classification accuracy as well as reducing the computation time.
Keywords: feature selection, Genetic Algorithm (GA), Particle Swarm Optimization (PSO), Evolutionary Algorithm, intrusion detection
1. INTRODUCTION
Intrusion detection is a process of gathering intrusion‐related knowledge occurring in the process of monitoring the events and analyzing them for signs of intrusion (Gudadhe et al., 2010). A Network Intrusion
Detection System (NIDS), which is a combination of software and hardware, is used to detect all types of malicious network traffic and computer usage that could not be detected by a conventional firewall. A network‐based IDS uses raw network packets as the data source compared with a host‐based intrusion detection system which uses system calls, memory and file system activity to detect intrusion. NIDS typically utilizes a network adapter running in promiscuous mode to monitor and analyze all traffic in real‐time as it travels across the network.
Most current IDS are unable to detect intrusion in real time because of high dimensional audit data produced during daily operation. In experiment conducted by MIT Lincoln Lab, network traffic over 7 weeks contains four giga bytes of compressed binary tcp‐dump data which then processed into five million connection records(Lippmann et al., 2000). Size and dimensionality of the intrusion data is one of major problemsin IDS research. One possible solution to reduce the complexity and computation time isapplying feature selection algorithms. One of the problems related to the high dimensional data such as network intrusion data, is the fact that analyzing these data becomes more difficult and requires more advanced techniques. There are at least three serious problems caused by high dimensional data: complexity, over‐fitting and the number of samples.
2. RELATED WORKS
Feature selection is the process of reducing the number of random variables under consideration. This technique is a very important topic in data mining or machine learning area and it is widely used in specific applications such as image processing, bio‐informatics, intrusion detection, email and web spam analysis, text classification and pattern recognition(Braun et al., 2012).
An efficient feature selection method can eliminate irrelevant and redundant data; hence it can improve the classification accuracy and detection rate in NIDS problems(Tjiong and Monteiro, 2011)(Liu et al., 2006). Feature selection problems are classified into two main categories: finding the optimal predictive features and finding all the relevant features for the class attribute.
(Hall and Holmes, 2003) reported that if the data has many irrelevant, redundant and noisy features, the constructed model will have poor classification performance as well as higher computation cost.
To build an effective classification model, feature selection is a very important issue because it will limit the number of input features in a classifier to produce a good predictive and less computationally intensive model. With a smaller feature subset, the rationale for the classification decision can be analyzed and decided easier. (Syarif et al., 2012a) reported that if the data has many irrelevant, redundant and noisy features, the constructed model will have poor classification performance as well as higher computation cost.
There are many publications related to the use of dimensionality reduction algorithms in NIDS field. (Shyu et al., 2003)proposed to use Principal Component Analysis (PCA) in NIDS. PCA was applied to reduce the dimensionality of the network traffics which contains many intrusions. They evaluated their method over the KDD (Knowledge Discovery in Database) CUP99 intrusion data and have demonstrated that PCA produced better detection rate than other well known intrusion detection algorithms. (Yang et al, 2008) proposed to use Independent Component Analysis (ICA) rather than PCA to reduce the dimensionality of intrusion datasets. They claimed that ICA is much better than PCA when applied to intusion dataset.
In this research, we used GA and PSO to find the best features or subsets of network intrusion datasets. The main reason why we selected GA and PSO is because both techniques are widely used among researchers and have been successfully applied im many fields such as bioinformatics, network security, healthcare, etc.
2.1.Feature Selection using Genetic Algorithm
The Genetic Algorithm (GA) technique was originally proposed by John Holland in the 1975 as an experiment to see if the computer programs could evolve in the Darwinian sense. GA has been applied to many function optimization problems and has been shown to be good in finding optimal and near optimal solutions. GA can be applied to solve a variety of optimization problems that are not well suited for standard optimization algorithms, including problems in which the objective function is discontinuous, non‐ differentiable, stochastic, or highly non‐linear(Malhotra et al., 2011) .
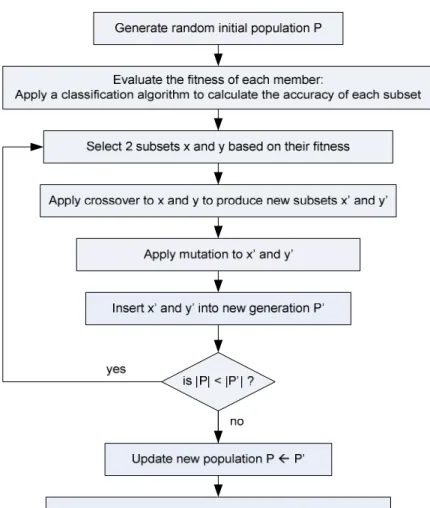
We used GA‐based feature selection developed by Mark Hall (Hall, 1999) which has been integrated to WEKA Data Mining Tools. A GA is used as a search technique to find the optimal subset. A solution is stored in fixed length binary string which represents a subset of original features. The value of each position in the string means presence for 1 and absence for 0. A new generation is randomly generated as an initial process then finding the optimal subset of original features is actually an iterative process. A generation is produced in each iteration by applying genetic operators such as crossover and mutation to the member of population (current generation). Crossover operator combines two different subsets and then generates a new pair of subset. The mutation operator changes some of values which mean randomly adding or removing features in subset. To produce a better generation, a couple of members (usually called parents) are carefully selected using the fitness function. The iteration will be stopped if there is no more generation to process.The flowchart of GA‐based feature selection is described in the Figure 1 below (Hall, 1999).
Figure 1. Feature Selection using GA
2.2.Feature Selection using Particle Swarm Optimizations
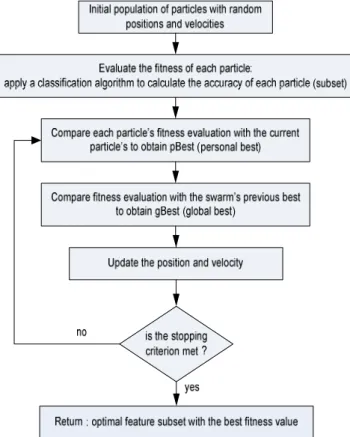
Particle swarm optimization (PSO) is an evolutionary computation technique that was first developed by Kennedy and Eberhart (1995) and is inspired by the behavior of bird flocking to reach destination not completely known. PSO is powerful, easy to implement and computationally efficient. Like other evolutionary algorithms, PSO performs searches using a population (called swarm) of individuals (called particles) that are updated from iteration to iteration (Tjiong and Monteiro, 2011). To discover the optimal solution, each particle changes its searching direction according to two factors, its own best previous experience (called personal best or pbest) and the best experience of the whole swarms (called global best or gbest). The local best of a particle can be considered as the cognitive part while the global best particle is considered as the social part (Schuh et al., 2012).
Each particle in the swarm represents one possible solution to the problem. At first, the swarm of particles is given a random initial location and velocity and is updated based on these following equations:
, = , + , (2)
Where x is the position of the particle i, v is its velocity, j is the dimension, t is time and ω is the inertial weight which represents how much of the previous velocity is retained while exploring. C1 and c2 are learning
factor, r1 and r2 are weighting parameters, pi,j is local best while pg,j is global
best particle. The fitness of each particle is calculated for each iteration, the personal best and global best are also updated using Equation 1 and 2. Once the termination criteria is achieved, PSO will have good fitness, a set number of generations or a convergence factor such as a threshold for minimum population change.
The flow chart of PSO algorithm for feature selection is explained in Figure 2 below (Jwo and Chang, 2009).
Figure 2. PSO search for feature selection
3. ORIGINALITY
In this paper, we focus on implementing feature selection algorithms especially Genetic Algorithm (GA) and Particle Swarm Optimization (PSO) to find the most important features of network intrusion dataset. There have been a lot of publication related to both feature selection and network intrusion detection fields. Some researchers proposed to use feature
extraction algortihms such as Principal Component Analysis (PCA) and Independent Component Analysis (ICA) into network intrusion data. We prefer to use feature selection algorithms rather than feature extraction algorithms because they still use the original features. We used intrusion dataset (Lippmann et al., 2000) which consists of 41 attributes and more than 2 millions records.
We decided to use GA and PSO because both algorithms have been successfully applied into high dimensional data such as bioinformatics, web server log analysis,credit card fraud detection, financial analysis, etc. We would like to investigate and compare the performance of both methods when applied into network intrusion data. One of our goals is to find the most important features of intrusion data that can improve the performance of NIDS in detecting intrusion real‐time accurately.
4. SYSTEM DESIGN
In this paper, we used GA and PSO as feature selection algorithms and then we analyzedthe classification performance before and after reduction based on classification accuracy. Our proposed system is shown in Figure 3 below.
Figure3. System Design
4.1. Intrusion Dataset
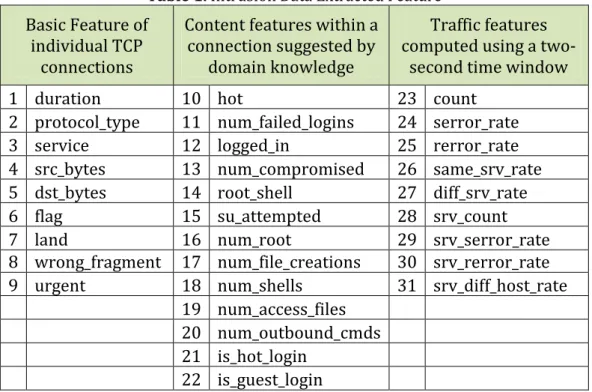
One of the most widely used data set for evaluating intrusion detection system (IDS) is the DARPA/Lincoln Laboratory off‐line evaluation dataset or usually called IDEVAL (Lippmann et al., 2000).The intrusion was divided into four main categories: DoS (Denial of Service): an attack in which the attacker makes some computing or memory resource too busy or too full to handle legitimate request, R2L (Remote to Local Attack): an unauthorized access from a remote machine, U2R (User to Root): a type of exploit in which the attacker starts out with access to a normal user account and probing attack: an attempt to gather information about a network of computers. (Lee and Stolfo, 1998) converted the IDEVAL dataset into KDD (Knowledge Discovery in Databases) Cup 1999 Intrusion dataset which contains 41 attributes and is labelled as either normal or an attack as shown in Table 1 below.
Table 1. Intrusion Data Extracted Feature
Basic Feature of individual TCP
connections
Content features within a connection suggested by
domain knowledge
Traffic features computed using a two‐
second time window 1 duration 10 hot 23 count
2 protocol_type 11 num_failed_logins 24 serror_rate 3 service 12 logged_in 25 rerror_rate 4 src_bytes 13 num_compromised 26 same_srv_rate 5 dst_bytes 14 root_shell 27 diff_srv_rate 6 flag 15 su_attempted 28 srv_count 7 land 16 num_root 29 srv_serror_rate 8 wrong_fragment 17 num_file_creations 30 srv_rerror_rate 9 urgent 18 num_shells 31 srv_diff_host_rate
19 num_access_files 20 num_outbound_cmds 21 is_hot_login 22 is_guest_login
4.2. Feature Selection and Classification Algorithms
In this research, we use GA and PSO as feature selection algortihms to reduce the number of feature of intrusion dataset. After that, we apply four different classification algorithms which are k‐Nearest Neighbour, Rule Induction, Decision Tree and Naive Bayes to intrusion datasets which have been reduced by GA and PSO.
4.3. Performance Measurement
The metric used to evaluate the performance of classifier is given below (Davis and Goadrich, 2006):
Table 2. Performance metric
Predicted Label
Positive Negative
Actual Label Positive True Positive (TP) False Negative (FN) Negative False Positive (FP) True Negative (TN)
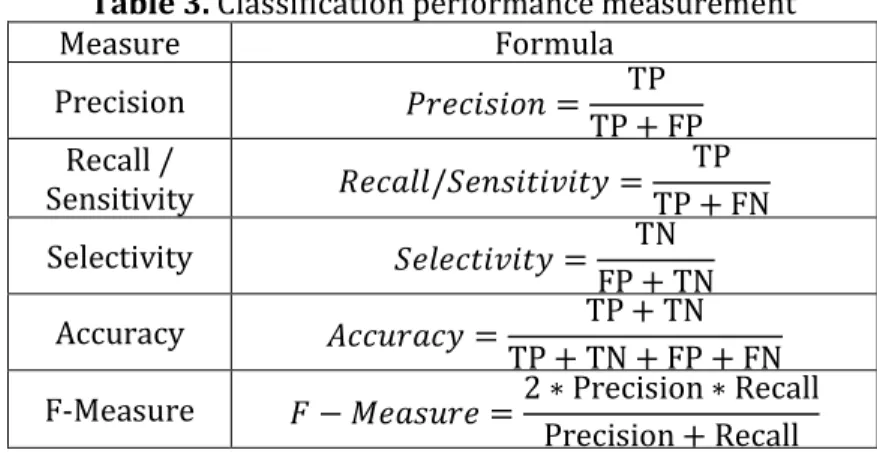
Many researchers use accuracy and false positive rate as performance measurement for classification problems, but other researchers (Davis and Goadrich, 2006)(Kotsiantis, 2007)(Williams et al., 2006)(Davis and Goadrich, 2006) argue that accuracy and false positive rates are not enough and simply using accuracy results can be misleading. They suggest accuracy, precision, recall and ROC curve as better performance measurement methods.
Table 3. Classification performance measurement Measure Formula Precision = TP TP + FP Recall / Sensitivity /" # #$ = TP TP + FN Selectivity " # #$ = TN FP + TN Accuracy & ' $ = TP + TN TP + TN + FP + FN
F‐Measure ( − ) ' =2 ∗ Precision ∗ Recall
Precision + Recall
Precision is the percentage of positive predictions that are correct. Recall or sensitivity is the percentage of positive labeled instances that were predicted as positive. Specificity is the percentage of negative labeled instances that were predicted as negative. Accuracy is the percentage of correctly classified instances over the total number of instances.Fraction of Features (FF) is the ratio of the number of features used by the classifier to the total number of features in the dataset.
5. Experimental Results
We used GA and PSO for feature selectors provided by WEKA and then applied four basic machine learning algorithms (k‐nearest neighbour, decision tree, rule induction and naïve Bayes) provided by RapidMiner Data Mining Tools. The WEKA feature selection algorithms have two important components: attribute evaluator and search method. ‘Attribute evaluator’ is a technique used to evaluate the performance of feature subsets and ‘search method’ is an algorithm used to search through the space of feature subsets.
5.1. GA results
We applied a GA search technique and an attribute selector called
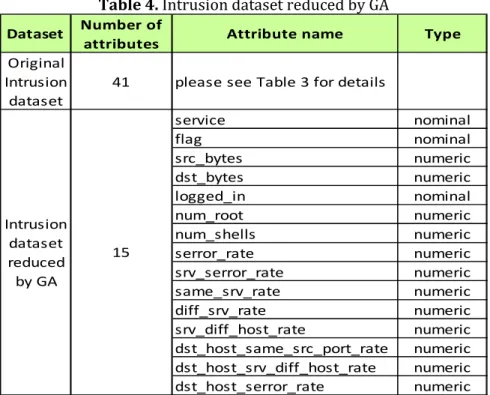
CfsSubsetEval which is amethod used to evaluate the performance of an attribute subset by considering the individual predictive ability of each attribute along with the degree of redundancy between them. This technique is successfully reduced the number of attributes from 41 to 15 as shown by Table 4 below.
Table 4. Intrusion dataset reduced by GA
We evaluate the effectiveness of GA‐reduced dataset by applying four basic classifiers (naive Bayes, k Nearest Neighbour, decision tree and rule induction) and the results are shown in Error! Reference source not found.5 below.
Table 5. Classification results on GA‐reduced intrusion dataset Original Intrusion
Data Intrusion Dataset reduced by GA (15 attributes) (41 attributes) Accuracy Precision Recall F-Measure
Naive Bayes 88.23% 90.11% 84.02% 86.93%
k Nearest Neighbour 99.72% 99.74% 99.67% 99.70% Decision Tree 97.92% 99.77% 95.76% 97.27% Rule Induction 91.21% 92.01% 91.22% 91.61%
k‐NN outperforms other algorithms which achieved the best performance with F‐measure=99.70%. This results is much better than applying k‐NN to the original intrusion dataset (41 attributes) with F‐ measure=99.28%.
Dataset Number of
attributes Attribute name Type
Original Intrusion
dataset
41 please see Table 3 for details
service nominal flag nominal src_bytes numeric dst_bytes numeric logged_in nominal num_root numeric num_shells numeric serror_rate numeric srv_serror_rate numeric same_srv_rate numeric diff_srv_rate numeric srv_diff_host_rate numeric dst_host_same_src_port_rate numeric dst_host_srv_diff_host_rate numeric dst_host_serror_rate numeric Intrusion dataset reduced by GA 15
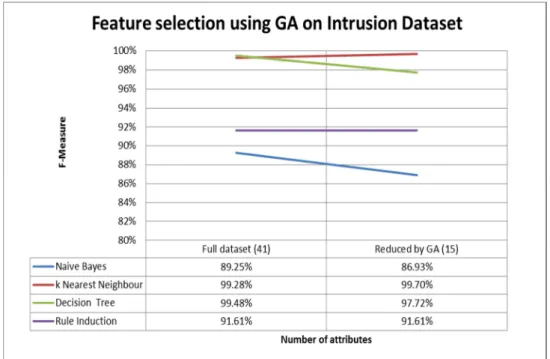
Figure 4. Classification results on GA‐reduced intrusion dataset
Figure 4 shows that applying k‐NN to GA‐reduced intrusion dataset improves the accuracy (F‐measure) from 99.28% to 99.70% even though the number of attributes is only 15 rather than 41. Rule induction algorithm has the same accuracy for both dataset with 41 and 15 attributes which is 91.61%. However, both naïve Bayes and decision tree are unable to maintain the accuracy because the accuracy decreases from 89.25% to 86.93% (naïve Bayes) and from 99.48% to 97.72% (decision tree).
5.2. PSO results
We continue our feature selection experiment using PSO search and an attribute selector called CfsSubsetEval with the default parameters. From the 41 attributes of intrusion dataset, PSO selected the best 9 of them which are shown in the Table 6 below.
Table 6. Intrusion dataset reduced by PSO
Dataset Number of
attributes Attribute name Type
Original Intrusion
dataset 41 please see Table 3 for details
src_bytes numeric dst_bytes numeric serror_rate numeric srv_serror_rate numeric same_srv_rate numeric diff_srv_rate numeric dst_host_same_src_port_rate numeric dst_host_srv_diff_host_rate numeric dst_host_serror_rate numeric Intrusion dataset reduced by PSO 9
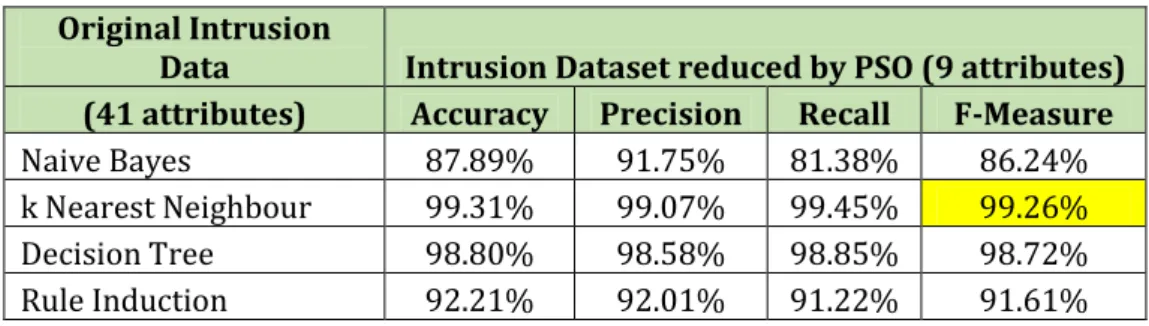
To evaluate the performance of PSO‐reduced dataset, we apply four basic classifiers as before and the results are shown in Table7 below.
Table7. Classification results on PSO‐reduced intrusion dataset Original Intrusion
Data Intrusion Dataset reduced by PSO (9 attributes) (41 attributes) Accuracy Precision Recall F-Measure
Naive Bayes 87.89% 91.75% 81.38% 86.24%
k Nearest Neighbour 99.31% 99.07% 99.45% 99.26% Decision Tree 98.80% 98.58% 98.85% 98.72% Rule Induction 92.21% 92.01% 91.22% 91.61%
As in GA experiments, k‐NN consistently outperforms other algorithms which achieved the best performance with F‐measure=99.26%. Unfortunately this result is not as good as GA’s result which is 99.70% and slightly worse than applying k‐NN on the original dataset which is 99.28%.
Figure 5. Classification results on PSO‐reduced intrusion dataset
Even though PSO has successfully reduced the number of attribute from 41 to 9, its results are not as good as GA’s. As shown in Figure 5, k‐NN, decision tree and rule induction relatively have stable performance when the number of attribute isreduced to 9 attributes only. Naïve Bayes is the only
algorithm where its performance significantly decreased from 89.25% to 86.24%.
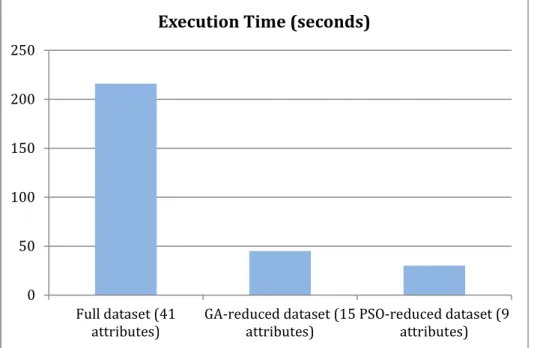
Figure 6.Execution time of three different intrusion datasets
Figure 6 shows that reducing the number of features affects the execution time significantly. Applying k‐NN algorithm into original network intrusion datasets with 41 attributes takes 216 seconds. Applying the same classifier (k‐NN) into GA‐reduced datasets with 15 attributes takes 45 seconds (4.8 times faster). The fastest execution time is applying k‐NN into PSO‐reduced dataset which has 9 attributes, it takes only 30 seconds or 7.2 times faster than the original datasets.
6. CONCLUSION
We have applied Genetic Algorithms (GA) and Particle Swarm Optimization (PSO) into network intrusion data to reduce the number of features. Both algorihtms have shown satisfactory results in selecting the most important features while in the same time maintains the intrusion detection rate. In terms of dimensionality reduction, PSO is much better than GA. PSO has successfully reduced the number of intrusion dataset features from 41 attributes to 9 (22% of original attributes) while GA reduced the number of attributes from 41 to 15 (37% of original attributes).
In terms of classification performance, GA isslightly better than PSO. In our experiments, we applied four widely used machine learning algorithms which are naive Bayes (NB), k‐Nearest Neighbour (k‐NN), Decision Tree (DT) and Rule Induction (RI) into three different types of intrusion datasets (original dataset, GA‐reduced dataset and PSO‐reduced dataset). We found that k‐NN outperforms other three algorithms. When we applied k‐NN into
0 50 100 150 200 250 Full dataset (41 attributes) GA‐reduced dataset (15 attributes) PSO‐reduced dataset (9 attributes)
GA‐reduced dataset, the accuracy isimproved from 99.28% to 99.70% and the execution time is 4.8 times faster than the execution time of original dataset.However, the feature selection algorithm does not always improve the accuracy. Using the same classifier (k‐NN) into PSO‐reduced dataset, the accuracy is slightly decreased from 99.28% to 99.26% but its execution time is 7.2 times faster.
In the future work, we will implement our proposed method to online network traffics to detect real time intrusions.
REFERENCES
[1] Braun, A.C., U. Weidner, and S. Hinz. “Classification in High‐Dimensional Feature Spaces #x2014;Assessment Using SVM, IVM and RVM With Focus on Simulated EnMAP Data.” IEEE Journal of Selected Topics in Applied Earth Observations and Remote Sensing 5, no. 2 (April 2012): 436–43. doi:10.1109/JSTARS.2012.2190266.
[2] Davis, Jesse, and Mark Goadrich. “The Relationship between Precision‐ Recall and ROC Curves.” In Proceedings of the 23rd International Conference on Machine Learning, 233–240. ICML ’06. New York, NY, USA: ACM, 2006. doi:10.1145/1143844.1143874.
[3] Eskin, E, A Arnold, M Prerau, L Portnoy, and S Stolfo. “A Geometric Framework for Unsupervised Anomaly Detection: Detecting Intrusions in Unlabeled Data.” In Applications of Data Mining in Computer Security. Kluwer, 2002. http://citeseerx.ist.psu.edu/viewdoc/summary?doi=10.1.1.8.5445.
[4] Gudadhe M., Prasad P., Wankhade K., “A new data mining based network intrusion detection model”, in proceeding International Conference on Computer & Communication Technology (ICCCT’10), pp. 731‐ 735, 2010
[5] Hall, M.A., and G. Holmes. “Benchmarking Attribute Selection Techniques for Discrete Class Data Mining.” IEEE Transactions on Knowledge and Data Engineering 15, no. 6 (2003): 1437–47. doi:10.1109/TKDE.2003.1245283.
[6] Hall, Mark A. “Correlation‐Based Feature Selection for Machine Learning,” 1999.
[7] Jwo, Dah‐Jing, and Shun‐Chieh Chang. “Particle Swarm Optimization for GPS Navigation Kalman Filter Adaptation.” Aircraft Engineering and Aerospace Technology 81, no. 4 (July 3, 2009): 343–52. doi:10.1108/00022660910967336.
[8] Kotsiantis, S. B. “Supervised Machine Learning: A Review of Classification Techniques.” In Proceedings of the 2007 Conference on Emerging Artificial Intelligence Applications in Computer Engineering: Real Word AI Systems with Applications in eHealth, HCI, Information Retrieval and Pervasive Technologies, 3–24. Amsterdam, The Netherlands, The Netherlands: IOS Press, 2007. http://dl.acm.org/citation.cfm?id=1566770.1566773.
[9] Lee, Wenke, and Salvatore J. Stolfo. “Data Mining Approaches for Intrusion Detection.” In Proceedings of the 7th Conference on USENIX
Security Symposium - Volume 7, 6–6. SSYM’98. Berkeley, CA, USA:
USENIX Association, 1998.
http://dl.acm.org/citation.cfm?id=1267549.1267555.
[10] Lippmann, Richard, Joshua W. Haines, David J. Fried, Jonathan Korba, and Kumar Das. “The 1999 DARPA off‐Line Intrusion Detection Evaluation.” Comput. Netw. 34, no. 4 (October 2000): 579–595. doi:10.1016/S1389‐1286(00)00139‐0.
[11] Liu, Yuanning, Gang Wang, Huiling Chen, Hao Dong, Xiaodong Zhu, and Sujing Wang. “An Improved Particle Swarm Optimization for Feature Selection.” Engineering 8, no. 2 (2006): 924–28. doi:10.1109/ICCIAS.2006.294274.
[12] Malhotra, Rahul, Narinder Singh, and Yaduvir Singh. “Genetic Algorithms: Concepts, Design for Optimization of Process Controllers.”
Computer and Information Science 4, no. 2 (2011): p39. doi:10.5539/cis.v4n2p39.
[13] Portnoy, L, E Eskin, and S Stolfo. “Intrusion Detection with Unlabeled Data
Using Clustering,” 2001.
http://citeseerx.ist.psu.edu/viewdoc/summary?doi=10.1.1.13.7523.
[14] Schuh, Michael A., Rafal A. Angryk, and John Sheppard. “Evolving Kernel Functions with Particle Swarms and Genetic Programming.” In
Proceedings of the Twenty-Fifth International Florida Artificial Intelligence Research Society Conference, 2012, edited by G. Michael Youngblood and Philip M. McCarthy, 80–85. Marco Island, Florida: AAAI
Press, 2012.
http://www.aaai.org/ocs/index.php/FLAIRS/FLAIRS12/paper/view/4 479/4770.pdf.
[15] Syarif, Iwan, Adam Prugel‐Bennett, and Gary Wills. “Data Mining Approaches for Network Intrusion Detection: From Dimensionality Reduction to Misuse and Anomaly Detection.” Journal of Information Technology Review 3, no. 2 (May 2012): 70–83.
[16] Tjiong, A.S.J., and S.T. Monteiro. “Feature Selection with PSO and Kernel Methods for Hyperspectral Classification.” In 2011 IEEE Congress on Evolutionary Computation (CEC), 1762–69, 2011. doi:10.1109/CEC.2011.5949828.
[17] Williams, Nigel, Sebastian Z, and Grenville Armitage. “A Preliminary Performance Comparison of Five Machine Learning Algorithms for Practical IP Traffic Flow Classification.” Computer Communication Review 30 (2006).