COPYRIGHT AND CITATION CONSIDERATIONS FOR THIS THESIS/ DISSERTATION
o Attribution — You must give appropriate credit, provide a link to the license, and indicate if changes were made. You may do so in any reasonable manner, but not in any way that suggests the licensor endorses you or your use.
o NonCommercial — You may not use the material for commercial purposes.
o ShareAlike — If you remix, transform, or build upon the material, you must distribute your contributions under the same license as the original.
How to cite this thesis
Surname, Initial(s). (2012). Title of the thesis or dissertation (Doctoral Thesis / Master’s Dissertation). Johannesburg: University of Johannesburg. Available from:
Master’s Research Report
Evaluating Lean Implementation Success in Small and Medium
Manufacturing Enterprises
Robin Mabunda
809900890
A research project submitted to the University of Johannesburg, in
partial fulfilment of the requirements for the degree of postgraduate
degree: Master of Technology
in
Industrial Engineering
in the
Faculty of Engineering and the Built Environment
at the
UNIVERSITY OF JOHANNESBURG
SUPERVISOR: Dr Goodwell Muyengwa
i DECLARATION
I, Robin Mabunda, hereby declare that this master’s research proposal is wholly my work and has not been submitted anywhere else for academic credit either by myself or another person. I understand what plagiarism implies and declare that this proposal is my ideas, words, phrases, arguments, graphics, figures, results and organisation except where reference is explicitly made to another’s work. I understand further that any unethical academic behaviour, which includes plagiarism, is seen in a serious light by the University of Johannesburg and is punishable by disciplinary action.
ii ABSTRACT
This study investigates lean manufacturing among South African small, medium and micro (SMMEs) manufacturing enterprises based in the Gauteng Province. Lean is widely regarded as a proven productivity improvement methodology; yet, its impact on South African SMMEs remains relatively unknown. The study used a mixed method approach. Survey data was analysed using statistical methods from 32 responses received from SMMEs in various manufacturing sectors. Interviews were conducted with management and workshop employees. The results revealed that most SMMEs experienced short-term successes that did not exceed three years, implying that they failed to sustain the gains of lean manufacturing. Factors found to have a positive impact on the success and sustainability of Lean implementations were change management, adequate budget, resources with appropriate skills, senior leadership commitment, and adherence to an implementation plan. These results contribute to the lean implementation theory and can be used as a guide by lean practitioners.
iii TITLE
iv TABLE OF CONTENTS
DECLARATION ... i
TITLE... iii
LIST OF FIGURES ... viii
LIST OF TABLES ... ix
Chapter 1: Introduction to Research Problem ... 1
1.1 Introduction ... 1
1.2 Motivation for the Research ... 2
1.3 Research Aims ... 2
1.4 Report Structure ... 3
Chapter 2: Literature Review ... 4
2.1 Introduction ... 4
2.1.1 Definition of SMME ... 4
2.1.2 Contributions of SMMEs ... 8
2.1.3 Challenges facing SMMEs ... 10
2.1.4 Conclusion ... 12
2.2 Manufacturing ... 12
2.2.1 Introduction ... 12
2.2.2 Genesis of manufacturing ... 12
2.2.3 Importance of manufacturing ... 18
2.2.4 Challenges experienced by manufacturers and SMMMEs ... 21
2.2.5 Conclusion ... 24
v
2.3.1 Introduction ... 24
2.3.2 Definition of Lean Manufacturing ... 24
2.3.3 Background to Lean Manufacturing ... 29
2.3.4 Lean Manufacturing Beyond Toyota ... 34
2.3.5 Benefits of Lean Manufacturing ... 35
2.3.6 Challenges experienced when implementing Lean Manufacturing ... 39
2.4 Conclusion ... 46
Chapter 3: Research Problem Statement ... 48
3.1 Research Question ... 48
3.2 Research Objectives ... 48
3.3 Research Hypotheses ... 49
Chapter 4: Research Methodology ... 50
4.1 Introduction ... 50
4.2 Research Method ... 50
4.3 Sampling ... 51
4.4 Pilot study ... 55
4.5 Data Collection Method ... 55
4.6 Data Analysis ... 56
4.7 Limitations ... 57
4.8 Conclusion ... 57
Chapter 5: Quantitative Results ... 58
5.1 Introduction ... 58
vi
5.3 Section B: Planning and Change Management Phase ... 64
5.4 Section C: Lean Manufacturing Implementation Phase ... 69
5.5 Section D: Lean Manufacturing Assessment ... 74
5.6 Research Question and Sub-question 1 ... 77
5.7 Research Sub-question 2 ... 80
5.8 Research Sub-question 3 ... 82
5.9 Conclusion ... 84
Chapter 6: Qualitative Results ... 85
6.1 Introduction ... 85
6.2 Section A: Organisational Profile ... 85
6.3 Research Question and Sub-question 1 ... 87
6.4 Research Sub-question 2 ... 91
6.5 Research Sub-question 3 ... 96
6.6 Conclusion ... 102
Chapter 7: Discussion of Results ... 103
7.1 Introduction ... 103
7.2 Research Question and Sub-question 1 ... 103
7.3 Research Sub-question 2 ... 103 7.4 Research Sub-question 3 ... 104 7.5 Hypotheses Testing ... 105 7.6 Conclusion ... 108 Chapter 8: Conclusion ... 109 8.1 Introduction ... 109
vii
8.2 Success Rate ... 109
8.3 Factors that Influence a Lean Implementation Outcome ... 110
8.3.1 Senior leadership commitment ... 110
8.3.2 Adequate budget ... 111
8.3.3 Internal lean skills/expertise ... 113
8.3.4 Shop-floor Buy-in ... 114
8.3.5 Change management ... 115
8.3.6 Pace of implementation ... 116
8.4 Future Research Ideas ... 116
8.5 Conclusion ... 117
LIST OF REFERENCES ... 118
viii LIST OF FIGURES
Figure 1.1: South Africa GDP Growth Rate ... 1
Figure 2.1: Employment Comparisons ... 9
Figure 2.2: TPS/Lean Model ... 30
Figure 2.3: Assembly Plant Productivity ... 37
Figure 5.1: Productivity Improvement Comparison ... 78
Figure 5.2: Company Size vs Success Rate ... 79
Figure 5.3: Skills & Expertise of Resources ... 79
Figure 5.4: Impact of Internal Skills Capability on Success Rate ... 80
Figure 5.5: Change Management vs Success Rate ... 81
Figure 5.6: Budget vs Success Rate ... 82
Figure 5.7: Sustainability in Relation to Size of the Organisation ... 83
Figure 5.8: Sustainability in Relation to Change Management... 83
Figure 5.9: Sustainability in Relation to Adherence to Planned Activities... 84
ix LIST OF TABLES
Table 2.1: Application of Qualitative Indicators ... 5
Table 2.2:Breakdown of formal SMME contribution to the UK economy ... 8
Table 2.3: SMME economic contributions in South Africa ... 8
Table 2.4: Four Centuries of Manufacturing Leading to 21st Century Manufacturing ... 13
Table 2.5: Global Manufacturing Employment Contribution as a Share of GDP ... 19
Table 2.6: South African manufacturing employment contribution as a share of GDP ... 19
Table 2.7: International comparisons of manufacturing output... 21
Table 2.8: Top 20 ranking of manufacturing output ... 23
Table 2.9: Eight Wastes of Lean Manufacturing ... 26
Table 2.10: Characteristics of production systems... 29
Table 2.11: Lean implementation method and time period ... 33
Table 2.12: Plant performance comparison, 1987 ... 35
Table 2.13: Plant performance comparison, 1987 ... 36
Table 2.14: Abbreviations ... 37
Table 2.15: Benefits of implementing Lean ... 38
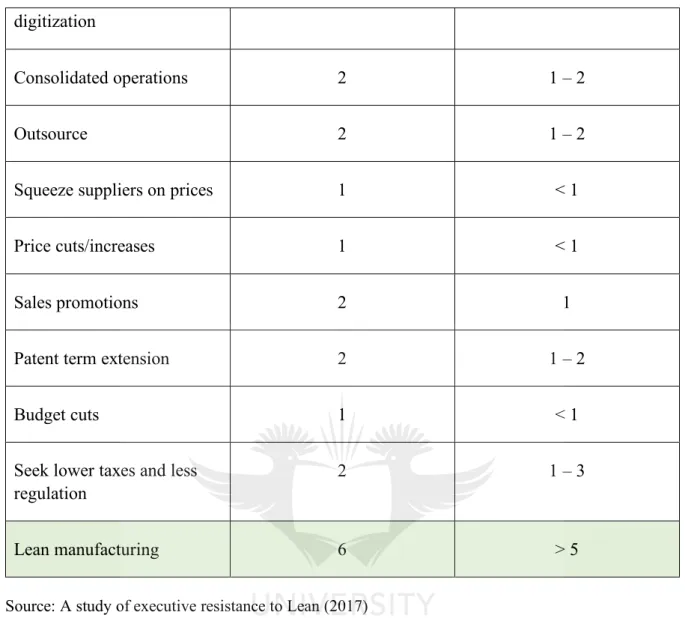
Table 2.16: Business Improvement approaches available for senior management ... 41
Table 2.17: Barriers and enablers of Lean sustainability ... 42
Table 4.1: SMMEs by Province ... 52
Table 4.2: Breakdown of Sample Sub-sector ... 53
Table 5.1: Organisational Age... 58
x
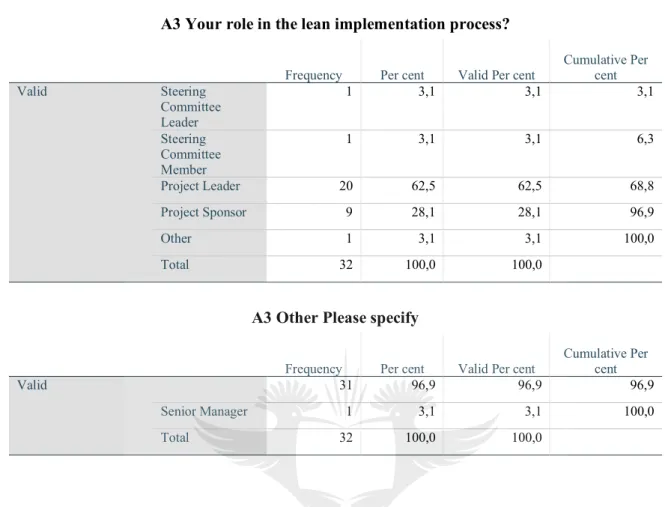
Table 5.3: Role in the Organisation ... 60
Table 5.4: Period in Operation ... 61
Table 5.5: Geographical Spread in Gauteng ... 61
Table 5.6: Organisation’s Main Products ... 62
Table 5.7: Number of Employees ... 63
Table 5.8: Lean Approach Used by Respondents’ Company... 63
Table 5.9: Length of Lean Implementation per Responding Company ... 64
Table 5.10: Aims of Implementing Lean ... 65
Table 5.11: Commitment to Change Management ... 66
Table 5.12: Change Management and Lean Implementation Plans Prior to Implementation67 Table 5.13: Skills Availability ... 68
Table 5.14: Budget Availability Prior to Implementation ... 69
Table 5.15: Budget Availability During Lean Implementation ... 69
Table 5.16: Lean Tools and Techniques on Which the Organisation was Trained ... 71
Table 5.17: Lean Tools and Techniques Frequency of Use ... 72
Table 5.18: Organisation’s Approach to Implementing Lean... 74
Table 5.19: Lean Implementation Governance Structure and Review... 75
Table 5.20: Lean Implementation Against Plan ... 76
Table 5.21: Lean Implementation Outcomes ... 77
Table 6.1: Organisational Profile ... 86
Table 6.2: Lean Implementation Aims ... 88
xi
Table 6.4: Lean Implementation Preparation Phase ... 92
Table 6.5: Lean Implementation Sustainability ... 97
Table 6.6: Lean Implementation Sustaining Mechanisms ... 98
Table 6.7: Lean Implementation Key Learnings ... 100
Table 7.1: Normality Tests – Chi-Square Tests ... 105
Table 7.2: Normality Tests – Shapiro-Wilk Test ... 106
1 Chapter 1: Introduction to Research Problem
1.1 Introduction
The South African economy has since the 2008 global economic downturn struggled to reach a Gross Domestic Product (GDP) growth target of 6% (Trading Economics, 2018).
Figure 1.1: South Africa GDP Growth Rate
Source: Trading Economics (2018)
The inability of the South African economy to reach the targeted GDP level of 6% has had negative societal consequences resulting in high unemployment, poverty and inequality. According to Amra, Hlatshwayo and McMillan (2013), small, medium and micro enterprises (SMMEs) are globally credited for being the main driver of equitable economic and industrial development. South Africa has relatively low levels of entrepreneurship with SMMEs accounting for only 55% of employment compared to 90% in China, India and Indonesia (Lekhanya, 2015).
To become competitive, companies have looked at means of improving their manufacturing processes by introducing systems (Moorthi, 2008). These systems include six sigma, lean manufacturing, theory of constraints and process re-engineering. Of all manufacturing improvement systems, Lean has been credited for dramatically increasing productivity in
-2% -1% 0% 1% 2% 3% 4% 5% 2008 2009 2010 2011 2012 2013 2014 2015 2016 2017
2
companies that have implemented it (Rothenberg & Cost, 2004). Through Lean, continuous reduction of waste becomes the central focus, rather than a series of once-off initiatives (Christodoulou, 2008).
1.2 Motivation for the Research
South Africa is facing an uncertain economic outlook over the next few years, and improving productivity amongst SMMEs will play a key role in ensuring SMME competitiveness. As SMMEs continue to face challenges in remaining profitable during periods of economic difficulty, some have adopted productivity improvement methodologies as a strategy for improving competitiveness. SMMEs have used Lean over the past decade with the aim to improve productivity (Productivity SA, 2016).
There appears to be a significantly lower uptake of Lean in small and medium enterprises (SMEs) when compared to larger enterprises, and most SMEs are still unfamiliar with Lean (Hu, 2015). Research indicates that this is due to many factors that will be further explored and examined in this research study. While there have been several studies that have addressed Lean implementations in general (Coetzee, Van der Merwe & Van Dyk, 2016; Pitout, 2006; Vyas, 2011), many focus on large enterprises rather than SMEs. Very few studies focus on Lean implementation in SMEs and rare research studies focus on Lean implementations in South African based SMMEs. This study focuses on contributing to filling this gap by conducting a systematic study into Lean implementations in South African based SMMEs.
1.3 Research Aims
This research aims to establish the success rate of Lean implementations in small, medium and micro-manufacturing enterprises (SMMMEs) based in South Africa. The research further aims to identify factors that influence a Lean implementation outcome and the sustainability rate of Lean implementations. The research intends to identify multiple SMEs that have implemented Lean in South Africa as their means to productivity improvement, analyse the success rate of these implementations, and further understand factors that influence the outcome and the sustainability rate of these implementations.
3 1.4 Report Structure
Chapter 1 discusses the current environment that South African SMMEs face and provides the motivation for the implementation of Lean manufacturing as a solution to driving productivity and sustainability.
Chapter 2 reviews the literature on the concept of productivity as it relates to Lean manufacturing and SMMEs in South Africa. It further outlines the views of those involved in implementations and focuses on factors that drive successful Lean implementations.
Chapter 3 focuses on the research questions that this research study aims to address.
Chapter 4 outlines the research methodology and criteria applied in the selection of the population and sample, covers the collection of the data and discusses the analysis approach of the data.
Chapter 5 presents the data collected. The data is offered in a categorised, consolidated format based on the themes that emerged from the survey questionnaire.
Chapter 6 presents the data collected. The data is offered in a categorised, consolidated format based on the themes that emerged from interviews.
Chapter 7 details the results of the research as it relates to the research questions and to the literature reviewed.
Chapter 8 articulates the merits of this research and provides recommendations for the effective implementation of Lean in SMMMEs based in South Africa.
4 Chapter 2: Literature Review
2.1 Introduction
South African manufacturing-based small, medium and micro enterprises (SMMEs) have in the last few years embraced and implemented lean manufacturing as a key manufacturing and management approach to improving productivity and managing competition. Little is known about the success rate of these implementations and overall impact on the economy. With this background, it is imperative to understand the characteristics of both lean and South African small, medium and micro-manufacturing enterprises (SMMMEs). This chapter provides an outline into the body of knowledge currently available on SMMEs and Lean.
2.1.1 Definition of SMME
A single, uniformly accepted global definition for SMME does not exist (Altenburg & Eckhardt, 2006). Different countries or economic regions tend to develop their own definitions based on a widely accepted practice that a definition of SMME comprises some or all of the following three parameters namely:
1. number of employees; 2. annual turnover; and 3. asset value
Though the above are generally accepted parameters for defining SMMEs, Le Fleur et al. (2014) argued that SMME definitions are broadly categorised into “economic” and “statistical”. The economic definition considers three criteria that a business has to meet, namely:
1. size of market share;
2. management by owners or part owners; and
3. is independent (i.e. not part of a larger enterprise or group of companies)
As opposed to the economic definition of SMMEs, the statistical definition considers the following three criteria:
1. size of the business and its contribution to GDP, employment and exports; 2. extent to which the business sector’s economic contribution has changed
5
3. cross country comparison of the business’ economic contribution.
The United Nations Industrial Development Organisation (UNIDO) generally advises countries to consider quantitative and qualitative indicators for SME definition (Dababneh & Tukan, 2007). Table 1 below, summarises the main qualitative indicators that could be used to differentiate between SMEs and large businesses.
Table 2.1: Application of Qualitative Indicators
Category SMEs Large Businesses
Management § Proprietor-entrepreneurship § Functions linked to personalities § Manager-entrepreneurship § Division of labour by subject matters
Personnel § Lack of university
graduates § All-round knowledge § Dominance of university graduates § Specialisation
Organisation § Highly personalised
contacts § Highly formalised communication Sales § Competitive position undefined and uncertain § Strong competitive position
Buyer’s Relationships § Unstable § Based on long-term
contracts
Production § Labour intensive § Capital intensive
economies of scale
Research Development § Following the
market, intuitive approach
§ Institutionalised
Finance § Role of family
funds, self-financing
§ Diversified
6
Category SMEs Large Businesses
access to the
anonymous capital market
Source: UNIDO (2005)
Furthermore, the Asian Pacific Economic Cooperation’s (APEC) most preferred criterion used within the economies of APEC is the number of employees within the business itself. APEC, therefore, defines SMEs as enterprises with less than one hundred people, where a medium-sized enterprise employs between twenty and ninety-nine people, a small firm employs between five and nineteen, and a micro firm employs less than five employees, which includes self-employed managers (Dababneh, 2007).
It is important to clarify that, the SME abbreviation is commonly accepted and used by many countries such as South Africa, Australia and European Union Member States, and internal organisations such as the United Nations and the World Bank. What is found to differ is the SMME abbreviation. Some countries such as Kenya and India have adopted the MSME abbreviation, standing for Micro, Small and Medium Enterprises (Ministry of Law and Justice, 2006). Other countries such as South Africa have adopted the SMME abbreviation, standing for Small, Medium and Micro Enterprises. Other countries such as New Zealand and the United States of America tend to use the SME abbreviation for Small and Medium Enterprises, and SOHO abbreviation for Small Office/Home Office or Single Office/Home Office (Ward, 2018). SOHOs are the equivalent of what other countries call micro enterprises and employ less than five (5) employees. Below are SMME definitions from an economic block and two countries:
European Union
According to US AID SME definition booklet (Dababneh, 2007), the European Union defines small and medium-sized enterprises as companies with less than 250 employees. The categories are as follows:
7
• Small enterprises: 10 – 49 employees; Turnover: <$13 million; Assets: <$13 million
• Medium enterprises: 50 – 249 employees; Turnover: <$67 million; Assets: <$56 million
• Large enterprises: 250 employees; Turnover: >$67 million; Assets: >$56 million
Australia
In Australia, the Australian Bureau of Statistics (www.abs.gov.au, 2001) defines small and medium-sized enterprises as companies with less than 200 employees. The categories are as follows:
• Microenterprises: 1 – 4 employees
• Small enterprises: 5 – 19 employees
• Medium enterprises: 20 – 199 employees
• Large enterprises: 200 employees or more South Africa
In South Africa, the National Small Enterprise Act (SA Government Paper No. 102, 1996) defines SMME categories as follows:
• Microenterprises: 1 – 5 employees; Turnover: <R200 000; Assets: R100 000
• Very small enterprises: 6 – 20 employees; Turnover: <R6 million; Assets: R2 million
• Small enterprises: 21 – 49 employees; Turnover: <R32 million; Assets: <R6 million
• Medium enterprises: 50 – 200 employees; Turnover: <R64 million; Assets: <R23 million
• Large enterprises: 200 employees; Turnover: >R64 million; Assets: >R23 million
It is important to note that, due to the targeted research focus on South African based SMMMEs, the researcher will use the South African definition of SMMEs as the general definition of SMMEs in this research study.
8 2.1.2 Contributions of SMMEs
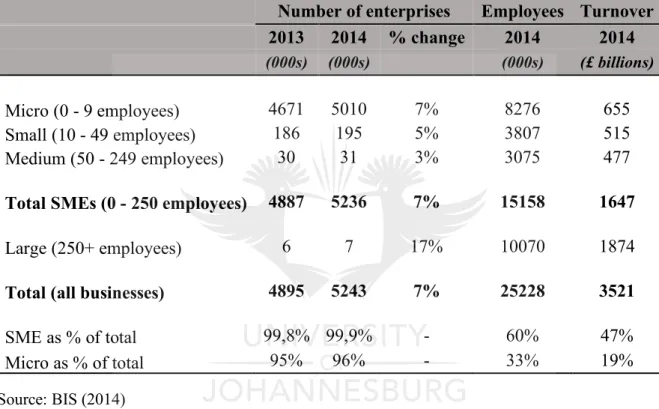
SMMEs are globally credited for being the main driver of equitable economic and industrial development. As of 2013, the United Kingdom (UK) had 4.9 million businesses of which 99% were SMEs (Ward & Rhodes, 2014). The European Commission’s SME performance review estimates the gross value added of SMEs at 49.8% of the UK economy. Table 2.2 breaks down the contribution of UK-based SMEs for 2013 to 2014 period into further detail.
Table 2.2:Breakdown of formal SMME contribution to the UK economy
Number of enterprises Employees Turnover
2013 2014 % change 2014 2014 (000s) (000s) (000s) (£ billions) Micro (0 - 9 employees) 4671 5010 7% 8276 655 Small (10 - 49 employees) 186 195 5% 3807 515 Medium (50 - 249 employees) 30 31 3% 3075 477
Total SMEs (0 - 250 employees) 4887 5236 7% 15158 1647
Large (250+ employees) 6 7 17% 10070 1874
Total (all businesses) 4895 5243 7% 25228 3521
SME as % of total 99,8% 99,9% - 60% 47%
Micro as % of total 95% 96% - 33% 19%
Source: BIS (2014)
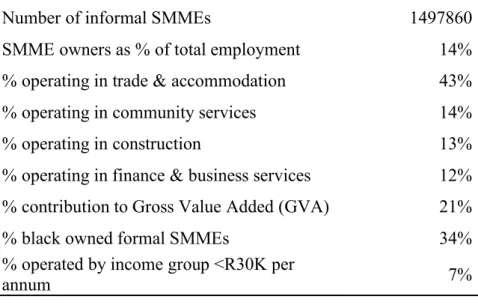
According to Altenburg & Eckhardt (2006), SMMEs play a critical role in overall economic development which, on average, make up for over 90% of enterprises in the world and account for 50% to 60% of employment – particularly in the developing world. In South Africa, the statistics indicate that SMME GDP and employment impact is marginal when compared with UK stats. Table 2.3 summarises SMME contributions to the South African economy taken from Stats SA (2015).
Table 2.3: SMME economic contributions in South Africa
KEY INDICATORS 2015 (Q2)
Number of SMMEs 2251821
9
Number of informal SMMEs 1497860
SMME owners as % of total employment 14%
% operating in trade & accommodation 43%
% operating in community services 14%
% operating in construction 13%
% operating in finance & business services 12%
% contribution to Gross Value Added (GVA) 21%
% black owned formal SMMEs 34%
% operated by income group <R30K per
annum 7%
Source: Stats SA (2015)
The most commonly used metrics for SMME contribution to the economy tend to fall into two categories (Amra, 2013), namely employment contribution and GDP contribution. Figure 2.1 summarises SMME employment comparisons between South Africa, the UK and the rest of the world.
Figure 2.1: Employment Comparisons
The above graph clearly highlights the scope of opportunities available to assist South Africa to deal with the employment challenges it experiences.
0% 10% 20% 30% 40% 50% 60% 70%
South Africa United Kingdom Global Average
10 2.1.3 Challenges facing SMMEs
Extensive international studies that include the works of Muhammad et al. (2010), the OECD (2014), and Yoshino and Taghizadeh-Hesary (2016) summarise the following key challenges facing SMMEs:
1. Difficulty in accessing finance – Given the macro-economic risks linked to the economic downturn and South African banks’ highly conservative nature, lenders are more inclined to grant financing to profitable large companies as opposed to start-ups and SMMEs (Fuchs et al., 2011). Working capital issues due to payment factors with customers and lack of finance for whatever reason from financial institutions tend to stifle growth and ultimately, leads to the demise of the business.
2. Low level of business Research & Development (R & D) – R & D refers to a process of investigating and analysing ways of improving one’s products or processes. R & D is key in staying ahead of the competition. Most countries measure the R & D ratio, which is R & D annual spent as a percentage of annual turnover. R & D is low in Africa and Asian countries. According to Yoshin and Taghizadeh-Hesary (2016), Japan’s average R & D ratio was 5% in 2013. The low R & D ratio is normally attributed as one of the key reasons for slow economic growth and failures of SMMEs. 3. Insufficient use of information technology – The world has experienced a
rapid boom in:
a. affordable IT hardware (in the form of desktops, laptops, mobile phones and tablet computers);
b. affordable IT software (in the form of open source technology that includes Joomla, WordPress, and cloud technology); c. affordable IT resources for support;
d. social media access and usage; and
e. affordable fast internet connectivity (e.g. internet fibre).
Even with all the affordable information technology, there are many SMMEs that do not sufficiently use such opportunities. Many SMMEs do not have websites (for e-commerce utilisation) or mobile payment solutions.
11
4. Low productivity – Productivity refers to the effective utilisation of resources to produce outputs. According to Kreuser & Newman (2018), some sectors of the South African economy are improving their productivity levels but SMMMEs continue to struggle with low productivity. A correlation between productivity and R & D was also observed (i.e. when R & D was low or non-existent, productivity was low, and vice-versa). 5. Government bureaucracy and regulation – Government bureaucracy and
regulation refers to elements that include the process of applying for government grants or assistance (with the potential to result in extensive delays and delays in acquiring permits or licenses).
6. Access to market (both domestic and international markets) – As in Brazil (White, 2005), large businesses tend to dominate economic performance in South Africa. This is largely attributed to the sanctions experienced by the country that forced the country to develop certain industries for self-sufficiency. This historical element and its impact can largely be seen when observing export trends; South African exports are largely dominated by large businesses.
7. Lack of managerial capability – Most SMMEs are typically founded by technical specialists; individuals that do not necessarily have managerial experience or full appreciation of managerial skills. If good management skills are not brought into an SMME, most tend to close shop after a few years or soon after the founder departs the business.
Though the above challenges can also be found in South African SMMMEs as indicated by Berry et al. (2002) and Fuchs et al. (2011), there are some historical aspects that add to the challenges (Le Fleur et al., 2014; SEDA SME Sector study, 2016). These historical challenges include:
1. High levels of crime – According to the SEDA SME Sector study (2016), South Africa’s high level of crime is a pervasive problem. It was found that in 2015, South African SMMEs were forced by the security situation to increase spending on security, which then had a ripple effect on the overall cost of doing business.
2. Onerous labour laws – According to the SEDA SME Sector study (2016), South Africa’s labour laws are a significant regulatory obstacle to business
12
growth, particularly when it comes to employee dismissal. SMME owners have found that once they have employed workers, the law makes it difficult to lay the workers off if the business can no longer afford to keep them or if they prove to be unproductive.
3. Poor Infrastructure and service provision – South Africa still suffers from an inadequate public transport system, congested roads, shortages in available operating space and service connectivity gaps (e.g. internet connectivity problem, water and electricity accessibility). Because of these issues, workers who use public transport tend to arrive late or do not pitch at all to work due to transport non-availability at times, resulting in low productivity.
4. Apartheid legacy – South Africa’s history is such that, economic and educational empowerment was done according to racial profiling, limiting empowerment to less than 10% of the population while undersupplying the rest of the population. According to Berry et al. (2002), low levels of education and training among 90% of the population prior to 1994 have perpetuated suppression of entrepreneurial activities.
2.1.4 Conclusion
The significance of SMMEs regarding GDP and employment contribution to an economy is the bases why the researcher selected SMMEs for this research study.
2.2 Manufacturing 2.2.1 Introduction
This section focuses on the significance and context of manufacturing. Not all SMMEs are manufacturers and the researcher will establish the link between manufacturing and SMMEs.
2.2.2 Genesis of manufacturing
The word manufacturing has Latin roots; manu, meaning by hand, joined with facere, meaning to make (Wright, 2001). Manufacturing can be best thought of as the making of articles/goods by physical labour or machinery. For centuries, manufacturing was done by physical labour, in which a person with hand tools used craft skills to make objects. Ayres and Miller (1983) further defined manufacturing as the “confluence of the supply elements (such as the new
13
computer technologies) and the demand elements (the customer requirements of delivery, quality, and variety)”. Manufacturing in today’s world typically comprise machines, robots, computers and humans that all work in a specific way to create a product (Markus, 2017).
The above manufacturing approach, considering modern-day manufacturing, has its roots in the Industrial Revolution period of 1770 to 1820 (Schonberger, 1982). The Industrial Revolution was a transitional period from an old manufacturing approach that was primarily family/artisan-orientated where most families/artisans worked from their farms or homes producing goods using their hands and/or hand tools to a bigger scale of producing goods using machines. Historians have argued but failed to pinpoint a single reason for this revolution (Plumb, 1965; Wood, 1963). Most historians agree that the revolution was spurred by a combination of technological, economic, and political factors that are as follows (Wright, 2001):
1. A rapid increase in the daily health and living conditions of people; 2. Access to large markets, not only in England but across the globe;
3. A long period of social and political stability in Britain that provided the stage for a more entrepreneurial mood in business and commerce;
4. New techniques in banking and the handling of credit;
5. Many successive years of successful commerce, which caused capital to accumulate and interest rates to fall; and
6. James Watt’s improved engine designs that made steam power usable by the industry.
A key feature of the Industrial Revolution was a shift from water to steam engine technology as a way to power production facilities. The history of modern-day manufacturing in South Africa can be traced to the early 1920s. Prior to that period, South Africa’s economy was primarily focused on mining and agriculture, relying on imports from other countries for equipment inputs (Baker Baynes, 2017). Table 2.4 outlines four hundred years of global manufacturing development leading to the 21st century.
Table 2.4: Four Centuries of Manufacturing Leading to 21st Century Manufacturing
14 Early 18th
Century 19
th Century 20th Century 21st Century
• A person with an anvil and hammer • Poorly understood process • Craftspeopl e • Cottage industry • Steam-powered machinery • Improved understandin g of processes • Factory conditions in cities • Computer-aided design, planning and manufacturin g • Limited processes models using closed-loop control • Increased factory automation • System-wide networks and information • Robust processes and intelligent control • Global enterprises and virtual manufacturin g corporations Source: Schonberger (1982
A modern-day manufacturing business typically falls under one of the following three categories (Markus, 2017):
1. Make-to-stock – Historical sales data is used to forecast future demand and plan the production activity in advance. Lead times tend to be shorter with make-to-stock manufacturing.
2. Make-to-order – The production process only starts after the order is received. Lead times tend to be longer when compared with make-to-stock, but the risk of excess inventory is eliminated.
3. Make-to-assemble – A strategy that relies on demand forecasts to stock the basic components of a product but starts assembling them after the order is received. It is a hybrid of MTS and MTO approaches.
The above definitions and background of manufacturing address one part of how to look at manufacturing. Roser (2016) calls this “how you produce something”. Roser argued that beyond being concerned with how to produce something, one should also be concerned with
15
how items can be produced faster, better and cheaper. It is this latter view of manufacturing that delves into the concepts of the division of labour, Taylorism and Fordism.
2.2.2.1 Division of labour
The division of labour structures work through separation of tasks in a system so that participants can specialise (Silvermintz, 2010). Individuals are trained in specialised skills or trade to take advantage of the capabilities of others in addition to their own. The primary characteristic of the division of labour is specialisation and the separation of tasks.
Division of labour is generally traced back to Plato’s time (from 427BCE to 347BCE). Plato argued for the division of labour in his Socratic dialogue book titled The Republic. The Republic focuses on the topic of justice (i.e. a just man or justice in a city-state). Silvermintz (2010), however, argued that although Plato recognised both the economic and political benefits of the division of labour, he ultimately critiques this form of economic arrangement, as it hinders the individual from ordering his own soul by cultivating acquisitive motives over prudence and reason. It is worthwhile noting that Plato’s understanding of division of labour was to a degree influenced by Socrates’ reference of Cephalus’ armament factory, which was considered the only mass production operation of its kind in the ancient world (Glotz, 1926). It is generally accepted that Cephalus applied division of labour in his armament factory.
Other figures such as Duhamel du Monceau (1761), Graunt (1899), and Xenophon (Ambler, 2001) went on further to expand through their writings the division of labour concept. Smith (1776) further elaborated on the division of labour emphasising its quantitative importance on productivity improvement and adding a contradiction that sought to highlight the negative consequences of the division of labour, which ultimately focused on inadequate skilling of workers. Just like Smith, many individuals, including Karl Marx and Henry David Thoreau, that have criticised the effects of the division of labour on worker capabilities in relation to societal needs. Debates about the division of labour have continued to date with organisations, and more specifically, with management left to design division of labour in their organisations.
2.2.2.2 Taylorism
Taylorism, also referred to as scientific management, is a term widely used to describe a theory of operations management that analyses the way work is done with an objective of optimising worker productivity. The Taylorism term is taken from the founder of scientific management, Frederick Winslow Taylor. Much of Taylor’s work was based on his factory experiences in the
16
period 1895 – 1911 working as a mechanical engineer, first at Midvale Steel Company and later at Bethlehem Steel Corporation (Hoffman, 2009).
Though Taylor is credited mainly for his work in establishing scientific management, he had two prior successes that are noteworthy (Wright, 2001):
1. He co-invented, together with Maunsel White, high-speed steel cutting tools that allowed a four times increase in cutting speed in the basic production processes of turning, drilling and milling.
2. He carefully analysed individual manufacturing processes such as metal machining and tried to bring them under closer control. The Taylor equation that relates cutting speed to tool life is still used today.
When Taylor turned his attention to factory organisation, he was concerned with understanding worker behaviour and how that could be addressed to improve labour productivity. The goal was to shorten each sub-task and get the overall task done more quickly. According to Taylor, people have a natural tendency to loaf. He called this human instinct to loaf, soldiering. Taylor embarked on experiments that ultimately produced an approach titled Scientific Management, published in 1910 (Taylor, 1910).
In Scientific Management, Taylor concluded that the duties of managers and workers would need to change considerably when compared to management approaches of pre-scientific management. Based on his understanding of worker behaviour, he grouped the duties of management into the following principles (Taylor, 1910):
1. Develop a science for each element of a person’s work, which replaces the old rule-of-thumb method;
2. Scientifically select and then train, teach, and develop each worker, whereas, in the past, workers chose their own work and trained themselves as best they could;
3. Heartily cooperate with the workers to ensure all of the scientifically developed methods are being followed; and
4. There should be an almost equal division of work and a responsibility between management and workers. Management takes over all the work for which they are better fitted than the
17
worker, while in the past, almost all of the work and the greater part of the responsibility were thrown upon the workers.
Though Taylorism is credited with productivity improvements, there were drawbacks that led to its decline, these include:
1. monotonous work; 2. lack of autonomy;
3. labour union un-comfortability with time studies; and 4. grievances around worker pay
2.2.2.3 Fordism
Fordism is a term widely used to describe a manufacturing approach that led to the initial success of the Ford Motor Company. Though the Ford Company started producing cars in 1903, it was only in 1908 that Fordism came into being with the introduction of the Model T car (Doray, 1988). Fordism is designed to produce low-cost standardised products through a decently paid workforce that can also afford to buy the goods they are producing. Fordism expanded the division of labour principles and brought about maximum labour flexibility and adaptability to the manufacturing of goods.
A manufacturing plant that embraces Fordism would typically comprise of the following characteristics:
1. establishment of assembly lines;
2. standardisation of products to high tolerance; 3. high mechanisation or automation;
4. low emphasis on skills due to high mechanisation or automation; and 5. worker pay is significantly high (when compared to the industry
norm).
It is normally argued that Fordism is a combination of the division of labour and Taylorism with a unique Ford contribution of moving assembly lines. Though Fordism came into being a few years after Taylorism, there are general disagreements on whether Ford’s work was borrowed from Taylorism. Even with these disagreements on influence, Taylorism and Fordism are greatly credited with productivity improvements at the beginning of the 20th century. Hoffman (2009) noted that due to the influence of Fordism and Taylorism between
18
1919 – 1929, industrial output in the United States doubled as the number of industrial workers decreased.
It is also noted that even with the recorded successes of Fordism, draw-backs were experienced and these largely led to a decline in Fordism’s influence. These drawbacks include:
1. labour unions’ influence on worker productivity; and
2. production equipment and processes being vulnerable to worker sabotage.
2.2.3 Importance of manufacturing
In the nature of the manufacturing process, manufacturing businesses tend to be labour intensive and tend to hire more workers when measured as a ratio of turnover compared with non-manufacturing businesses. Similar to SMMEs, the most commonly used metrics for manufacturing contribution to the economy tend to fall into two categories:
1. employment contribution; and 2. GDP contribution
2.2.3.1 Manufacturing Employment Contribution
According to Mavlutova, Lesinskis and Olevskis (2017), employment is a multifaceted socio-economic phenomenon having a content, form, structure and organisation. According to the International Labour Organization resolution 7 (ILO, 2013), persons in employment are defined as all those of working age (i.e. 15 and older) who, during a short reference period, were involved in any activity of providing services or the production of goods for profit or pay. They comprise:
1. Employed persons “at work” (i.e. who worked for at least one hour);
2. Employed persons “not at work” due to temporary absence from a job, or to working-time arrangements (e.g. shift work, flexitime and compensatory leave for overtime); and 3. Self-employed (i.e. those whose remuneration depends
directly on the expectation of profits derived from the goods and services produced and engage one or more persons to work for them as ‘employees’ continuously.
19
Mavlutova et al. (2017) noted that the manufacturing sector contributes significantly to global employment. The global number of people employed in the manufacturing industry increased by 43.4% in 2010 when compared to 1970 (refer to Table 2.5).
Table 2.5: Global Manufacturing Employment Contribution as a Share of GDP
Ranking (2010)
Country
The share of employment in the world Growth rate
1970 1990 2010 2010/1970 1 China 10,13 23,53 34,34 484,5 2 United States 13,03 9,71 6,36 69,8 3 India 3,4 3,98 5,88 251,1 4 Russia (USSR) 19,41 16,83 3,9 - 5 Brazil 1,48 2,32 3,84 366,7 6 Japan 7,79 6,2 3,63 67 7 Germany (FRG) 5,87 3,95 3,1 - 8 Bangladesh 0,15 0,57 2,53 2550 9 Vietnam 0,03 0,12 2,2 - 10 Indonesia 0,35 1,47 2,11 840
Number of employees in the
world (millions of people) 139,7 180,3 200,3 143,4
Source: UNIDO (2013)
In South Africa, however, manufacturing employment figures, as a percentage of total employment, was ranked 4th. Table 2.6 provides the employment breakdown per industry.
Table 2.6: South African manufacturing employment contribution as a share of GDP
Industry Dec 2014 ('000) Dec 2015 ('000) YoY Change (%)
Community and social services 3501 3624 3,5%
Trade 3247 3280 1%
Finance and other business
20 Manufacturing 1749 1738 -0,6% Construction 1334 1438 7,8% Private households 1219 1294 6,2% Transport 952 900 -5,4% Agriculture 742 860 16% Mining 427 483 13,1% Utilities 104 123 19,1% Total 15314 16013 4,6% Source: Stats SA (2016) 2.2.3.2 Manufacturing GDP Contribution
Kuznets (1966) set out to define six characteristics of modern economic growth in his Nobel memorial lecture in 1971. With a limited amount of quantitative information concerning growth before the mid-nineteenth century, Kuznets described long-term development patterns of countries based on empirical analyses of national accounts. He argued that industrialisation or increases in the share of manufacturing in GDP are a key feature of modern economic growth, which is markedly different from the pre-industrial revolution period which had lower growth rate.
It is also important to note Kaldor’s examination of the relationship between industrial development and economic growth. Based on empirical results, he characterised the manufacturing sector as “the main engine of fast growth” (Haraguchi, 2015). This was found to be true for the 12 early industrialisers from the UK to Japan, and is also characteristic of catching-up countries that have experienced rapid, sustained growth.
Haraguchi (2015) argued that despite recent assertions of shrinking opportunities for manufacturing development in developing countries and a decrease in the importance of manufacturing for their economic development, there is no evidence to support that there is a manufacturing shrinkage. It is further noted that even after 1990, the manufacturing sector in developing countries still meets the conditions to be described as a driver of economic development, especially to achieve high sustained growth while retaining at least the same size in GDP and total employment as in the period from 1970 to 1990.
21
Rodseth (2016) noted that over the last 40 years, the South African GDP growth has mirrored manufacturing growth. Rodseth argued that the direct relationship between the two indicates the opportunity for manufacturing to become an engine rather than a mirror of GDP growth. In line with Rodseth’s thinking, the Roosevelt Institute (2011) highlighted that manufacturing is fundamental to any economy with global trade being based on goods, not services. They argue that services are mostly the act of using manufactured goods, with 80% of world trade among regions being merchandise trade.
Langdon and Lehrman (2012) emphasised that beyond employment and GDP contributions, manufacturing businesses lead other non-manufacturing businesses on innovation, especially in the US. They attribute manufacturing’s innovation contribution to its consistent investment to corporate R & D.
2.2.4 Challenges experienced by manufacturers and SMMMEs
Global manufacturing trends of the past 56 years indicate that even though the manufacturing output value for some countries (provided in Table 2.7) has increased between 1960 and 2016, some countries, including South Africa, have experienced a sharp decline in the manufacturing sector (World Bank, 2016). It is this decline in the South African manufacturing output that motivated the researcher to add the manufacturing dynamic in this study. The following table provides international comparisons of manufacturing output in US dollar terms and GDP contribution. It is evident from Table 2.7 that South Africa lags considerably when compared to its peers such as Turkey, Singapore and Malaysia.
Table 2.7: International comparisons of manufacturing output
Manufacturing Output ($ Billion) Manufacturing Output (% of GDP)
Country 1960 2016 Country 1960 2016 Or Bangladesh 0.226 37 Bangladesh 5 18 Brazil 3.85 181.8 Brazil 30 12 France 13.8 250.8 France - 11 India 5.6 336.6 India 16 17 Malaysia 0.197 66.02 Malaysia 10 22 Singapore 0.074 54.5 Singapore 11 20
South Africa 1.46 35.17 South Africa 20 13
22
United Kingdom - 238.98 United Kingdom - 10
Portugal - 24.8 Portugal - 14
Nigeria - 35.12 Nigeria - 9
Russia - 158.6 Russia - 14
- : No data available for that particular year
Source: World Bank (2016)
World Bank global ranking trends indicate that manufacturing output is still dominated by developed countries. Table 2.8 provides a list of the top 20 countries with the highest manufacturing output in US dollar terms.
23 Table 2.8: Top 20 ranking of manufacturing output
Rank Country/Region Manufacturing
Output ($ Million) Year
1 China 3,590,977.69 2017 2 Germany 759,904.17 2017 3 South Korea 422,064.51 2017 4 India 392,346.17 2017 5 Italy 284,296.97 2017 6 France 261,830.83 2017 7 United Kingdom 241,354.41 2017 8 Brazil 208,734.94 2017 9 Indonesia 204,726.20 2017 10 Mexico 198,452.70 2017 11 Russian Federation 188,013.13 2017 12 Spain 171,316.70 2017 13 Turkey 149,497.14 2017 14 Thailand 123,350.26 2017 15 Switzerland 123,184.32 2017 16 Poland 92,600.52 2017 17 Netherlands 88,817.03 2017 18 Saudi Arabia 88,366.93 2017 19 Argentina 82,817.67 2017 20 Australia 76,050.98 2017 33 South Africa 41,370.14 2017
Source: World Bank (2017)
It is clear from the above table that South Africa lags considerably from its peers such as Turkey and Mexico. The gap poses a significant opportunity to use manufacturing as an economic lever for the South African economy. Beyond the fact that developed economies dominate manufacturing output, global trends indicate that East Asian countries are next line regarding dominating the developing economies on manufacturing output. According to the United Nations Conference on Trade and Development (2016), of the eleven fastest growing non-island developing economies since 1980, nine are from East Asia.
In the South African context, Berry et al. (2002) identified SMMMEs in the clothing and furniture production as being labour-intensive and thus, more exposed to regulatory risk. Such SMMEs tend to experience high labour costs which are related or are a consequence of labour
24
laws that were meant to benefit workers. With SMMMEs finding it costly even to hire unskilled and semi-skilled workers, it adds to the hindrances of small business growth.
2.2.5 Conclusion
What is evident from the above sections of this chapter is the enormous scope for the growth of SMMMEs in South Africa and the opportunity they pose to turn-around the economic circumstances of the country with productivity improvements.
2.3 Lean Manufacturing 2.3.1 Introduction
This section focuses on lean manufacturing and its significance in business improvement.
2.3.2 Definition of Lean Manufacturing
The term Lean manufacturing was coined by WAYMO CEO, John Krafcik (1988) to describe the Toyota Production System (TPS). The term was popularised by Womack, Jones, Roos and Carpenter in their watershed book called The machine that changed the world (Womack et al., 1990). The machine that changed the world was a book about a $5 million, 5-year research study into Japanese automobile manufacturing practices (Womack et al., 1990). The research was housed by the International Motor Vehicle Program (IMVP) under the Massachusetts Institute of Technology (MIT). The study was motivated by a need to understand how American automotive companies could learn better manufacturing practices from Japanese automotive companies. It had been noted that the American way of manufacturing automobiles had not changed much since 1913 when Henry Ford adapted the conveyor belt to the manufacturing of cars (Basu & Wright, 2003).
Lean manufacturing can be described as a business philosophy that is concerned with maximising value for customers through the reduction of muda (waste). Shingo defined TPS/Lean as being 80% waste elimination, 15% production system and only 5% Kanban (1981). Shingo (1981) noted that about 80% of ordinary business people he interacted with tended to describe TPS as a Kanban system, while the other 15% tended to know how TPS functioned in the factory and would say, “it is a production system”. He finally noted that only a few (5% of ordinary business people he interacted with) really understood its purpose and would say, “it is a system for the absolute elimination of waste”. Lean is underpinned by
25
Industrial Engineering Techniques. The terms TPS and Lean Manufacturing are used interchangeably in this research document due to the background already provided above.
There are five steps to implementing Lean (Womack et al., 1990), namely:
1. identify value;
2. map the value stream; 3. create flow;
4. establish pull; and 5. seek perfection.
A key feature in lean is the obsession with optimising value-adding activities and reducing waste. Value-adding activities are loosely defined as those activities a customer is willing to pay for as they move the process closer to its end. Waste can be looked at as those activities that are not adding any value from a customer’s perspective; they are a pure nuisance to employees (and often customers). The basic logic to waste elimination and TPS comes from Taylorism and the Gilbreths. Their methods can be described as follow (Shingo, 1988):
• Taylorism – defines the status quo analytically and temporally and improve it through scientific reasoning – these activities are known as time-study techniques.
• The Gilbreths – Frank B. Gilbreth and his wife Lilian, in the 1890s, developed a clearly-defined notion of improvement and established techniques to carry out an analysis by breaking up the status quo into elemental units of motion called Therbligs. Identify the purpose of each therblig and find the one best way (in which work is broken down, purposes are tracked down, and better methods are devised) using techniques that accord with those purposes.
The waste elimination concept is categorised into eight types of wastes. Former Toyota executive, Taiichi Ohno, identified the first seven types of wastes (Womack, 1993). It was not until 2004 that an eighth waste (non-utilisation of talent/people) was added by Michigan professor, Jeffrey Liker (2004). The eight types of waste including their description and examples are presented below in Table 2.9.
26 Table 2.9: Eight Wastes of Lean Manufacturing
Type of Waste Description Example
Defects or Errors Defects or Errors refers to outputs
that deviate from quality specifications and as a result are either scrapped, reworked or transferred to different streams
Scrap, rework, mistakes,
concessions, transfers,
incorrect collection of data,
rejections in sourcing
applications, incomplete PR’s, bugs in IT development
Over production Overproduction arises when we
are applying resources to produce a product or service before it is needed by the next process, or generating more than is actually required
Running equipment to keep equipment and people busy, unbalanced work execution schedules, producing software features that nobody is going to
use, information sent
automatically even when not required, too many reviews
Waiting Waiting involves delays to process
steps and results in worker(s) having to wait for something or someone prior commencement of work. This may include waiting for information, authorization, tooling or approval.
Awaiting materials, awaiting people, awaiting equipment, awaiting process, awaiting
authorization, system
downtime
Non-utilization of people/talent
Not fully utilized people/talent represents under-utilization of people’s skills set or potential. Because operators are close to their
Talents or skills not utilized, unbalanced workload, limited agility, inability to establish
27
processes daily, they can often
recognize problems or
opportunities that staff or superiors just don’t see, but the workers may never be asked for their input. They may also have other capabilities or formal skills that aren’t formally part of their assigned jobs, but could be of use
preventative action(s) for root cause
Transport or
Conveyance
Transportation or Conveyance waste deals with unnecessary movement of products or process
inputs. From a customer
perspective, transport/ conveyance adds NO value to the product. In fact, transportation/conveyance can sometimes even reduce value.
Long travel distances, routing of unnecessary approvals
Inventory or
Queuing Waste
Products or work waiting in a queue are considered inventory or Queuing waste, as is excess stock in the form of raw materials, work-In-process and finished goods. In some cases, this waste may be the
result of the waste of
Overproduction
High obsolescence, packaging material that are excessively higher than replenishment point, excessive backlog of work to be processed
Motion Motion waste involves movement
by people. Poor ergonomics, leading to stretching, bending, twisting, walking creates motion waste
Repetitive/unnecessary
movement caused by poor ergonomic design, looking for data & information, bending to pick items from the floor
28
Extra or over
processing
Extra or over processing might be extra steps in a process or inefficient routings that may result
in un-even cycle match.
Organizations may want to provide the shiniest, most sparkly widget, but anything beyond a customer’s spec is non-value-added
Lack of SOPs, incapable processes, too many approvals, multiple MIS reports
Source: The Toyota Way (2004)
In an attempt to help quantify the management policies of various plants across the world, Krafcik (1988) proposes the following characteristics as a way to think about production systems:
1. span of worker control; 2. inventory levels; 3. size of repair areas; 4. buffers; and
5. teamwork.
Presented below in Table 2.10 are comparisons into the characteristics of production systems from craftsmen period to Lean (Krafcik, 1988).
29 Table 2.10: Characteristics of production systems
Production System Characteristics
Craftsmen Pure Fordism Recent Fordism TPS/Lean
Work Standardization Low High, by
managers
High, by managers
High, by teams
Span of Control Wide Narrow Narrow Moderate
Inventories Large Moderate Large Small
Buffers Large Small Large Small
Repair Areas Integral Small Large Very small
Teamwork Moderate Low Low High
Source: Krafcik (1988)
2.3.3 Background to Lean Manufacturing
Understanding Lean Manufacturing requires some historical context of the Toyoda family business, as Lean was highly influenced by the founding members’ beliefs and Japan’s economic context. The Toyota group of companies were born from Toyoda Loom Works business that was founded in 1926 by a Japanese inventor, Sakichi Toyoda (Liker, 2004). Toyoda Loom Works is a corporation that is involved in activities that include automobile assembly and the manufacture of automobile components, industrial vehicles and textile machinery.
In the 1920s, Sakichi Toyoda invented a sophisticated automatic power loom. Years later, in 1929, Sakichi sent his son, Kiichiro Toyoda, to England to sell the patent rights to his mistake-proof power loom. The patent was sold for £100 000 to British textile maker, Platt Brothers (Liker, 2004). Sakichi took the £100 000 and started Toyota Motor Corp. and tasked Kiichiro with building the car business. After studying mechanical engineering and engine technology at the Tokyo Imperial University, Kiichiro built the company on his father’s management approach but added his own innovations. The Toyota management approach to manufacturing is called the Toyota Production System (Liker, 2004).
There are two primary pillars to TPS and subsequently Lean, namely JIDOKA and Just-in-Time (JIT) (Ohno, 1988). Figure 2.2 illustrates how the TPS/Lean pillars interface with Toyota philosophies and desired outcomes.
30 Figure 2.2: TPS/Lean Model
Source: University of Kentucky – True Lean (2018)
The oldest part of TPS/Lean is the concept of Jidoka that was developed in the 1920s by Toyoda founder, Sakichi Toyoda, at his weaving and looming plant (Smalley, 2002). Jidoka is concerned with building in quality at the production process as well as enabling the separation of man and machine for multi-process handling. There are two parts to Jidoka: 1) Building in quality at the process, and 2) Enabling the separation of man from machine in work environments. Jidoka is a Japanese word that ordinarily means automatic or automation. Toyota, however, puts a specific twist on this word by adding what is known as a “radical” in depicting kanji characters (Smalley, 2002). “The radical added to the left of one of the kanji characters in Jidoka means human.” In other words, Lean aspires for processes that can make intelligent decisions and shut down automatically at the first sign of an abnormal condition such as a defect or other problem. The goal is not to run continuously but to stop running automatically when trouble arises.
The second pillar of TPS/Lean is the JIT pillar of the production system. Kiichiro Toyoda coined the phrase Just-in-Time in 1937 after the start of Toyota Motor Corporation (Smalley, 2002). The company was poor and could not afford to waste money on excess equipment or materials in production. Everything was expected to be procured just in time and not too early or too late. The JIT concept aims to produce and deliver the right parts, in the right amount, at the right time using the minimum necessary resources. This system reduces inventory and strives to prevent both early and overproduction. Producing in a JIT fashion exposes problems quickly. Later elements developed in the 1950s including takt time, standardised work and Kanban added to the basis for JIT.
31
After World War II, Taiichi Ohno, an engineer in the Toyoda Spinning and Weaving Corporation, was brought over to the automotive side of the business. He was given the task of improving operational productivity and driving the concepts of JIT and Jidoka (Smalley, 2002). He was eventually appointed machine shop manager of an engine plant and experimented with many concepts in production between the years of 1945 and 1955. His work and effort largely resulted in the formulation of what is now acknowledged as the Toyota Production System. It was Ohno, guided by consultants and Engineers that include Edwards Deming, Joseph Juran, Shigeo Shingo and others, that contributed to the overall development of the company and the production system.
The original Toyota model of Lean Manufacturing, from which various hybrids were developed, comprised eight tools and approaches (Basu, 2003):
1. Total Productive Maintenance (TPM) – An approach to asset care or equipment maintenance that aims to improve productivity through equipment reliability. Overall Equipment Effectiveness (OEE) is a key metric in TPM.
2. Visual Workplace (5S’) – 5S consists of 5 pillars that start with an “S” (Hirano, 1995). The 5 pillars are defined as Sort, Set in order, Shine, Standardise and Sustain. The objective of the 5S’ is to expose defects visually to allow for the elimination of waste.
3. Just in Time (JIT) – JIT generally precludes large batch production; instead, items are made in batches of one, referred to as one-piece flow. One-piece flow’s ultimate goal is to expose quality and cost
4. Single minute exchange of dies (SMED) – Achieving JIT requires using small-lot production employing SMED and dramatic reductions in lead times. SMED is aimed at reducing machine set-up time to single digit minutes (i.e. less than ten minutes).
5. Jidoka or Autonomation – Jidoka is anchored around the notion of building in quality at the production process as well as enabling the separation of man and machine for multi-process handling
6. Production work cells – A production logic that brings together people, equipment and processes into a single location. Work cells enable single-piece flow as there is minimal movement of the product and there are no redundant activities from cell to cell (Hennessey, 2017)
32
7. Kanban – Kanban means “tag” or “ticket” (Shingo, 1988). The Kanban system is used as a means of control and coordination.
8. Poka-Yoke (mistake-proofing) – Poka-yoke refers to a source inspection system that strives to achieve 100% inspection through mechanical or physical control (Shingo, 1986). There are two ways in which poka-yoke can be used to correct mistakes:
a. Control type – when the poka-yoke is activated, the machine or processing line shuts down so the problem can be corrected.
b. Warning type – when the poka-yoke is activated, a buzzer sounds or a lamp flashes to alert the worker.
Common techniques found in Lean manufacturing today include:
1. Just-in-time
2. SMED
3. Visual Management 4. 5S
5. PDCA cycle
6. 5-Why problem-solving (and the other 6 quality control tools) 7. Value-stream mapping
8. Standardised work 9. Eight wastes
10.Hoshin Kanri (policy deployment) 11.Total productive maintenance 12.Poka-Yoke
For this study, the above (12) techniques will all be considered as elements of Lean and companies will be measured against these techniques. Implementing Lean typically takes a number of years. McGivern and Stiber (2014) averaged the implementation period to 5 years and broke down activities as per Table 2.11.
33
Table 2.11: Lean implementation method and time period
Years 0 - 0.5 0.5 - 2 > 2 - 4 > 4 Objective Building organisational awareness
Creating the new organisation Aligning the systems Completing the transformation Activities 1. Senior leadership clarifies the business case for Lean 1. Redesign the organisation to use Lean techniques 1. Continuous improvement processes are driven from bottom-up versus top-down 1. The transformation to Lean techniques is completed 2. Management ensure Lean approach is consistent with organization's vision 2. Implement training and development processes to assist the transition 2. All organisational support systems are in alignment 2. Integration of Lean techniques with suppliers begins 3. Management assesses the organization's readiness for Lean transition 3. Help leaders and employees make the transition to their new roles 3. Ongoing measurement and process monitoring systems are ingrained in the new culture 3. Ongoing continuous improvement and organisational development is a way of life 4. Management defines the baseline measures of success 4. The bottom line is meeting the favourable expectations identified in the business case from the first six months 4. Savings in buffer length should be directly reflected in a reduction of building costs for the facility. 5. Organization defines timelines consisting of communication, objectives and scope of implementation 5. A starting point to explore further the potential benefits that Six Sigma or Design for Six Sigma can have for process design, opening a