P R O C E E D I N G S
Open Access
Application of Bayesian regression with singular
value decomposition method in association
studies for sequence data
Soonil Kwon
1,2, Xiaofei Yan
1,2, Jinrui Cui
1,2, Jie Yao
1,2, Kai Yang
1, Donald Tsiang
1, Xiaohui Li
1,2, Jerome I Rotter
1,3,
Xiuqing Guo
1,2,3*From
Genetic Analysis Workshop 17
Boston, MA, USA. 13-16 October 2010
Abstract
Genetic association studies usually involve a large number of single-nucleotide polymorphisms (SNPs) (k) and a relative small sample size (n), which produces the situation thatkis much greater thann. Because conventional statistical approaches are unable to deal with multiple SNPs simultaneously whenkis much greater thann, single-SNP association studies have been used to identify genes involved in a disease’s pathophysiology, which causes a multiple testing problem. To evaluate the contribution of multiple SNPs simultaneously to disease traits whenkis much greater thann, we developed the Bayesian regression with singular value decomposition (BRSVD) method. The method reduces the dimension of the design matrix fromktonby applying singular value decomposition to the design matrix. We evaluated the model using a Markov chain Monte Carlo simulation with Gibbs sampler constructed from the posterior densities driven by conjugate prior densities. Permutation was incorporated to generate empiricalp-values. We applied the BRSVD method to the sequence data provided by Genetic Analysis Workshop 17 and found that the BRSVD method is a practical method that can be used to analyze sequence data in comparison to the single-SNP association test and the penalized regression method.
Background
Association studies usually involve a large number of sin-gle-nucleotide polymorphisms (SNPs) (k) and a relatively small number of samples (n). To avoid multiple testing problems and to consider the effect of multiple SNPs simultaneously, investigators need statistical models that will test multiple SNPs simultaneously. Because standard statistical methods are unable to analyze multiple SNPs simultaneously whenkis much greater thann, Tibshirani [1] introduced the penalized regression (PR) method as an alternative. The method reduces the size of SNP coeffi-cients by treating the coefficoeffi-cients with little effect as zero. In other words, only those SNPs that significantly improve prediction are kept in the model. A potential drawback of this method is that a SNP with a strong marginal effect
might be removed from the model if some other SNPs can explain the effect. A second drawback is that the number of SNPs evaluated in the model is controlled by the chosen penalization parameter. Even though the PR method does evaluate multiple SNPs simultaneously whenkis much greater thann, the maximum number of SNPs that can be evaluated in the model is limited by sample size; that is, the method usually cannot test all SNPs simultaneously in large-scale genetic association studies, such as genome-wide association studies.
To evaluate all SNPs simultaneously in one statistical model, we introduced the Bayesian classification with sin-gular value decomposition (BCSVD) method [2]. The BCSVD method can be applied to a dichotomous response variable when kis much greater than n. The method achieves a massive dimension reduction by applying singu-lar value decomposition to the design matrix in a binary probit model; it estimates the effect of SNPs through the reduced model. Selection of significant SNPs can be
* Correspondence: [email protected]
1
Medical Genetics Institute, Cedars-Sinai Medical Center, Los Angeles, CA 90048, USA
Full list of author information is available at the end of the article
achieved by using the empiricalp-values obtained from permutation. The BCSVD method handles small sample sizes quite well.
To analyze quantitative traits when k is much greater than n, we further developed the Bayesian regression with singular value decomposition (BRSVD) method. We applied the BRSVD method to the sequence data pro-vided by Genetic Analysis Workshop 17 (GAW17). We show that the BRSVD method is a practical method that can be used to analyze sequence data by comparison to the single-SNP association test and PR methods.
Methods
BRSVD method
Let us consider the standard regression model in the matrix form:
y=Xb +e, e ~N( ,0s2In), (1)
where yn×1 is a vector of quantitative dependent
vari-ables,Xn×kis the design matrix,bk×1is a vector of
para-meters to be estimated, Inis an n ×nidentity matrix, and s2 is an unknown variance; as before,k andn are the number of SNPs and the number of samples, respectively. By applying singular value decomposition (SVD) to the design matrixX′=ADF′, the model in Eq. (1) with the SVD ofX can be written:
y=Xb + =e FDA′ + =b e Lg +e (2)
whereL=FDand:
gn×1= ′An p× bp×1. (3)
As in Kwon et al. [2], we call g a superfactor vector because it is expressed as a linear combination of the original parameters b. The statistical inference will be held on the superfactor vector instead of onb.From Eq. (2), the likelihood function of y given (g, s2) can be
and gˆ is the maximum-likelihood (or least-squares) estimator of g. Let us choose prior densities for (b|s2)
whereIG is the inverted gamma distribution and (b*,
m, a, b) are known hyperparameters. Becauseg =A′b, the conjugate prior density onb implies the conjugate prior density ongso that:
g s2 b s2 b s2
The joint posterior distribution for (g, s2) can be obtained by multiplying the likelihood function in Eq. (4) to the prior density in Eq. (9):
The marginal densities forgands2can be obtained by integrating Eq. (10) with respect tos2andg, respectively. Given the observed data, the marginal posterior density forgis a multivariate Student’stdistribution in which each element is a Student’stdistribution with (n+a) degrees of freedom and the marginal density fors2is:
IG⎛n+a Q
with Gibbs sampler, which starts with the maximum-likelihood estimate. To transform the superfactor vector (g) in Eq. (2) back tob, which is our original parameter of interest vector, we use the most general solution form for the linear equation (g=A′b) and achieve the unique solution for b by choosing the generalized inverse ofA′asA[3]. We use a permutation test to esti-mate the significance of the SNP effects on the pheno-type. Let bˆ (i i=1,, )k be the estimate of theith SNP effect from the raw data, and let bˆ (ij j=1,, )J be the estimate of theith SNP effect from the jth shuffled data that were obtained by permuting the quantitative trait (y). Define bidj as the difference between bˆi and the standard error of bid. Under the null hypothesis (H0: bi= 0), the statisticΛifollows the standard normal distribution whenJis large:
Λi ~N( , )0 1 (i=1,, ).k (18)
Study sample and association analysis
We used the unrelated individuals data distributed by GAW17, which includes 697 individuals, 24,487 SNPs, and 3 covariates (sex, age, and smoking status). We ana-lyzed the first 10 replicates of phenotypes for quantita-tive risk factor Q1. We first performed the single-SNP association test using the simple linear regression model option in PLINK [4]. Second, we applied the PR method with L1 penalty introduced by Tibshirani [1] using the R package monomvn [5]. We evaluated SNP association with Q1 within the maximum number of SNPs allowed by the package in each step, which is min(k,n − inter-cept). Because the package does not providep-values, we used the same permutation technique as in the BRSVD method to obtain empiricalp-values. Third, we implemented the BRSVD method. To define significant SNPs for each method, we considered the following sta-tistical models: quantitative risk factor Q1 versus the single SNP and the three covariates for the single-SNP association test; quantitative risk factor Q1 versus the maximum number of SNPs allowed by the package plus the three covariates for the PR method; and quantitative risk factor Q1 versus all SNPs (24,487) and the three covariates for the BRSVD method. All SNPs identified as significant for each model were compared to the 39 SNPs listed in the answer sheet distributed by GAW17. The analyses were run for each of the first 10 replicates,
and the average of the 10 replicates was summarized (see Results section).
Results and discussion
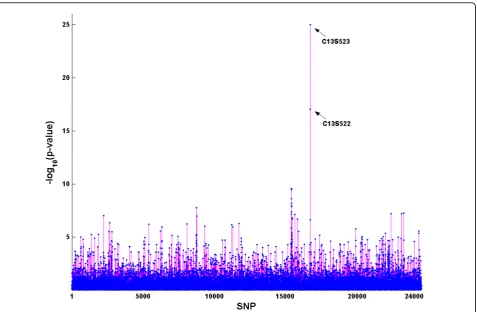
Single-SNP association
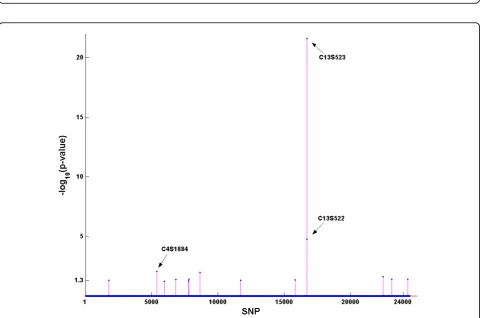
Using ap-value less than 10−5, which is an approximate value of 0.05 genome-wide level using Bonferroni cor-rection, as the cut point, the single-SNP test identified age and 50 SNPs as the risk factors for Q1 (Figure 1). By comparison with the answer sheet distributed by GAW17, which listed 39 SNPs that were associated with Q1, only 2 SNPs (C13S522 and C13S523) out of the 50 were correctly identified.
PR method
The results from the PR method are shown in Figure 2. With the cut point ofp= 0.05 (i.e.,−log10(p) = 1.3), age
was again identified as a risk factor for Q1. In addition, 15 SNPs were also found to be significant. However, only 3 SNPs (C13S523, C13S522, and C4S1884) out of the 15 were on the 39 risk SNPs list.
BRSVD method
Figure 3 summarizes the association analysis results using the BRSVD method. We applied the cut point of
p = 0.05 (i.e., −log10(p) = 1.3) because all SNPs were
evaluated in one test. Age and 45 SNPs were found to be significant. Comparing to the 39 SNPs listed in the answer sheet, 9 SNPs (C1S6533, C4S1877, C4S1889, C4S4935, C6S2981, C13S431, C13S522, C13S523, and C13S524) out of the 45 SNPs were correctly identified.
Figure 1Single-SNP association analysis from PLINK. x-axis: All SNPs on chromosomes 1–22 are numbered from 1 to 24,487.y-axis:−log10(p
-value). The names for the two SNPs that were correctly identified are given.
Figure 2Association results from the penalized regression method. x-axis: All SNPs on chromosomes 1–22 are numbered from 1 to 24,487.
method (23.1%) is considerably more powerful than the other two methods (5.1% for the single-SNP association test and 7.7% for the PR method).
Conclusions
We used three different analysis methods (the single-SNP association analysis method implemented in PLINK, as widely used in genome-wide association stu-dies; the PR method; and the BRSVD method) to iden-tify SNPs that significantly influence the quantitative trait Q1 using the unrelated-individuals sample provided by GAW17. Both the PR and BRSVD methods
out-performed the single-SNP association analysis method, suggesting that evaluating multiple SNPs simultaneously not only reduced the problems of multiple testing but also provided more power than single-SNP association in genetic association studies. The BRSVD method had a sensitivity almost three times as high as that of the PR method, suggesting that the BRSVD method is more optimal than the PR method. Another advantage of the BRSVD method is that it requires no specification of parameters compared to the PR method, which requires specification of the penalization parameter that controls the number of variables selected. Moreover, the BRSVD
Figure 3Association results from the BRSVD method.x-axis: All SNPs on chromosomes 1–22 are numbered from 1 to 24,487.y-axis:−log10
(p-value). The nine correctly identified SNPs are given.
Table 1 Summary of validation of the three methods
Empirical outcome
Single-SNP association PR method BRSVD method
Actual outcome E′(= 50) IE′(= 24,437) E′(= 16) IE′(= 24,471) E′(= 45) IE′(= 24,442)
E(= 39) TP = 2 FN = 37 Sen = 0.051 TP = 3 FN = 36 Sen = 0.077 TP = 9 FN = 30 Sen = 0.231 IE (= 24,448) FP = 48 TN = 24,400 Spe = 0.998 FP = 13 TN = 24,435 Spe = 0.9995 FP = 36 TN = 24,412 Spe = 0.9985
PPV = 0.04 NPV = 0.9984 PPV = 0.187 NPV = 0.9985 PPV = 0.2 NPV = 0.9988
method takes much less computing time than the PR method does. For the association analysis of Q1 in the GAW17 unrelated individuals data, the PR methods used about 1.5 times as much run-time as the BRSVD method. With all factors considered, we believe that the BRSVD method is a good choice for large-scale genetic association study for quantitative traits.
Acknowledgments
This research was partly supported by the Inflammatory Bowel Disease Program Project Grant DK046763, General Clinical Research Center (GCRC) grant RR00425-30, and Diabetes Endocrinology Research Center (DERC) grant NIDDK DK 063459. The Genetic Analysis Workshop is supported by National Institutes of Health grant R01 GM031575.
This article has been published as part ofBMC ProceedingsVolume 5 Supplement 9, 2011: Genetic Analysis Workshop 17. The full contents of the supplement are available online at http://www.biomedcentral.com/1753-6561/5?issue=S9.
Author details
1Medical Genetics Institute, Cedars-Sinai Medical Center, Los Angeles, CA
90048, USA.2Center for Biostatistics and Bioinformatics, Cedars-Sinai Medical Center, Los Angeles, CA 90048, USA.3Department of Biomedical Sciences,
Cedars-Sinai Medical Center, Los Angeles, CA 90048, USA.
Authors’contributions
SK participated in the design, analysis and drafted the manuscript. XY participated in data cleaning and initial data analysis. JC participated in GWAS analysis. JY helped with data analysis. DT helped to manage the data and analysis. XL helped with data analysis. JIR helped to draft the manuscript. XG participated in its design and coordination and helped to draft the manuscript. All authors read and approved the final manuscript.
Competing interests
The authors declare that there are no competing interests.
Published: 29 November 2011
References
1. Tibshirani R:Regression shrinkage via the Lasso.J Roy Stat Soc1996,
58:267-288.
2. Kwon S, Cui J, Rhodes S, Tsiang D, Rotter J, Guo X:Application of Bayesian classification with singular value decomposition method in genome-wide association studies.BMC Proc2009,3(suppl 7):S9.
3. Graybill F:Theory and application of the linear model.Belmont, CA, Duxbury Press; 1976.
4. Purcell S, Neale B, Todd-Brown K, Thomas L, Ferreira MAR, Bender D, Maller J, Sklar P, de Bakker PIW, Daly MJ,et al:PLINK: a tool set for whole-genome association and population-based linkage analysis.Am J Hum
Genet2007,81:559-575.
5. Gramacy RB:Monomvn: estimation for multivariate normal and student-t data with monotone missingness.R package version 1.8-32010 [http:// CRAN.R-project.org/package=monomvn].
doi:10.1186/1753-6561-5-S9-S57
Cite this article as:Kwonet al.:Application of Bayesian regression with singular value decomposition method in association studies for sequence data.BMC Proceedings20115(Suppl 9):S57.
Submit your next manuscript to BioMed Central and take full advantage of:
• Convenient online submission
• Thorough peer review
• No space constraints or color figure charges
• Immediate publication on acceptance
• Inclusion in PubMed, CAS, Scopus and Google Scholar
• Research which is freely available for redistribution