P R O C E E D I N G S
Open Access
Epigenome wide association study of SNP
–
CpG interactions on changes in triglyceride
levels after pharmaceutical intervention: a
GAW20 analysis
Jenna Veenstra
1,2, Anya Kalsbeek
1,2, Karissa Koster
2, Nathan Ryder
2, Abbey Bos
1, Jordan Huisman
2,
Lucas VanderBerg
2, Jason VanderWoude
2,3and Nathan L. Tintle
2*FromGenetic Analysis Workshop 20 San Diego, CA, USA. 4 - 8 March 2017
Abstract
In the search for an understanding of how genetic variation contributes to the heritability of common human disease, the potential role of epigenetic factors, such as methylation, is being explored with increasing frequency. Although standard analyses test for associations between methylation levels at individual cytosine-phosphate-guanine (CpG) sites and phenotypes of interest, some investigators have begun testing for methylation and how methylation may modulate the effects of genetic polymorphisms on phenotypes. In our analysis, we used both a
genome-wide and candidate gene approach to investigate potential single-nucleotide polymorphism (SNP)–CpG
interactions on changes in triglyceride levels. Although we were able to identify numerous loci of interest when using an exploratory significance threshold, we did not identify any significant interactions using a strict genome-wide significance threshold. We were also able to identify numerous loci using the candidate gene approach, in which we focused on 18 genes with prior evidence of association of triglyceride levels. In particular, we identified GALNT2loci as containing potential CpG sites that moderate the impact of genetic polymorphisms on triglyceride levels. Further work is needed to provide clear guidance on analytic strategies for testing SNP–CpG interactions, although leveraging prior biological understanding may be needed to improve statistical power in data sets with smaller sample sizes.
Background
Methylation plays a major role in gene regulation through epigenetic modifications at specific cytosine-phosphate-guanine (CpG) residues within the regulatory regions of genes and, consequently, may influence the transcriptional
activity [1]. In brief, methylation occurs when a methyl
group is transferred to the DNA via a family of DNA methyltransferases. The majority of DNA methylation occurs oncytosines, which immediately precedea guan-ine nucleotide (ie, CpG site). These CpG sites occur
frequently throughout the genome and have been linked to both single-nucleotide polymorphisms (SNPs)
and epigenetic changes [2].In particular, DNA
methyla-tion may lead to different influences on gene activities
depending on the surrounding genetic sequence [3].
Because SNPs near the CpG site may alter methylation levels, the statistical interaction between SNPs and CpG sites may explain varying gene expression across individuals. Prior research shows that DNA methylation in the interleukin-4 receptor is associated with asthma, but this association is further explained by the presence
or absence of a nearby SNP [4]. A study focusing on
obesity found the interaction between CpG sites in an enhancer region interacts with CpG creating SNP sites * Correspondence:[email protected]
2Department of Mathematics and Statistics, Dordt College, 498 4th Ave. NE,
Sioux Center, IA 51250, USA
Full list of author information is available at the end of the article
© The Author(s). 2018Open AccessThis article is distributed under the terms of the Creative Commons Attribution 4.0
in an obesity-risk haplotype, which helps explain obesity/
Type 2 Diabetes [5].
As part of GAW20, we were provided access to a data set of methylation, SNPs, and triglyceride levels over 2 time periods, along with numerous related covariates. In par-ticular, the study measured triglyceride levels before and after pharmaceutical intervention. Given the well-known relationship between triglycerides and many different
car-diometabolic diseases, including cardiovascular disease [6],
we chose to look for evidence of methylation at CpG sites that potentially modulate the impact of nearby SNPs on changes in triglyceride levels.
Methods
Sample population and variables
The sample consisted of 670 individuals from a pedigree sample provided as part of GAW20 for whom all analyzed variables were available. We considered 6 co-variates (age, observation center, smoking status, mass spectrometry DX client [MSDX] International Diabetes Federation [IDF] score, fasting time at baseline, and high-density lipoprotein [HDL] at baseline) the majority of which were significantly associated with baseline tri-glyceride (TG) in this sample. The primary response variable of interest was TG level at baseline (visit 1 or 2). For variables with up to 2 measurements at baseline (HDL [baseline], TG [baseline]), we used the average value if both measurements were available, or the only available measurement if only one was available.
Models
The modeling process was done in 2 stages. The first stage model resulted in a single residual TG value for each person, while the second stage resulted in approxi-mately 700,000 models (one for each SNP that passed standard genome-wide association study [GWAS] qual-ity control [QC] criteria: Hardy-Weinberg equilibrium
p value> 1 × 10⁻⁶, minor allele frequency > 1%, SNP
missing data rate < 5%).
In the first stage, we used the lmekin function from
the coxme package in R [7] to predict the change in
log-transformed TG levels [y= ln (baseline)]. In cases
where 2 separate TG measurements were available for the baseline, we natural-log (ln)-transformed the data before averaging. Baseline ln-transformed TG levels was predicted by the 6 covariates listed earlier and accounted for the familial relationships in the model through the use of the kinship matrix. We then saved the resulting
“residual” value (ri¼^yi−yi) for each of the i= 1,…, 670
individuals in our analysis.
The second stage predicted the residuals (ri′s) from stage
1 based on the number of minor alleles (SNPj= 0, 1, 2) and
methylation scores (CPGj∈[0, 1]) with a separate model
for eachSNPj,CPGjpair using thelmfunction in R [7]. In
particular, the second stage model forSNPj,CPGjpair was:
rj¼βSjSNPjþβCjCPGjþβSjCjSNPjCPGj ð1Þ
where βSjCj is the estimate of interaction effect between
SNPjandCPGj.SNPj,CPGjpairs were made by assigning
each SNP passing QC to its nearest CpG site, resulting in approximately 700,000 pairs, with some CpG sites assigned to multiple SNPs.
Statistical analysis
Statistical significance of the interaction term in Eq. 1
was assessed using an Ftest, essentially testing whether
the statistical interaction provided significantly more evi-dence of association with changes in TG levels versus a
model with only main-effects terms. Versions of Eq. 1
without the interaction term were also run. We started by using a generally accepted, but stricter and conservative,
genome-wide significance level of 5 × 10⁻⁸. We followed up
this analysis by using a more liberal and exploratory
sig-nificance level of 1 × 10⁻⁴ in our genome-wide
interaction analysis.
We followed this genome-wide analysis with a candidate gene study focusing on 18 gene regions (containing 423 unique SNP-CpG sites) that have been shown to be asso-ciated with TGs in previous genome-wide association
studies via searches at http://www.ebi.ac.uk/gwas.
Throughout the candidate gene analysis, we used a signifi-cance level of 0.05. As part of the candidate gene analysis we also collapsed all the CpG sites within each gene re-gion (50 kb on either side of the gene) by using 5 different methods (mean, minimum, maximum, median, and sum-squares of the CpG values as the CPG value in the model) to evaluate the potential impact of different ways of summarizing methylation evidence for each SNP. For the SNPs that demonstrated a significant interaction for more than one of the collapsing methods used, we then looked at the interactions between all CpG sites within the region and those SNPs.
Results
Genome-wide approach
No interaction term p values were significant when
using the conservative 5 × 10⁻⁸threshold. However, 58
SNP-CpG pairs showed significant interactions using the
more liberal 1 × 10⁻⁴significance level. Table 1
summa-rizes 25 loci that include regions of SNPs that are colo-calized and within genes (total of 44 interactions). The
median p value of the interaction term across all sites
Candidate gene approach
In our data, there are 18 genes (containing 423 SNPs for which data was available) previously shown to be
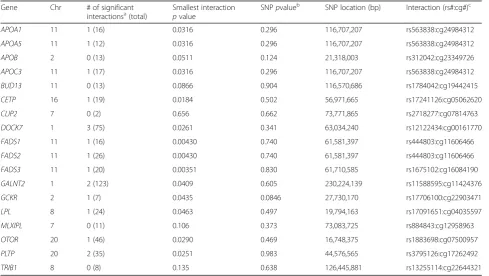
associ-ated with TG levels. Table 2 summarizes the results of
fitting Eq.1with an interaction term, as well as a version
of Eq.1without the interaction term.
Thirteen of the 18 candidate genes show at least modest
(p< 0.05) evidence of statistical interaction between
nearby methylation values and SNPs within the gene. The
most significant SNP is inFADS3(rs1675102) and has a
minor allele frequency of 0.28. The interaction is such that additional copies of the minor allele lead to a decreased impact of methylation on changes in TG levels.
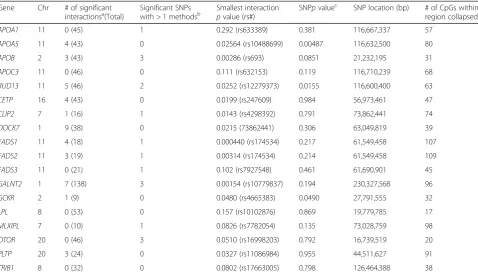
Table 3 shows the results of collapsing all the CpG
sites within each gene region through the minimum method, which uses the minimum CpG value of all CpG sites within 50 kb of the gene. Compared to the other 4 methods, the minimum method resulted in more signifi-cant interactions (44) than did the other 4 collapsing methods, which on average only have 23 significant in-teractions (detailed results not shown).
We identified 176 unique SNPs in significant interac-tions for more than 1 of the 5 different CpG collapsing
methods as found in Table4. In total, there are 176 unique
significant SNP × CpG interactions. GALNT2 had the
largest number of significant results with 69 interactions, where 1 of the 69 interactions is the most significant with
a p value of 0.000142. The SNP in this interaction
(rs6677241) has a minor allele frequency of 0.026. The interaction results in an increased impact of methyla-tion on TG levels for every addimethyla-tional allele.
Discussion
Although no significant SNP–CPG interactions were
identified when using strict, genome-wide significance
thresholds (5 × 10⁻⁸), use of a more exploratory approach
identified many genes previously shown to be associated
with cardiometabolic traits (1 × 10⁻⁴). A candidate gene
approach, using a significance level of 0.05, identified loci in 13 genes with modest evidence for SNP-CpG interactions on baseline TG levels. Furthermore, by using the collapsing methods, we were able to identify potentially interesting SNPs for additional exploration. Using only these SNPs, our examination of all CpG sites within each gene region resulted in 176 significant unique SNP-CpG pairs. In every
case, the SNP-CpGpvalue was smaller than both the SNP
and CpGp values from the noninteraction model. This
suggests that using SNP-CpG pairs may identify SNPs that would not be identified by traditional GWAS techniques.
The gene GALNT2, had the most significant interactions
with 69. SNPs inGALNT2were previously identified as
as-sociated with TG levels, high- and low-density lipoprotein
cholesterol [8]. One study shows that promoter methylation
Table 2Summary of 18 genes with previous evidence of association with triglyceride levels
Gene Chr # of significant
interactionsa(total)
Smallest interaction
pvalue
SNPpvalueb SNP location (bp) Interaction (rs#:cg#)c
APOA1 11 1 (16) 0.0316 0.296 116,707,207 rs563838:cg24984312
APOA5 11 1 (12) 0.0316 0.296 116,707,207 rs563838:cg24984312
APOB 2 0 (13) 0.0511 0.124 21,318,003 rs312042:cg23349726
APOC3 11 1 (17) 0.0316 0.296 116,707,207 rs563838:cg24984312
BUD13 11 0 (13) 0.0866 0.904 116,570,686 rs1784042:cg19442415
CETP 16 1 (19) 0.0184 0.502 56,971,665 rs17241126:cg05062620
CLIP2 7 0 (2) 0.656 0.662 73,771,865 rs2718277:cg07814763
DOCK7 1 3 (75) 0.0261 0.341 63,034,240 rs12122434:cg00161770
FADS1 11 1 (16) 0.00430 0.740 61,581,397 rs444803:cg11606466
FADS2 11 1 (26) 0.00430 0.740 61,581,397 rs444803:cg11606466
FADS3 11 1 (20) 0.00351 0.830 61,710,585 rs1675102:cg16084190
GALNT2 1 2 (123) 0.0409 0.605 230,224,139 rs11588595:cg11424376
GCKR 2 1 (7) 0.0435 0.0846 27,730,170 rs17706100:cg22903471
LPL 8 1 (24) 0.0463 0.497 19,794,163 rs17091651:cg04035597
MLXIPL 7 0 (11) 0.106 0.373 73,083,725 rs884843:cg12958963
OTOR 20 1 (46) 0.0290 0.469 16,748,375 rs1883698:cg07500957
PLTP 20 2 (35) 0.0251 0.983 44,576,565 rs3795126:cg17262492
TRIB1 8 0 (8) 0.135 0.638 126,445,881 rs13255114:cg22644321
a
With a significance level of 0.05 b
From a model with only main effects terms for CpG and SNP (ie, Eq.1without the interaction term) c
of GALNT2 is associated with a higher risk of coronary
heart disease [9].
There are some limitations to our analysis. First, to manage computational resources, we began by predict-ing baseline TG levels by kinship and covariates, yieldpredict-ing residuals for each individual, which we used for assessing impact of methylation and genetic variation. Other alternatives to this methodology may exist. We used an exploratory significance threshold for the genome-wide
analysis, relative to the vast majority of GWAS-type analyses published today. Although this can lead to more
false-positive results, we did find a number of “
sub-threshold” loci of potential interest suggesting the need
for studies with larger sample sizes and more sensitive statistical methods to draw out these loci of interest. The minimum method of summarizing methylation in a region nearby to a gene showed promise, although fur-ther work is needed to more fully evaluate the many
Table 3Summary of CpG results after collapsing using the minimum method
Gene Chr # of significant
interactionsa(Total) Significant SNPswith > 1 methodsb Smallest interactionpvalue (rs#) SNPpvalue c
SNP location (bp) # of CpGs within region collapsed
APOA1 11 0 (45) 1 0.292 (rs633389) 0.381 116,667,337 57
APOA5 11 4 (43) 0 0.02564 (rs10488699) 0.00487 116,632,500 80
APOB 2 3 (43) 3 0.00286 (rs693) 0.0851 21,232,195 31
APOC3 11 0 (46) 0 0.111 (rs632153) 0.119 116,710,239 68
BUD13 11 5 (46) 2 0.0252 (rs12279373) 0.0155 116,600,400 63
CETP 16 4 (43) 0 0.0199 (rs247609) 0.984 56,973,461 47
CLIP2 7 1 (16) 1 0.0143 (rs4298392) 0.791 73,862,441 74
DOCK7 1 9 (38) 0 0.0215 (73862441) 0.306 63,049,819 39
FADS1 11 4 (18) 1 0.000440 (rs174534) 0.217 61,549,458 107
FADS2 11 3 (19) 1 0.00314 (rs174534) 0.214 61,549,458 109
FADS3 11 0 (21) 1 0.102 (rs7927548) 0.461 61,690,901 45
GALNT2 1 7 (138) 3 0.00154 (rs10779837) 0.194 230,327,568 96
GCKR 2 1 (9) 0 0.0480 (rs4665383) 0.0490 27,791,555 32
LPL 8 0 (53) 0 0.157 (rs10102876) 0.869 19,779,785 17
MLXIPL 7 0 (10) 1 0.0826 (rs7782054) 0.135 73,028,759 98
OTOR 20 0 (46) 3 0.0510 (rs16998203) 0.792 16,739,519 20
PLTP 20 3 (24) 0 0.0327 (rs11086984) 0.955 44,511,627 91
TRIB1 8 0 (32) 0 0.0802 (rs17663005) 0.798 126,464,388 38
a
With a significance level of 0.05 b
The SNP was found to be significant with more than 1CpG collapsing method. Refer to methods section c
From a model with only main effects terms for CpG and SNP (ie, Model 1 without the interaction term)
Table 4Summary of 176ainteraction pairs
Gene Chr # of significant interactionsb(total)
Smallest interaction
pvalue
SNPpvaluec CpGpvaluec SNP location (bp) Interaction (rs#:cg#)
APOA1 11 11 (57) 0.00678 0.591 0.310 116,759,824 rs12294191:cg07700644
APOB 2 9 (31) 0.00316 0.414 0.518 21,205,457 rs10172650:cg26118553
BUD13 11 31 (126) 0.00103 0.787 0.837 116,652,301 rs4417316:cg14371153
CLIP2 7 7 (74) 0.00318 0.214 0.983 73,671,288 rs3735504:cg08495433
FADS1 11 4 (52) 0.0193 0.0921 0.0831 61,549,458 rs174534:cg07689907
FADS2 11 10 (53) 0.00228 0.217 0.432 61,549,458 rs174534:cg11880646
FADS3 11 9 (45) 0.0183 0.861 0.690 61,698,488 rs7928792:cg03046346
GALNT2 1 69 (288) 0.000142 0.780 0.998 230,337,887 rs6677241:cg03961853
MLXIPL 7 16 (98) 0.00220 0.613 0.298 73,041,886 rs6460045:cg03842980
OTOR 20 10 (60) 0.00934 0.196 0.581 16,702,501 rs761228:cg07364906
a
As a result of overlap of gene regions forFADS1andFADS2, 3 significant interactions are counted twice b
With a significance level of 0.05 c
options. Regardless, leveraging prior biological evidence (eg, via the candidate gene approach) may be of
poten-tial effect when testing for SNP–CPG interactions.
Conclusions
Even with “subthreshold” significance, our results go a
long way toward showing the need for statistical models that leverage prior biological information. Our study shows that a mediated effect of SNPs on methylation is a possible explanation for changes in TG levels. With this knowledge, more studies with greater sample sizes can be performed as well as wet lab experimentation to confirm the relationship. As we learn more about the
effect an individual’s genotype has on their health, there
is greater opportunity for personalized medicine to be an effective treatment strategy.
Funding
Publication of this article was supported by NIH R01 GM031575.
Availability of data and materials
The data that support the findings of this study are available from the Genetic Analysis Workshop (GAW), but restrictions apply to the availability of these data, which were used under license for the current study. Qualified researchers may request these data directly from GAW.
About this supplement
This article has been published as part of BMC Proceedings Volume 12 Supplement 9, 2018: Genetic Analysis Workshop 20: envisioning the future of statistical genetics by exploring methods for epigenetic and pharmacogenomic data. The full contents of the supplement are available online athttps:// bmcproc.biomedcentral.com/articles/supplements/volume-12-supplement-9.
Authors’contributions
All authors participated in the conception of this idea, have read and approved of the final manuscript. JVW wrote most of the code. JV and AK analyzed the data. JV wrote the manuscript and made revisions. NLT provided support throughout the project.
Ethics approval and consent to participate
Not applicable.
Consent for publication
Not applicable.
Competing interests
The authors declare that they have no competing interests.
Publisher’s Note
Springer Nature remains neutral with regard to jurisdictional claims in published maps and institutional affiliations.
Author details
1Department of Biology, Dordt College, 498 4th Ave. NE, Sioux Center, IA
51250, USA.2Department of Mathematics and Statistics, Dordt College, 498 4th Ave. NE, Sioux Center, IA 51250, USA.3Department of Computer Science,
Dordt College, 498 4th Ave. NE, Sioux Center, IA 51250, USA.
Published: 17 September 2018
References
1. Rösl F1, Arab A, Klevenz B, zurHausen H. The effect of DNA methylation on gene regulation of human papillomaviruses. J Gen Virol. 1993;74(Pt 5):791–801. 2. Zhi D, Aslibekyan S, Irvin MR, Claas SA, Borecki IB, Ordovas JM, Absher DM,
Arnett DK. SNPs located at CpG sites modulate genome-epigenome interaction. Epigenetics. 2013;8(8):802–6.
3. Moore LD, Le T, Fan G. DNA methylation and its basic function. Neuropsychopharmacology. 2013;38(1):23–38.
4. Soto-Ramírez N, Arshad SH, Holloway JW, Zhang H, Schauberger E, Ewart S, Patil V, Karmaus W. The interaction of genetic variants and DNA methylation of the interleukin-4 receptor gene increase the risk of asthma at age 18 years. Clin Epigenetics. 2013;5(1):1.
5. Bell CG, Finer S, Lindgren CM, Wilson GA, Rakyan VK, Teschendorff AE, Akan P, Stupka E, Down TA, Prokopenko I, et al. Integrated genetic and epigenetic analysis identifies haplotype-specific methylation in the FTO type 2 diabetes and obesity susceptibility locus. PLoS One. 2010;5(11):e14040. 6. Lindman AS, Veierød MB, Tverdal A, Pedersen JI, Selmer R. Nonfasting
triglycerides and risk of cardiovascular death in men and women from the Norwegian counties study. Eur J Epidemiol. 2010;25(11):789–98. 7. R-Project:“R,”2016. [Online].https://www.r-project.org. Accessed Feb 2017. 8. Guo T, Yin RX, Huang F, Yao LM, Lin WX, Pan SL. Association between the
DOCK7,PCSK9andGALNT2gene polymorphisms and serum lipid levels. Sci Rep. 2016;6:19079.
9. Peng P, Wang L, Yang X, Huang X, Ba Y, Chen X, Guo J, Lian J, Zhou J. A preliminary study of the relationship between promoter methylation of the
ABCG1,GALNT2andHMGCRgenes and coronary heart disease. PLoS One. 2014;9(8):e102265.
10. Comuzzie AG, Cole SA, Laston SL, Voruganti VS, Haack K, Gibbs RA, Butte NF. Novel genetic loci identified for the pathophysiology of childhood obesity in the Hispanic population. PLoS One. 2012;7(12):e51954.
11. Locke AE, Kahali B, Berndt SI, Justice AE, Pers TH, Day FR, Powell C, Vedantam S, Buchkovich ML, Yang J, et al. Genetic studies of body mass index yield new insights for obesity biology. Nature. 2015;518(7538):197–206.
12. Williams SR, Hsu FC, Keene KL, Chen WM, Nelson S, Southerland AM, Madden EB, Coull B, Gogarten SM, Furie KL, et al. Shared genetic susceptibility of vascular-related biomarkers with ischemic and recurrent stroke. Neurology. 2016;86(4):351–9.
13. Sung YJ, de Las Fuentes L, Schwander KL, Simino J, Rao DC. Gene-smoking interactions identify several novel blood pressure loci in the Framingham heart study. Am J Hypertens. 2015;28(3):343–54.
14. Carty CL, Keene KL, Cheng YC, Meschia JF, Chen WM, Nalls M, Bis JC, Kittner SJ, Rich SS, Tajuddin S, et al. Meta-analysis of genome-wide association studies identifies genetic risk factors for stroke in African Americans. Stroke. 2015;46(8):2063–8.
15. Zheng JS, Arnett DK, Lee YC, Shen J, Parnell LD, Smith CE, Richardson K, Li D, Borecki IB, Ordovás JM, et al. Genome-wide contribution of genotype by environment interaction to variation of diabetes-related traits. PLoS One. 2013;8(10):e77442.
16. Rühle F, Witten A, Barysenka A, Huge A, Arning A, Heller C, Krümpel A, Mesters R, Franke A, Lieb W, et al. Rare genetic variants in SMAP1, B3GAT2, and RIMS1 contribute to pediatric venous thromboembolism. Blood. 2017; 129(6):783–90.
17. Yu B, Zheng Y, Alexander D, Manolio TA, Alonso A, Nettleton JA, Boerwinkle E. Genome-wide association study of a heart failure related metabolomic profile among African Americans in the atherosclerosis risk in communities (ARIC) study. Genet Epidemiol. 2013;37(8):840–5.
18. Smith NL, Felix JF, Morrison AC, Demissie S, Glazer NL, Loehr LR, Cupples LA, Dehghan A, Lumley T, Rosamond WD, et al. Association of genome-wide variation with the risk of incident heart failure in adults of European and African ancestry: a prospective meta-analysis from the cohorts for heart and aging research in genomic epidemiology (CHARGE) consortium. Circ Cardiovasc Genet. 2010;3(3):256–66.
19. Christophersen IE, Rienstra M, Roselli C, Yin X, Geelhoed B, Barnard J, Lin H, Arking DE, Smith AV, Albert CM, et al. Large-scale analyses of common and rare variants identify 12 new loci associated with atrial fibrillation. Nat Genet. 2017;49(6):946–52.
20. Nagy R, Boutin TS, Marten J, Huffman JE, Kerr SM, Campbell A, Evenden L, Gibson J, Amador C, Howard DM, et al. Exploration of haplotype research consortium imputation for genome-wide association studies in 20,032 generation Scotland participants. Genome Med. 2017;9(1):23.