FULL PAPER
Evaluation of automatic hypocenter
determination in the JMA unified catalog
Koji Tamaribuchi
*Abstract
The Japan Meteorological Agency (JMA) unified seismic catalog has been widely used for research and disaster pre-vention purposes for more than 20 years. Since the introduction in April 2016 of an improved method of automatic hypocenter determinations (PF method), the number of detected earthquakes has almost doubled due to a decrease in the completeness magnitude around the Tohoku region, where seismicity has been very active in the aftermath of the 2011 Tohoku earthquake. Automatically processed hypocenters of small events, accepted without manual modification, now make up approximately 70% of new events in the JMA unified catalog. In this paper, we show that the introduction of automated processing did not systematically bias the quality of the JMA unified catalog. Approxi-mately 90% of automatically processed hypocenters were less than 1 km from their manually reviewed locations in inland and shallow areas. We also considered the use of automated event characterization in real-time monitoring of earthquake sequences using the example of the April 2016 Kumamoto earthquake sequence, when the PF method could have supplied the catalog with about 70,000 events in real time over the course of 2 months. We show that the PF method is capable of monitoring the migration or expansion of the hypocentral distribution and can support sta-tistical analyses such as variations of the b-value distribution. Further improvements in automatic hypocenter deter-mination will contribute to a better understanding of seismicity as well as rapid risk assessment, especially in cases of swarms and aftershocks.
Keywords: JMA unified seismic catalog, Automatic hypocenter determination, 2016 Kumamoto earthquake, Completeness magnitude
© The Author(s) 2018. This article is distributed under the terms of the Creative Commons Attribution 4.0 International License (http://creat iveco mmons .org/licen ses/by/4.0/), which permits unrestricted use, distribution, and reproduction in any medium, provided you give appropriate credit to the original author(s) and the source, provide a link to the Creative Commons license, and indicate if changes were made.
Introduction
A high-quality earthquake catalog, consistently com-piled over a wide spatiotemporal range, is an important research tool to analyze the history of seismicity, stand earthquake mechanisms, and elucidate the under-ground structure of seismogenic regions. The Japan Meteorological Agency (JMA) has recorded earthquake data in Japan for over 100 years (e.g., Schorlemmer et al. 2018). In October 1997, after the 1995 Kobe earth-quake, the JMA started to produce a consistent catalog of seismic events (hereafter the JMA unified catalog) in cooperation with the Ministry of Education, Cul-ture, Sports, Science and Technology (MEXT), by using seismic waveforms recorded by the JMA, the National
Research Institute for Earth Science and Disaster Resil-ience (NIED), universities, and other institutes. The JMA unified catalog is published and routinely updated on the web (JMA 2018) and is widely used for research, promo-tion of disaster prevenpromo-tion activities, and other purposes. The 2011 Mw 9.0 Tohoku earthquake produced an enormous number of aftershocks and induced earth-quakes in and around Japan. Because all hypocenters required a visual check before being added to the catalog, publication of the catalog was considerably delayed. To cope with this situation, the catalog was limited to events within the Tohoku region of M≥ 2 (JMA magnitude) for inland locations and M≥ 3 for offshore areas. Nev-ertheless, it took over 2 years to determine over 250,000 hypocenters that occurred during 2011. In addition, the number of monthly events in the JMA unified catalog doubled after 2000 (Fig. 1) with the deployment of Hi-net observation stations by NIED from 2000 to 2002 (Okada
Open Access
*Correspondence: [email protected]
et al. 2004). The number of detected earthquakes will further increase with the deployment of seafloor seis-mic observation stations such as those in DONET1 and DONET2, developed by the Japan Agency for Marine-Earth Science and Technology (JAMSTEC) and oper-ated by NIED, and S-net, developed and operoper-ated by NIED. To aid prompt processing of large amounts of data from these high-sensitivity seismic networks, the Earth-quake Research Committee (ERC) of the Headquarters for Earthquake Research Promotion of Japan established three policies: (1) maintaining the present detection lim-its of the catalog, (2) cataloging all detected earthquakes, and (3) categorizing events based on a quality control procedure (ERC 2014). Based on these policies, in April 2016 the JMA adopted the Phase combination Forward search method (PF method; Tamaribuchi et al. 2016) for automatic hypocenter determination to streamline pro-duction of the JMA unified catalog. The PF method can detect simultaneously occurring earthquakes by using a Bayesian estimation approach. Details of this method are described in “Methods” section and Additional file 1.
Automatically processed hypocenters are added to the JMA unified catalog after quality control by visual inspection and the assignment of a status flag to each event that characterizes its magnitude and accuracy. The procedure for large events did not change in April 2016; that is, all events greater than the threshold magnitude (such as Mth = 1.7 in shallow inland areas and increasing to Mth = 3.5 with distance from land; see also JMA 2018
in detail) are visually inspected before inclusion in the catalog. For events smaller than the threshold magnitude,
the automatically estimated hypocenter is cataloged when the inspector finds that it was properly determined. Hypocenters that are not properly determined can still be cataloged after a simple review. With this change in pro-cedure, the magnitude limitation in the Tohoku earth-quake aftershock area was canceled at the end of March 2016.
Enough time has elapsed since the change in the cata-log procedure to evaluate whether the new procedure caused a systematic bias in the quality of the JMA unified catalog. This evaluation, reported in this paper, is impor-tant to ensure the continued reliability of the JMA unified catalog for seismic research. In addition, it is important to evaluate the use of initial hypocenter determinations (before visual inspection) for real-time monitoring of seismic activity, especially for the abundant aftershocks of large events. In this paper, we use the M 7.3 Kuma-moto earthquake sequence in April and May 2016 as a case study.
Methods
The PF method was described by Tamaribuchi et al. (2016) in Japanese, so for convenience a description in English is presented in Additional file 1. Here we will focus on the conventional group trigger method (GT method), previously used for the JMA catalog since its beginning in October 1997, and describe its problems and their solutions by using the PF method.
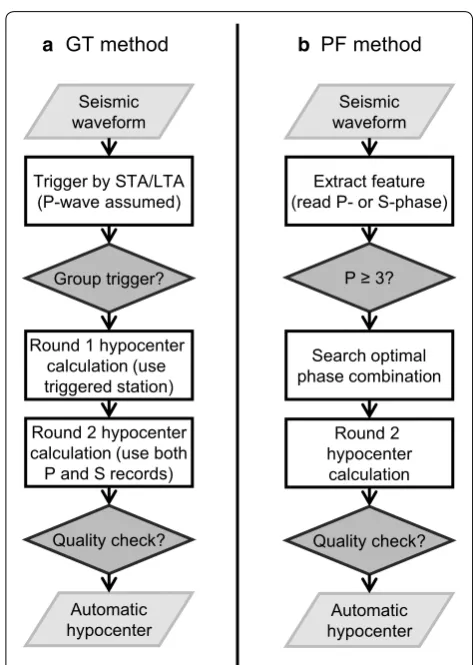
Figure 2 presents flow diagrams for the GT and PF methods. In the GT method, the ratio of the long-term average (LTA) to short-term average (STA) amplitude, or STA/LTA (e.g., Allen 1978), is calculated for seismic waveforms at each observation station, and when the ratio exceeds a threshold value, the observation station is regarded as triggered. When a certain number of stations are triggered within a certain time range within a prede-fined group of stations (for example, four or more sta-tions are triggered within 120 s), it is defined as an event detection. At this point, the trigger time at each station is taken as the P-phase arrival time and a hypocenter is cal-culated from the P-phases (first-round hypocenter calcu-lation). On the basis of the theoretical travel times from this initial hypocenter estimation, P-wave and S-wave arrivals are automatically picked again and a revised hypocenter is calculated from the P- and S-phases (sec-ond-round hypocenter calculation). Phase-picking is repeated, based on travel times from successively revised hypocenters, until the hypocenters converge to a stable location. An advantage of the GT method is that it is possible to exclude local noise that affects a single sta-tion. Also, even when the hypocenter does not converge, an event detection can alert the operators to perform a visual inspection and correctly determine the hypocenter. All events
M ≥ 1 M ≥ 2
Year
Because the GT method assumes that noise rarely occurs at the same time as earthquakes, it can ignore isolated local noise. However, when an earthquake and noise coincide, or when two or more earthquakes occur simultaneously, the method leads to incorrect locations in the first-round hypocenter calculation. Also, when many earthquakes occur, such as during aftershocks and swarms, the LTA value is high, so the detection capabil-ity of the method is degraded. Consequently, after large earthquakes, the GT method failed to detect some events and operators were required to check continuous seismic waveforms visually.
The PF method has two characteristic functions: (1) a feature extraction step that chooses candidate P- or S-phase arrival times without reference to STA/LTA, and (2) a hypocenter determination step that chooses the optimal combination of phases from the candidate arrival times and the maximum amplitudes recorded near those times. Details of the method are described in Additional file 1.
Because the PF method is relatively deficient in detect-ing slow earthquakes and in determindetect-ing hypocenters in island areas such as the Okinawa region, both the GT and PF methods are used today to detect events and report them to the operator.
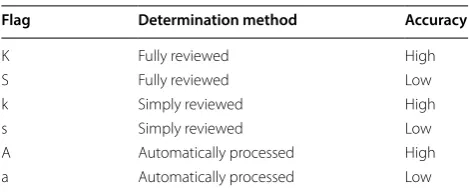
Figure 3 shows the detailed workflow of event iden-tifications, and the flags assigned to each event by the operator are summarized in Table 1. For further details, refer to the online publication of the JMA unified cata-log (JMA 2018). For automatically detected events that are larger than the threshold magnitude, the opera-tor inspects the phases and does a full conventional Trigger by STA/LTA
Fig. 2 Flowchart of automatic hypocenter estimation processes: a GT method and b PF method
Automatic process by GT method Seismic
waveform Event list Full review JMA unifiedcatalog
Automatic process
b Current flow (after April 2016)
hypocenter calculation (“fully reviewed hypocenter”) and assigns it a quality flag of “K” or “S” for high or low accuracy, respectively. For events that are smaller than the threshold magnitude and for which the automati-cally processed phases appear valid, the automatiautomati-cally processed hypocenter is cataloged without modification (“automatically processed hypocenter”) and the opera-tor assigns it a flag of “A” or “a” for high or low accuracy, respectively. If the determination is not good, the opera-tor inspects and corrects the appropriate phases and then calculates the hypocenter (“simply reviewed hypo-center”). Small events are then assigned a flag of “k” or “s” for high or low accuracy, respectively, and large events are fully reviewed as previously described. In this way, all hypocenters are classified on the basis of the detection method and their accuracy, while the capability of con-ventional hypocenter detection is preserved.
Results and evaluation
The monthly number of detected hypocenters nearly doubled after the PF method was introduced (Fig. 1). Although aftershocks of the 2016 Kumamoto earth-quake immediately after the change took place in April 2016 boosted the number of detected hypocenters, the increase persisted through the end of our analytical period in December 2017.
To confirm that the new method improves the detec-tion of seismic events, we performed a detailed analy-sis of the JMA unified catalog in terms of completeness magnitude Mc, the event magnitude above which all
events are reliably detected, using the entire-magni-tude-range (EMR) method proposed by Woessner and Wiemer (2005). In a Monte Carlo approximation of the bootstrap method, we calculated the mean value of Mc from 200 trials, each of which resampled the
catalog by picking at least 50 hypocenters at depths ≤ 50 km, in 1.0° × 1.0° grid cells overlapping by 0.5°. Figure 4a shows maps of Mc values before and after
the procedure changed in April 2016. Mc became
lower in a few places, particularly in coastal areas near the Tohoku earthquake rupture zone, but remained largely unchanged elsewhere. Figure 4b compares the
year-long period before March 2011 with the 21-month period after April 2016 in an effort to avoid the influ-ence of the March 2011 Tohoku earthquake. It shows that Mc was slightly higher than it was before the
earth-quake in and near the rupture area, but slightly lower elsewhere. That was because the seismicity was still high in and near the rupture area (Additional file 1: Fig-ure S2).
An analysis of automatically processed hypocenters in the JMA unified catalog from April 2016 to Decem-ber 2017 (Fig. 5) shows that 63.7% of the events added to the JMA unified catalog had automatically pro-cessed hypocenters (58.5% for flag “A”, 5.2% for flag “a”). Among smaller events (M < Mth), 73.2% had auto-matically processed hypocenters without modification (67.3% for flag “A”, 5.9% for flag “a”), signifying a great improvement in the efficiency of the JMA unified cata-log procedure. Because all hypocenters with M≥Mth must be fully reviewed, all larger events were flagged “K” or “S”.
As a further check, we compared events between April 2016 and December 2017 that were flagged “K” (fully reviewed) in the JMA unified catalog and the hypocenters derived by the PF method before their visual inspection. For this comparison, we chose hypocenter pairs with epicenters ≤ 50 km apart and within 60 s of each other. Among inland and shallow earthquakes (depth ≤ 30 km), which were surrounded by a seismic observation network giving good azimuthal coverage, approximately 90% of automatically processed events were within 1 km of the fully reviewed hypocenters (Fig. 6 and Table 2). Among offshore or deep earthquakes, approximately 90% of auto-matically processed events were within 5 km of the fully reviewed hypocenters. These results show that the cur-rent seismic observation network, installed at an interval of about 20 km, can obtain automatically processed hypo-centers with acceptable reliability. Likewise, there was lit-tle or no bias in the automatic magnitude determinations in almost all areas (Fig. 6b). The automatic hypocenters near Taiwan had relatively high magnitudes compared with the JMA catalog because data delays prevented the use of IRIS stations in the automatic process. Nearly all hypocenters in the Taiwan region therefore required a full review. In the same way, we also compared flagged “k” (simply reviewed) and the hypocenters derived by the PF method (Additional file 1: Table S1). Standard devia-tions of hypocentral location and magnitude are larger than those of fully reviewed hypocenters (Table 2). Also, magnitudes of automatic processing tend to be 0.1 unit greater than those of simply reviewed hypocenters on average. We need not elaborate on this point because the simply review is required only for inaccurate automati-cally processed hypocenters.
Table 1 Hypocenter flags
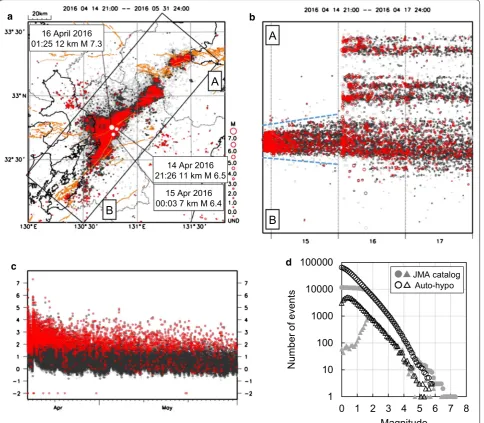
Application to the 2016 Kumamoto earthquake It is instructive to examine the effect of the revised pro-cess in the case of the 2016 Kumamoto earthquake, which occurred immediately after the PF method was incorporated. Figure 7a shows the epicentral distribution of the automatically processed hypocenters. The dataset spans the period from April 14 to May 31, 2016. To sin-gle out the effect of the automatic process in real time, we used the provisional JMA unified catalog of June 6, 2016, as a reference. Because events in the JMA unified catalog must undergo a visual inspection, the number
Comparison of periods before and after the 2016 earthquake
Comparison of periods before and after the 2011 Tohoku earthquake (A) Apr. 2015
to Mar. 2016 (B) Apr. 2016to Dec. 2017 (C) B – A
(A) Mar. 2010
to Feb. 2011 (B) Apr. 2016to Dec. 2017 (C) B – A
a
b
Fig. 4 Distribution of completeness magnitude (Mc); depth range 0–50 km. a Comparison of the periods April 2015 to March 2016 and April 2016 to December 2017, before and after the introduction of the automatic process. b Comparison of March 2010 to February 2011 and April 2016 to December 2017 (before and after the 2011 Tohoku earthquake)
0% 20% 40% 60% 80% 100%
M ≥ Mth M < Mth All
K S k s A a
of events since 14 April in the provisional catalog as of 6 June was 5084, whereas the automatic process detected 69,814 events in that time, of which 54,843 events had time errors within 0.2 s and horizontal errors within 0.5′. During that same period, the GT method detected 18,744 events of which 10,139 had time errors within 0.2 s and horizontal errors within 0.5′. In sum, the PF method determined about five times as many epicenters as the
GT method and an order of magnitude more events than human reviewers could add to the catalog in the 7 weeks after the earthquake series began. We stressed that PF method can determine hypocenters within 3 min from origin time on average.
Figure 7b shows the spatiotemporal distribution of events, with cataloged events shown in red and auto-matically determined events in gray or black. The a Location residual
April 2016 to December 2017 April 2016 to December 2017b Magnitude residual
Fig. 6 Distribution of a location and b magnitude residuals between fully reviewed hypocenters in the JMA unified catalog (flag K, depth range 0–50 km) and their associated automatically processed hypocenters (before visual inspection) from April 2016 to December 2017
Table 2 Residuals between fully reviewed events (flag “K”) in the JMA catalog and their corresponding automatically processed hypocenters by the PF method: a averages (ave.) and standard deviations (σ), b proportions of automatically processed hypocenters within 1 and 5 km and 0.1 and 0.5 units of the fully reviewed hypocentral location and magnitude in the JMA unified catalog, respectively
Latitude (km) Longitude (km) Depth (km) Magnitude
ave. σ ave. σ ave. σ ave. σ
a
All events 0.21 4.31 0.10 4.03 0.13 8.57 − 0.01 0.15 Shallow inland 0.17 3.29 − 0.25 3.25 − 0.09 4.16 − 0.02 0.15 Deep/offshore 0.24 4.80 0.30 4.40 0.25 10.28 − 0.01 0.14
Latitude Longitude Depth Magnitude
< 1 km (%) < 5 km (%) < 1 km (%) < 5 km (%) < 1 km (%) < 5 km (%) < 0.1 unit (%) < 0.5 unit (%)
b
length of the area of seismicity, as bounded by the auto-matically processed hypocenters, expanded from 20 km immediately after the M 6.5 foreshock at 21:26 14 April to about 35 km at 01:25 16 April, just before the M 7.3 mainshock. This trend was also reported by Kato et al. (2016), who used the matched filter technique (Gib-bons and Ringdal 2006). This result shows that the
PF method makes it possible to follow changes in the hypocentral distribution in real time.
Figure 7d graphs the frequency versus magnitude dis-tribution of the automatically processed hypocenters and the events in the provisional JMA unified catalog of June 6, 2016. The two frequency curves are almost identi-cal from M 4 to M 2, but the curve for the JMA unified
1 10 100 1000 10000 100000
0 1 2 3 4 5 6 7 8
Number
of events
Magnitude
a b
d c
16 April 2016 01:25 12 km M 7.3
14 Apr 2016 21:26 11 km M 6.5
15 Apr 2016 00:03 7 km M 6.4
JMA catalog Auto-hypo
A
B
B
A
catalog departs from the Gutenberg–Richter law below M 2 because the catalog did not list small events, whereas automatic processing can detect events as small as M 0.
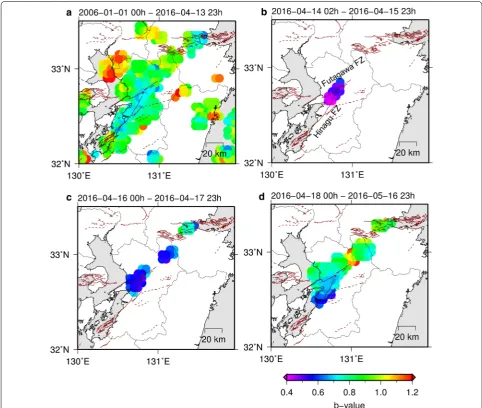
The abundance of small events obtained in real time permits a detailed analysis of seismic activity. Here, we investigated the b-value distribution of the frequency– magnitude distribution, using the maximum likelihood method (Aki 1965; Utsu 1965) and estimating Mc using
the EMR method (Woessner and Wiemer 2005). To estimate the uncertainty of the b-value, we adopted a Monte Carlo approximation of the bootstrap method, calculating the mean and variance of the b-values in 200 trials using resamples (with replacement) from
the automatically processed catalog. We calculated the b-values at points separated by 0.05º, using 100 or more hypocenters within 5 km.
Before the 2016 Kumamoto earthquake sequence, the b-value along the Futagawa–Hinagu fault zone was lower than in other areas (Fig. 8a). Whereas the b-value along the fault zone further decreased after the M 6.5 foreshock on 14 April, it increased after the M 7.3 mainshock on 16 April. Between 18 April and 16 May, the b-value along the Futagawa fault zone, the site of the mainshock rupture (Asano and Iwata 2016; JMA 2017), recovered to its pre-earthquake value. It remained low in the southern part of the Hinagu fault
zone (Fig. 8d), which suggests that stress is still high there (Scholz 1968).
Discussion and conclusion
We have shown that automatic hypocenter determina-tion by the PF method resulted in dramatic gains in pro-duction efficiency of the JMA unified catalog and made possible a new means of real-time monitoring of seismic activity. This capability promises to contribute to future forecasts of earthquake probability, as well as rapid assessment of the extent of aftershock areas and changes in the extent of seismic activity. Combined with quality inspection by human experts, this method yields event determinations as accurate as those from conventional methods.
These automatically processed hypocenters, even before quality inspection, aid analyses of aftershock activities immediately after large earthquakes. In fact, the JMA’s first press release, issued 2 h after the M 6.5 foreshock at 23:30 14 April (JMA 2016), relied on unin-spected hypocenters for the explanation of seismic activ-ity and its relation to the causative fault zone.
This automatic process may also lend itself to forecasts of seismic activity. For example, Omi et al. (2013, 2015,
2016) demonstrated real-time forecasts of aftershock probability by using Bayesian estimates based on the Omori–Utsu formula and the epidemic-type aftershock sequence (ETAS) model (Ogata 1988). Future research should lead to more rapid risk assessment of aftershocks and foreshocks.
There are obvious avenues for further improvement of this automatic process. For example, hypocenter accuracy can benefit from high-precision hypocenter determina-tion techniques such as the double-difference method (Waldhauser and Ellsworth 2000; Yano et al. 2017) and utilization of three-dimensional velocity structures (Kat-sumata 2015), which are growing in importance with the enhancement of ocean bottom seismometer networks (S-net, DONET). In addition, low-frequency earthquakes are not determined by this method. Alternative auto-matic hypocenter determination processes such as the matched filter technique (Gibbons and Ringdal 2006; Shelly et al. 2007; Moriwaki 2017) will be important for those events.
Additional file
Additional file 1: Text S1. Description of PF method. Figure S1. Flow-chart of hypocenter determination process. Figure S2 Temporal variation of completeness magnitude (Mc). Table S1. Residuals between simply reviewed events (flag “k”) in the JMA catalog and their corresponding automatically processed hypocenters by the PF method.
Abbreviations
ETAS: epidemic-type aftershock sequence; GT: group trigger; JMA: Japan Mete-orological Agency; EMR: entire-magnitude-range; ERC: Earthquake Research Committee; M: magnitude; Mc: completeness magnitude; MEXT: Ministry of Education, Culture, Sports, Science and Technology; NIED: National Research Institute for Earth Science and Disaster Resilience; Mth: threshold magnitude; PF: Phase combination Forward search.
Authors’ contributions
KT performed the analysis and wrote the manuscript. The author read and approved the final manuscript.
Acknowledgements
We thank Akio Katsumata for internal reviews and helpful comments. The earthquake catalog is produced by the JMA in cooperation with MEXT. Values of Mc were estimated with an R program coded by Mignan and Woessner (2012). We used the generic mapping tools (GMT) package (Wessel et al. 2013) and hypdsp (Yokoyama 1997) to draw the figures. We are also grateful to Chung-Han Chan, an anonymous reviewer, and Editor Takuto Maeda for their constructive comments.
Competing interests
The author declares no competing interests.
Availability of data and materials
The data used in this article are available at the Data Management Center of NIED (http://www.hinet .bosai .go.jp/?LANG=en) and JMA (http://www.data. jma.go.jp/svd/eqev/data/bulle tin/index _e.html).
Consent for publication Not applicable.
Ethics approval and consent to participate Not applicable.
Funding None.
Publisher’s Note
Springer Nature remains neutral with regard to jurisdictional claims in pub-lished maps and institutional affiliations.
Received: 2 July 2018 Accepted: 23 August 2018
References
Aki K (1965) Maximum likelihood estimate of b in the formula log (N) = a − bM and its confidence limits. Bull Earthq Res Inst Tokyo Univ 43:237–239 Allen RV (1978) Automatic earthquake recognition and timing from single
traces. Bull Seismol Soc Am 68:1521–1532
Asano K, Iwata T (2016) Source rupture processes of the foreshock and main-shock in the 2016 Kumamoto earthquake sequence estimated from the kinematic waveform inversion of strong motion data. Earth Planets Space 68:147. https ://doi.org/10.1186/s4062 3-016-0519-9
Earthquake Research Committee (2014) Report: the improvement of the processing method for the high sensitivity seismic observation data (in Japanese). https ://www.jishi n.go.jp/main/kokan do/kokan do_honpe n.pdf. Accessed 2 May 2018
Gibbons SJ, Ringdal F (2006) The detection of low magnitude seismic events using array-based waveform correlation. Geophys J Int 165:149–166. https ://doi.org/10.1111/j.1365-246X.2006.02865 .x
Japan Meteorological Agency (2016) Press release: the 21:26, April 14, 2016 earthquake (in Japanese). https ://www.jma.go.jp/jma/press /1604/14a/ kaise tsu20 16041 42330 .pdf. Accessed 2 May 2018
https ://www.data.jma.go.jp/svd/eqev/data/sourc eproc ess/event /20160 41601 25054 7near .pdf. Accessed 2 May 2018
Japan Meteorological Agency (2018) The seismological bulletin of Japan. https ://www.data.jma.go.jp/svd/eqev/data/bulle tin/index _e.html. Accessed 2 May 2018
Kato A, Fukuda JI, Nakagawa S, Obara K (2016) Foreshock migration preced-ing the 2016 Mw 7.0 Kumamoto earthquake, Japan. Geophys Res Lett 43(17):8945–8953. https ://doi.org/10.1002/2016G L0700 79
Katsumata A (2015) Fast hypocenter determination in an inhomogeneous velocity structure using a 3D travel-time table. Bull Seismol Soc Am 106:3203–3208. https ://doi.org/10.1785/01201 50122
Mignan A, Woessner J (2012) Estimating the magnitude of completeness for earthquake catalogs. Community Online Resour Stat Seism Anal. https :// doi.org/10.5078/corss a-00180 805
Moriwaki K (2017) Automatic detection of low-frequency earthquakes in southwest Japan using Matched-Filter technique. Quart J Seis 81:3 (in Japanese with English abstract)
Ogata Y (1988) Statistical models for earthquake occurrences and residual analysis for point processes. J Am Stat Assoc 83(401):9–27
Okada Y, Kasahara K, Hori S, Obara K, Sekiguchi S, Fujiwara H, Yamamoto A (2004) Recent progress of seismic observation networks in Japan—Hi-net, F-Japan—Hi-net, K-NET and KiK-net—. Earth Planets Space 56:xv–xxviii. https :// doi.org/10.1186/bf033 53076
Omi T, Ogata Y, Hirata Y, Aihara K (2013) Forecasting large aftershocks within one day after the main shock. Sci Rep 3:2218. https ://doi.org/10.1038/ srep0 2218
Omi T, Ogata Y, Hirata Y, Aihara K (2015) Intermediate-term forecasting of aftershocks from an early aftershock sequence: Bayesian and ensemble forecasting approaches. J Geophys Res Solid Earth 120:2561–2578. https ://doi.org/10.1002/2014J B0114 56
Omi T, Ogata Y, Shiomi K, Enescu B, Sawazaki K, Aihara K (2016) Automatic aftershock forecasting: a test using real-time seismicity data in Japan. Bull Seismol Soc Am 106(6):2450–2458. https ://doi.org/10.1785/01201 60100
Scholz CH (1968) The frequency–magnitude relation of microfracturing in rock and its relation to earthquake. Bull Seismol Soc Am 58(1):399–415 Schorlemmer D, Hirata N, Ishigaki Y, Doi K, Nanjo KZ, Tsuruoka H, Beutin T,
Euchner F (2018) Earthquake detection probabilities in Japan. Bull Seis-mol Soc Am 108(2):702–717. https ://doi.org/10.1785/01201 70110 Shelly DR, Beroza GC, Ide S (2007) Non-volcanic tremor and low-frequency
earthquake swarms. Nature 446:305–307. https ://doi.org/10.1038/natur e0566 6
Tamaribuchi K, Moriwaki K, Ueno H, Tsukada S (2016) Automatic hypocenter determination for the Seismological Bulletin of Japan using Bayesian estimation. Quart J Seis 79:1–13 (in Japanese with English abstract) Utsu T (1965) A method for determining the value of b in a formula log
n = a − bM showing the magnitude–frequency relation for earthquakes. Geophys Bull Hokkaido Univ 13:99–103 (in Japanese)
Waldhauser F, Ellsworth WL (2000) A double-difference earthquake loca-tion algorithm: method and applicaloca-tion to the Northern Hayward Fault, California. Bull Seismol Soc Am 90(6):1353–1368. https ://doi. org/10.1785/01200 00006
Wessel P, Smith WH, Scharroo R, Luis J, Wobbe F (2013) Generic mapping tools: improved version released. EOS Trans Am Geophys Union 94(45):409– 410. https ://doi.org/10.1002/2013E O4500 01
Woessner J, Wiemer S (2005) Assessing the quality of earthquake catalogues: estimating the magnitude of completeness and its uncertainty. Bull Seismol Soc Am 95(2):684–698. https ://doi.org/10.1785/01200 40007 Yano TE, Takeda T, Matsubara M, Shiomi K (2017) Japan unified high-resolution
relocated catalog for earthquakes (JUICE): crustal seismicity beneath the Japanese Islands. Tectonophysics 702:19–28. https ://doi.org/10.1016/j. tecto .2017.02.017