Few-cycle phase-stable infrared OPCPA
Alexander Hermann Schwarz
Few-cycle phase-stable infrared OPCPA
Alexander Hermann Schwarz
Dissertation
an der Fakult¨at f¨ur Physik
der Ludwig–Maximilians–Universit¨at
M¨unchen
vorgelegt von
Alexander Hermann Schwarz
aus Schrobenhausen
Contents
List of Figures xi
List of Tables xiii
Abstract xv
Introduction 1
List of publications by the author . . . 7
1 Theoretical foundations of OPCPA 9 1.1 Ultrafast optics . . . 9
1.1.1 Mode-locked oscillators . . . 9
1.1.2 Ultrafast pulses . . . 12
1.2 Nonlinear optics . . . 14
1.2.1 Second order processes . . . 14
1.2.2 Phase-matching . . . 17
1.2.3 Higher order processes . . . 19
1.2.4 OPCPA . . . 22
2 Seeding OPCPA 23 2.1 The seed laser . . . 23
2.2 Spectral broadening for seeding ultrabroadband OPCPA . . . 26
2.2.1 Spectral broadening by filamentation . . . 26
2.2.2 Spectral broadening in a hollow core fiber . . . 27
2.3 Compression and characterization of the broadened spectra . . . 29
2.4 Phase-stable infrared seed generation . . . 31
2.4.1 DFG using PPLN . . . 31
2.4.2 DFG using BBO . . . 35
3 Pumping OPCPA 39 3.1 Pump laser for OPCPA . . . 40
3.1.1 Motivation of the thin-disk concept for pumping OPCPA . . . 40
vi CONTENTS
3.1.3 Chaotic behavior of cw pumped regenerative amplifiers . . . 43
3.2 Short characterization of the pump laser . . . 44
3.2.1 Consequences of high B-integral . . . 44
3.2.2 Beam profiles,M2 . . . 47
3.2.3 Beam pointing . . . 49
4 Synchronizing OPCPA 51 4.1 Electronic synchronization . . . 51
4.1.1 Timing hardware used . . . 51
4.1.2 Seed laser . . . 52
4.1.3 Pump laser . . . 52
4.2 Dazzler (AOPDF) . . . 53
4.2.1 Electronic triggering . . . 53
4.2.2 Dispersion calibration . . . 54
4.2.3 CEP control . . . 55
4.3 Optical synchronization . . . 56
4.3.1 Setup . . . 56
4.3.2 Limits of optical synchronization . . . 57
4.3.3 Measuring technique . . . 58
4.3.4 Software-based feedback loop . . . 59
4.3.5 Hardware-based feedback loop . . . 62
4.3.6 In-loop and out-of-loop performance . . . 65
4.3.7 Conclusions and outlook . . . 67
5 Building an infrared few-cycle OPCPA 71 5.1 Overview . . . 71
5.2 Stretching . . . 71
5.3 Amplification . . . 74
5.4 Compression . . . 77
5.5 CEP characterization . . . 81
6 First prototype experiment: controlling currents in a dielectric using IR few-cycle pulses 85 6.1 Current control theory . . . 85
6.2 Experimental setup . . . 87
6.3 Experiment . . . 89
6.4 Discussion and conclusions . . . 91
7 Generation of phase-stable continua spanning three octaves 93 7.1 Motivation for super-octave spectra centered in the NIR . . . 93
7.2 Boosting the OPCPA output to mJ level . . . 94
7.2.1 Broadband amplification using bulk lithium niobate . . . 94
Contents vii
7.3 Indications of spectral broadening in the NIR . . . 99
7.3.1 Onset of THG . . . 99
7.3.2 Onset of fifth harmonic and blue white light . . . 100
7.4 Generation of a super-octave continuum . . . 101
7.4.1 Experimental setup . . . 101
7.4.2 Issues with beam profile . . . 101
7.4.3 Increasing the pressure . . . 102
7.4.4 Phase stability . . . 104
7.4.5 Pulse characterization . . . 105
7.4.6 Brief results in a filament and differences . . . 106
7.4.7 Discussion and conclusions . . . 108
Conclusions and Outlook 112 A Used Acronyms 117 B Optics used in the manuscript 119 B.1 Linear and nonlinear materials . . . 119
B.2 NIR filters . . . 120
B.3 Silicon compressor . . . 121
C Calibration 123 C.1 Calibration of PSDs . . . 123
C.2 Spectrometer calibration procedure . . . 124
C.2.1 Additional diagnostics . . . 124
D Self-diffraction in QPM OPCPA 125
Data archiving 127
Bibliography 129
Acknowledgments 138
List of Figures
1 Overview of MS (illustration) . . . 6
1.1 DFG seed generation (illustration) . . . 12
1.2 Coupled wave equations (OPACWEpic) . . . 16
1.3 OPA gain (OPCAgainspectrumpic) . . . 18
2.1 Seed generation (illustration) . . . 24
2.2 FROG of seed amplifier (frogfp2pic) . . . 24
2.3 Beam pointing of seed amplifier (fp2beampointingpic) . . . 25
2.4 Spectrum of filamentation (filamentspectrumpic) . . . 27
2.5 Spectrum of HCF (HCFplot) . . . 28
2.6 XFROG of filament and HCF (XFROGpic) . . . 30
2.7 Stability of PPLN DFG signal (instabilityofDFG) . . . 32
2.8 Interference between DFG and SPM (spmdfgbeating) . . . 33
2.9 DFG signal and distortion (dfgsignalanddistortion) . . . 34
2.10 XFROG of PPLN DFG (PPLNDFGXFROG) . . . 35
2.11 BBO DFG output (BBODFGXFROG,BBODFGBEAM) . . . 36
2.12 f-2f BBO DFG (BBODFGf-2f) . . . 37
3.1 Pump laser scheme (illustration) . . . 41
3.2 Buildup in cavity (diskpulsebuildup) . . . 42
3.3 The Route to chaos (illustration) . . . 43
3.4 Bifurcation of pulse energy (bifurcationpic) . . . 44
3.5 FROG of pump laser (disklaserFROG) . . . 46
3.6 Beam profiles pump laser (beamprofilesdisklaserpic) . . . 48
3.7 M2measurement of pump laser (m2measurementpic) . . . 49
3.8 Beam pointing of pump laser (diskbeampointingpic1) . . . 50
4.1 Electronic synchronization (illustration) . . . 52
4.2 Effect of electronic jitter (DazzlerPLL) . . . 54
4.3 GD compensation (DazzlerSI) . . . 55
4.4 CEP modulation with AOPDF (DazzlerCEP) . . . 56
4.5 Optical synchronization (illustration) . . . 57
x LIST OF FIGURES
4.7 Setup PC-based synchronization (illustration) . . . 60
4.8 Long-term drift (slowdriftpic) . . . 60
4.9 Timing jitter using PC (LVjitterpic) . . . 62
4.10 Hardware based synchronization (illustration) . . . 63
4.11 Temporal jitter on PSD (jitterpsd) . . . 65
4.12 FFT of timing jitter (jitterpsdfft) . . . 66
4.13 Out-of-loop jitter setup (illustration) . . . 67
4.14 Out-of-loop timing jitter (externalandinternal) . . . 68
5.1 OPCPA setup (illustration) . . . 72
5.2 XFROG of chirped seed (chirpedXFROG) . . . 73
5.3 Beam profile seed (1ststageseed) . . . 74
5.4 Pump and output of first stage (1ststagepump,1ststageoutput) . . . 75
5.5 Pump profile second stage, OPCPA spectra (2ndstagepump, OPCPAspec) . . . . 76
5.6 XFROG of compressed OPCPA (xfrogcompressed) . . . 77
5.7 SH FROG of compressed OPCPA (SHFROG2ndstage) . . . 78
5.8 Phase applied by AOPDF (Dazzlerphase) . . . 80
5.9 CEP of OPCPA with synchronization (f-2fdelaystabon) . . . 83
5.10 CEP of OPCPA without synchronization (f-2fdelaystaboff) . . . 84
6.1 Setup of Experiment (illustration) . . . 87
6.2 OPCPA focus profile (currentcontrol) . . . 88
6.3 Measured current (currentpic) . . . 89
6.4 Scan over power (currentpowerscan) . . . 91
7.1 Bandwidth of 3rd stage (longandshortopa) . . . 95
7.2 Stability third stage (3rdstagestabilitybeamprofilepic) . . . 96
7.3 Pump and seed profile 3rd stage (3rdstagepumpseed) . . . 97
7.4 SF level 3rd stage (3rdstageSF) . . . 97
7.5 Spectrum of TH (MIRHCFTHFH) . . . 100
7.6 Fifth harmonic (UVbehaviour) . . . 100
7.7 Setup spectral broadening (illustration) . . . 102
7.8 Spectrum over pressure (pressurescan/software calibration) . . . 103
7.9 Cumulative sum (pressurescan/software calibration, HCFoutputmodeIR) . . . . 103
7.10 CEP of broadened spectrum (HCFMIRf-2f) . . . 104
7.11 SH FROG of broadened spectrum (MIRHCFSHFROG) . . . 106
7.12 XFROG of filament broadening (XFROGIRfilamentpic) . . . 107
7.13 Spectrum of filament broadening (filamentspectrum) . . . 108
B.1 NIR filter transmissions (FEL1500) . . . 120
B.2 Compressor transmissions (siliconcompressor) . . . 121
List of Figures xi
List of Tables
Abstract
Few-cycle laser pulses are an important tool for investigating laser-matter interactions. Apart from the mere resolution used in time-resolved processes, owing to this approach table-top sources nowadays can reach the limits of the perturbative regime and therewith enable extreme nonlinear optics. In the visible domain, femtosecond technology over the last decades has quickly developed, in recent years leading to the routine generation of carrier-envelope phase (CEP) sta-ble few-cycle laser pulses at high energies, using ubiquitous Ti:Sapphire amplifiers.
Near to mid-infrared few-cycle pulses in contrast can be employed for investigating interactions in the tunneling regime. The ponderomotive potential of the infrared light field allows quivered charged particles to acquire large energies, leading to applications like the generation of isolated attosecond pulses in the water window. In this wavelength regime however, the required sources are yet to be demonstrated or at least matured. The best candidate for few-cycle pulses in this domain is optical parametric amplification.
This work describes the development of an optical parametric chirped pulse amplifier (OPCPA), used to create CEP-stable few-cycle pulses in the near infrared (NIR).
It covers all essential parts of the system. First the signal pulses are generated from ultrashort lasers using spectral broadening techniques in chapter 2. After compression of these white light continua, intra-pulse broadband difference frequency generation yields CEP stable infrared pulses spanning over more than one octave.
A thin-disk-based pump laser provides ample pump energy (20 mJ) at pulse durations around 1.5 ps. Its characterization and optimization for OPCPA is performed in chapter 3. The high peak energy of this pump laser leads to the buildup of optical nonlinearities and consequently shows distinct influence on the OPCPA system performance.
The synchronization of the OPCPA pump and seed laser system is the topic of chapter 4. This chapter is not limited to NIR systems, but demonstrates enhanced (actively stabilized) synchro-nization of the jitter between pump and seed pulses toσ=24 fs, which later results in improved output stability.
xvi Abstract
As a first prototype (cutting edge) experiment, CEP dependent sub-fs currents in a dielectric are generated in chapter 6 using the developed light source. The results compared well to visible few-cycle laser sources and demonstrate the usability of the OPCPA system (beyond the charac-terizations of chapter 5) for investigating sub-cycle carrier dynamics in dielectrics.
For the same purpose, to generate the currently most broadband NIR continua at kHz repetition rates and mJ-level pulse energies, the OPCPA system is further boosted and efficiently broadened to three optical octaves using a hollow core fiber setup (described in chapter 7). The spectral phase is characterized and demonstrates self-compression in the NIR around 1.3µm. The process provides CEP-stable sub-2-cycle pulses in this regime directly, the shortest and most powerful reported to date.
Zusammenfassung
Die Femtosekunden-Technologie hat sich in den letzten Jahrzehnten schnell fortentwickelt, vor allem im sichtbaren Wellenl¨angen-Bereich. Speziell moderne Titanium-Saphir Verst¨arker haben zuletzt zu (Tr¨ager-Einh¨ullenden-) phasenstabilen und hochenergetischen Laserpulsen gef¨uhrt, die nur noch aus einzelnen optischen Zyklen bestehen. Diese erlauben die Investigation extrem nichtlinearer optischer Prozesse im Regime der Multiphotonenionisation.
Um weiter im Infraroten Prozesse im Regime der Tunnelionisation zu untersuchen, fehlt es je-doch nach wie vor an Lichtquellen mit ¨ahnlichen Characteristiken f¨ur Anwendungen wie die Generation von isolierten Attosekunden-Pulsen im Wasser-Transmissions-Fenster. Hier bietet die optische parametrische Verst¨arkung bisher die gr¨oßten Perspektiven.
Diese Arbeit besch¨aftigt sich mit der Entwicklung eines optischen parametrischen Verst¨arkers mit gestreckten Pulsen (engl.: optical parametric chirped pulse amplifier, OPCPA), der TE-phasen-stabile Pulse mit wenigen optischen Zyklen im nahen Infraroten erzeugt.
Alle wesentlichen Teile des Systems werden beschrieben. Zuerst wird der Saat-Puls durch die spektrale Verbreiterung eines Titanium-Saphir Verst¨arkers gewonnen. Nach der Kompression des generierten Weißlichts f¨uhrt die breitbandige Differenz-Frequenz-Generation (DFG) des Pulses mit sich selbst zu TE-phasen-stabilen Infrarot-Pulsen, deren Spektrum mehr als eine optische Oktave aufspannt.
Ein Scheiben-Laser liefert die Pumpenergie (20 mJ) bei einer Pulsdauer von ca. 1.5 ps. Seine Charakterisierung und Optimierung f¨ur die OPCPA erfolgt in Kapitel 3. Die hohen Spitzeninten-sit¨aten dieses Pumplasers f¨uhren zum Akkumulieren optischer Nichtlinearit¨aten und beeinflussen die OPCPA im Folgenden negativ.
Die Synchronisation von OPCPA Pump- und Saat-Lasern ist das Thema von Kapitel 4. Es demonstriert eine aktive Stabilisierung des zeitlichen ¨Uberlapps beider Pulse, der den gesamten Prozess im Folgenden stabilisiert, und ist nicht auf den Einsatz im Infraroten beschr¨ankt, sondern f¨ur die meisten OPCPA Systeme anwendbar.
xviii Abstract
als außerordentlich kurz- und langzeitstabil.
Kapitel 6 demonstriert dann die M¨oglichkeiten des neuen Systems mit einem technisch anspruchsvollen Experiment. TE-phasen-abh¨angige Str¨ome mit einer Lebenszeit auf der Skala von Attosekunden werden in einem Dielektrikum erzeugt und gemessen. Die Resultate stimmen gut mit den bere-its gemessenen Werten im sichtbaren Bereich ¨uberein und demonstrieren die M¨oglichkeiten und Einsetzbarkeit des Systems.
F¨ur ¨ahnliche Anwendungen, allerdings bei noch h¨oheren Intensit¨aten, wird in Kapitel 7 das OPCPA-System weiter verst¨arkt. Die spektrale Verbreiterung in einer gas-gef¨ullten Hohlfaser erzeugt ein Kontinuum ¨uber drei optische Oktaven. Dessen spektrale Phase wird im Folgen-den charakterisiert und zeigt Selbstkompression bei einer Wellenl¨ange von 1.3µm. Der Prozess erzeugt TE-phasen-stabile Pulse k¨urzer also zwei optische Zyklen, welche die k¨urzesten und intensivsten darstellen, die in diesem Bereich bislang erzeugt wurden.
Introduction
Applications of phase-stable infrared few-cycle sources
Few-cycle laser pulses have developed into one of the most powerful tools to gain insight into the dynamics of electrons in solids and atoms. However, they are not young as one might expect. In fact, the first pulses below 10 fs were already achieved in 1985 [75] by broadening the spectrum of an amplified dye laser in a single-mode fiber. For modern solid-state Ti:Sapphire technology however, it took until 1995 [130] to obtain equally short pulses, nevertheless this was achieved without the need for extra-cavity self-phase-modulation.
Thanks to the tremendous energy scaling of this technology, the intensities attainable using this approach are over 1014 W/cm2 and allowed the generation of XUV attosecond pulses in 2001 for
the first time [53]. Isolated attosecond pulses are generated by spectral filtering of high har-monic generation (HHG) produced by sub-two-cycle pulses [78]. Relying on the very same approach, nowadays phase-stable, sub-two-cycle sources are routinely employed to generate isolated attosecond pulses, used for time-resolved XUV spectroscopy of electrons from atomic photo-emission [117] and the surfaces of solids [17]. So again, broadening in a fiber after more narrowband amplification proved to be the ultimate solution in short pulse generation. Unfortu-nately, like in 1985, this approach is not scalable in energy (and power) indefinitely.
One path to higher energy ultra-broadband sources is optical parametric amplification (OPA). In 2002 4 fs pulses were achieved by Baltuska et al. [5] in a non-collinear optical parametric am-plifier (NOPA). This early demonstrated the bandwidth potential of OPA. Nowadays, the record for OPA sources is 2.2 fs compressing the second harmonic of the idler of a visible NOPA [95]. This is very close to the shortest visible pulses attained (and published) to date at 2.08 fs using waveform synthesis of a Ti:Sapphire-generated hollow-core-fiber-broadened white light contin-uum [50]. Furthermore, OPCPA can push not only the bandwidth, but also energy and average power limits by using chirped pulse amplification, no energy storage in the crystal and high gain. Using favorable phase-matching conditions it offers bandwidths of one octave [95, 111] (or even 1.5 octaves [49] using two-color pumping). This allows sub-cycle pulses (in the VIS to NIR) directly out of a scalable laser source when using appropriate waveform synthesis. Nowadays, in the visible regime, energy scaling [54, 120] and field synthesis [50, 104] are obviously more of a challenge than the bare bandwidth to be generated.
2 Abstract
ultimate pulse characterization methods as they allow the direct reconstruction of the temporal electric field with unmatched bandwidth of up to 1 PHz [71], which trumps low-order nonlinear pulse and phase characterization methods. The downside however, is that they require ample intensity to generate attosecond pulses for their characterization.
While HHG flux can be scaled up with increasing pulse energies [120], the filtered cut-off fre-quency for isolated attosecond pulses scales ashνcuto f f = Ip+3.17Up, where
Up =
e2E2
4meω2
(1)
is the ponderomotive energy andIpis the ionization potential. In order to shift the cut-offtowards
higher energies, the electric field and wavelength can be scaled. However, simply increasing the fluence with conventional Ti:Sapphire based sources produces a lot of ionization of the noble gas, which was observed as very detrimental to the process. In fact, loss of coherence was ob-served by mere energy scaling of the attosecond driver, using an OPCPA system around 800 nm [61]. Furthermore, the lack of phase-matching for high energy HHG with these short-wavelength drivers only permits low flux [102, 121].
While pure energy scaling does therefore not appear promising, asUp ∝ ILλ2L, scaling the
wave-length is a method of extending the HHG cut-offto the so-called “water window” between the K-absorption edges of carbon and oxygen (280 eV and 540 eV) [102]. This spectral region is es-pecially attractive for biological samples, since the difference in absorption of water and carbon is large there and results in good contrast for (sub-fs) time-resolved soft X-ray microscopy. Also these highly energetic photons could eventually probe inner shell electron dynamics with few-as precision. The quest for a suitable driver of soft x-ray attosecond pulses however is still ongoing. As much as nature uses the very large trajectories of long-wavelength drivers [102] to gain high photon energies, it punishes them at the same time with a heavily reduced single-atom HHG yield proportional to≈ λ−6.5[122]. Only very recently it was shown [102] that this low single-emitter
yield could be compensated by scaling of the harmonic emitter density in fiber geometries, as higher photon energies suffer less from re-absorption and ionization of the medium.
To generate isolated attosecond water window XUV pulses, so far no powerful enough sub-two-cycle driver laser was available. As laser crystals with a suitable amplification bandwidth are lacking in the MIR, the pulse durations in this regime generated by conventional lasers are far away from being reduced to a few field cycles. What makes OPA very attractive in this regard are phase-matchable regions in the NIR and MIR, where parametric sources are the only method of gaining broad compressible spectra. Therefore IR OPCPA seems to be the only path to obtain these potential attosecond drivers, at least until attosecond pulses from techniques like coherent wake emission or relativistically oscillating mirrors [51] (and their corresponding driver lasers) are available and matured enough to be suitable for attosecond experiments.
Abstract 3
Furthermore the emitted bursts were broadened to femtosecond durations, requiring further lossy attosecond chirped mirrors [47] in order to generate few-as pulses.
An interesting feature discovered in [102] is that IR pulses can self-compress (temporally and spatially) inside the fiber geometry. Since even the most favorable OPA phase-matching schemes are limited to about one octave, the generation of sub-cycle features (also called light-wave en-gineering) in the NIR and MIR to probe the most delicate electron dynamics requires either synchronization of several OPA sources [59] or further spectral broadening after amplification [50]. While wavelength extension of common Ti:Sapphire based sources is limited, long-wavelength drivers were recently shown to be easily expandable down to the UV with well known schemes like filamentation (in gases [68] and solids [124]). Using hollow core fibers, tempo-ral self-compression was observed in chapter 7 as well while broadening our amplified spectra around 2.1µm to three octaves from MIR to UV. Combined with a target geometry similar to the one used in [102], this should be the ideal driver for isolated attosecond pulses in the soft X-ray regime. Furthermore, after waveform synthesis, it should enable even sub-cycle dynamics to be investigated.
Apart from HHG, there are other highly nonlinear applications that demand few-cycle phase-stable pulses as well. Recently, electrons emitted by a nanoscale tungsten tip were accelerated up to 13 eV [81] using a standard Ti:Sa oscillator. The process showed to be extremely phase-dependent, motivating the use of inherently phase-stabilized sources [19]. Scaling of the wave-length [55] would enable energies of several tens of eV and eventually time-resolved surface science techniques with attosecond temporal and nanometer spatial resolutions.
A tool for not only the observation of electrons but also their control inside solids is the motiva-tion for this manuscript. At the same time ample pulse energy is needed to reach intensity levels allowing for the before-mentioned attosecond-based pulse characterization techniques. After all, controlling the system under investigation first needs perfect control of the light source. As the interesting electron dynamics are expected to happen on a few-femtosecond to attosecond timescale these experiments demand extremely short pulses. In dielectrics and wide-gap semi-conductors the possible wavelength-range is however limited to visible and infrared light sources, due to linear and nonlinear absorption processes that would otherwise damage the system under investigation. Generating NIR to MIR electrical fields with sub-cycle control should enable us to push the limits of high-speed metrology [71] and solid-state signal processing [50] towards the petahertz realm.
4 Abstract
to electron-phonon scattering, depending on material parameters), the half-cycle of the driving field should be shorter, dictating IR sub-two-cycle sources. The direction of NIR OPCPA as pursued in this manuscript has lead to the generation of sub-two-cycle pulses around 2.1µm (without external broadening). And in chapter 6 this source demonstrates its capability in a first prototypical ultrafast current control experiment.
General broadband OPCPA considerations
Apart from concentrating on the IR domain, also some general employable techniques for broad-band OPCPA are demonstrated in this manuscript.
Abstract 5
Structure of the thesis
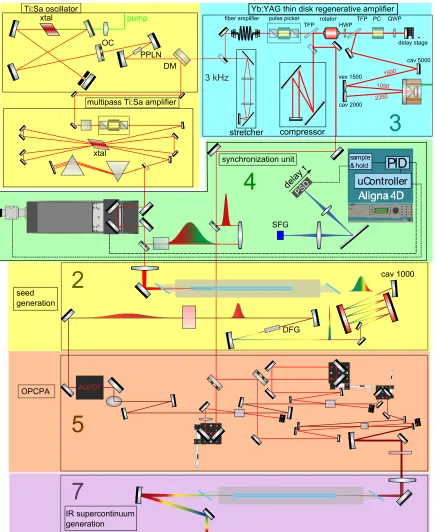
Figure 1 sketches out most of the contents of this thesis. Chapter 1 gives an introduction into few-cycle pulses and OPCPA. Chapter 2 will describe the seed generation of super-octave phase-stable NIR/MIR continua. As their energies are still below the µJ level, further amplification in OPCPA is pursued in the following chapters:
6 Abstract
Abstract 7
List of publications by the author
This thesis is based on the following journal papers:
T. Metzger, A. Schwarz, C.Y. Teisset, D. Sutter, A. Killi, R. Kienberger und F. Krausz, Opt. Lett. 34(2009), 2123.
Thomas Metzger performed the experimental setup and laser characterization together with me (who joined the project later) and Catherine Teisset (who left the project before), I analyzed measured data, wrote Matlab evaluation scripts and assisted in the preparation of the manuscript.
A. Schwarz, M. Ueffing, Y. Deng, X. Gu, H. Fattahi, T. Metzger, M. Ossiander, F. Krausz und R. Kienberger,Opt. Express20(2012), 5557
I performed the first experimental measurements for this publication together with Xun Gu. The idea for the synchronization method was devised by me and setup together with Moritz Ueffing in the course of his Diploma thesis [140]. The final characterization of the system for the manuscript was performed by both Moritz and me with the help of other authors. The manuscript itself was prepared by me with the support of Moritz and the other authors.
Y. Deng, A. Schwarz, H. Fattahi, M. Ueffing, X. Gu, M. Ossiander, T. Metzger, V. Pervak, H. Ishizuki, T. Taira, T. Kobayashi, G. Marcus, F. Krausz, R. Kienberger und N. Karpowicz, Opt. Lett. 37(2012), 4973.
The experimental work was performed by Yunpei Deng and me together with temporary support of Xun Gu, Gilad Marcus, Moritz Ueffing and Hanieh Fattahi (in chronological order). The data was analyzed by both Yunpei Deng and me and I contributed in the preparation of the manuscript.
The following publication is not in the scope of this thesis:
H. Fattahi,A. Schwarz, S. Keiber, and N. Karpowicz,Opt. Lett. 38(2013), 4216.
8 Abstract
Chapter 1
Theoretical foundations of OPCPA
1.1
Ultrafast optics
1.1.1
Mode-locked oscillators
The fundamental source of all the ultrashort pulses generated, characterized and applied in this manuscript is a mode-locked oscillator. Different kinds of intensity-dependent modulations were developed over the years to force an optical cavity into producing short pulses. Nowadays, Kerr lens mode-locking (KLM) is the fastest mechanism employed, leading (together with Ti:Sa as gain material) to the shortest generated pulses (without extra-cavity spectral broadening) [105] between one and two optical cycles.
What happens in mode-locking is that the cavity modes (defined by the cavity roundtrip time
τRT) are spaced by τ1
RT and are excited in phase. Now as opposed to CW lasing, where several
of these modes are lasing (due to broadening mechanisms of the gain material) in an incoherent fashion (meaning there is not fixed phase relationship between these modes), for mode-locking the phase of the modes on this ”frequency comb” are locked together. In Fourier space (time), this then leads to pulses being generated at a repetition rate of τ1
RT.
The emission spectrum of the titanium doped sapphire crystal is extremely broad. It is also called a vibronic medium, since the electronic energy levels of Ti+couple with the vibrational energy levels of the sapphire host; this is what makes it lase [141]. It allows locking many modes in frequency (from 660 to 1180 nm) and therefore the generation of the shortest pulses (since pulse durationtp ∝ 2π1∆ν) of any gain material so far. However, the mismatch between supported cavity
10 1. Theoretical foundations of OPCPA
The carrier-envelope-phase (CEP)
The consequence of locking these modes together in the time domain is that an ultrashort pulse is traveling inside the cavity. A part of it is ejected through an output coupler every round trip. Although the pulse needs to retain its duration after every round trip (in order to not cease the mode-locking induced by Kerr-lensing; this mechanism takes care of the soliton-like behavior of the pulse by nonlinear optical effects like self-steepening and self phase modulation), it still experiences material dispersion inside the cavity. This leads to a mismatch between phase expe-rienced by the carrier and envelope of the pulse, effectively changing the shape of the electrical field every round trip, in a manner characterized by the carrier envelope phase. In the frequency domain it is represented by the carrier-envelope offset frequency fceo, the offset in the frequency
comb of the laser modes with respect to zero frequency. To understand this, we have to consider that all generated fundamental continua in the following chapters were derived from amplified mode-locked seed pulses. As mentioned earlier, the process of mode-locking leads to equally spaced cavity modes fi = fceo+i frep, obviously separated by the inverse repetition rate of the
laser (being the time the pulse takes to finish one round trip). Spectra for stable, repetitive pulses need to be not continuous, but actually consist out of (very many) equally spaced frequencies. For CW lasers, the continua would still consist out of cavity modes, but there the mode-spacing is determined by the refractive index at each individual frequency. fceo is the carrier frequency
offset that this so-called frequency comb experiences, given by ([100]):
fceo =
∆φcep mod2π
2π frep (1.1)
It can assume values from 0 to frepand leads to the definition of the carrier envelope phase∆φcep,
as being the change in carrier envelope phase between two adjacent pulses that is acquired each round trip (during the period τ1
RT) in the mode-locked oscillator. Therefore each pulse from the
pulse-train of the laser has a different CEP, unless actively controlled (i.e. stabilized to fceo =0).
Whereas the absolute phase of the pulse is not interesting (since it is oscillating over propagation anyway), the relative phase between the carrier frequency and the pulse envelope defines the shape of the electric field of the pulse. Note that∆φcepis a relative value, so both a change in the
envelope (with respect to the carrier), for example by dispersion of the pulse, as well as a pure shift of the carrier (without changing the envelope at all, used for example in section 4.2.3) can lead to a CEP shift. This is also obvious in eq. (1.2), whereτis the group delay.
As for short laser pulses the electrical field amplitude is often desired to stay constant for ev-ery laser pulse (especially for high fields where the field rather than the envelope becomes the decisive quantity, like in chapter 6), one is interested in locking the carrier envelope phase. The good news is that the CEP is preserved in typical (laser and OPA) amplification (see eq. (1.16), where the phase of the signal only depends on its initial phase, not on pump or idler phase) and broadening concepts (broadening by self phase modulation does not influence the CEP, when all fields taking part are phase-locked, see eq. (1.22)).
1.1 Ultrafast optics 11
(section 4.3.2) or beam pointing fluctuations when coupling to a HCF (section 7.4.4) will degrade the phase stability.
The carrier-envelope offset can be measured relatively easy with nonlinear interferometers. Since frequency conversion works on the frequency axis, processes like SHG will exactly double the frequency, therefore also double the CE offset. Whenever components of both (fundamental
IFF(ω) and second harmonic IS H(ω)) frequency combs are interfering (in this f-2f
interferom-eter), the fringes that are visible at a delayτcontain information about the relative CEP∆φcep .
This leads to interference for frequencies aroundωlike given in [19]:
I(ω)= IFF(ω)+IS H(ω)+2
p
IFF(ω)IS H(ω) cos(ωτ+ ∆φcep) (1.2)
Similarly, one can build f-3f and f-0 interferometers using THG and DFG. Since the spectral width is not always sufficient for both combs to overlap, there is often another broadening stage integrated into the setup. Furthermore (as illustrated in fig. 1.1), when the input spectral band-width reaches one octave, difference frequencies will overlap with fundamental ones. Spectral interference will then lead to beating between both continua (given that their relative CEP is unstabilized) in this f-0 interferometer, as shown in fig. 2.8 or described in eq. (1.2).
Difference frequency generation (DFG) also allows for a very easy self-stabilization of the CEP; when the pulse mixes with itself, both input frequencies are derived from the same oscillator (and its frequency comb) and consequently the offsets will cancel out for the difference fre-quency. This is called intra-pulse DFG, whereas inter-pulse DFG can be employed when two synchronized seed pulses (with a CEP relationship) are mixed. The latter one is advantageous when a stronger and less broadband ”pump” pulse can be used to achieve more phase-matched bandwidth for the same crystal thickness [55]. Pumping DFG is nothing different from opti-cal parametric amplification (OPA) however, so deriving pump and seed pulses from the same source is equivalent [19]. Intra-pulse DFG however is potentially more stable (as fluctuations of the CEP between two arms are avoided) and much less complicated to set up. Effectively, the DFG process for two waves (pump and signal) with equal phase leads to an idler wave with a CEP of π/2 [19]. This scheme minimizes the technical effort in generating CEP-stable pulses.
Also, it does not require any active locking of the CEP for signal and pump and therefore works with a standard oscillator.
With CEP stability a constant CEP over time (for different pulses of the same pulse train) is meant, as the phase still naturally changes with propagation through any kind of dispersive mate-rial. As inherently CEP-stable pulses from DFG do not suffer from limited regulation bandwidths or amplitudes (like active phase-locking schemes), they are potentially able to run stably over in-finite periods of time. Every generated pulse has the same CEP with this scheme (fceo = 0 Hz),
which is often harder to achieve using active techniques.
12 1. Theoretical foundations of OPCPA
DFG DFG
f
f
fDF 0
rep
frep
Figure 1.1: DFG seed generation of a broad continuum.
Therefore the DFG process needs to be phase-matched (see section 1.2.2). However for the most broadband seed (and consequently idler) pulses, the group velocity mismatch still limits the efficiency.
1.1.2
Ultrafast pulses
Dispersion
The close-to-compressed pulses inside a mode-locked cavity are stretched by material dispersion as soon as they are coupled out. As the frequency components within the pulse experience different phase velocities, some of them will be delayed with respect to the center frequency. This chirp below the envelope of the pulse can be approximated as the frequency-dependent group delay (GD(ω)). It is a part of the spectral phaseφ(ω) of the pulse, given by
φ(ω)=GD (ω−ω0)+ GDD
2 (ω−ω0)
2+ TOD
6 (ω−ω0)
3+ FOD
24 (ω−ω0)
4+· · · (1.3)
The constant phase offset (important for the CEP) is neglected here, since it is not of interest in the compression of an optical pulse. Also the GD (which is a constant in eq. (1.3)) is not interesting in this regard, as it only translates the pulse in time. In a frame moving with the traveling pulse, the next derivative is more important. Consequently, in this frame we can also define GD(ω) (where GD varies with frequency). For very broadband pulses the higher orders in eq. (1.3) become more important. In fact, when phase-modulation processes become dominant, the low-order expansion at the center wavelengthω0is often not sufficient to describe the resulting spectral phase.
1.1 Ultrafast optics 13
distance). However, more ingenious devices [20, 67] do exist that allow tuning of two degrees of freedom (GDD and TOD).
Chirped mirrors are photonic crystal structures with a wavelength-dependent GD(ω) for a defined incidence. This tailored GD can compensate for higher oder chirp (TOD and FOD). However, since they are static, they cannot easily be adapted to the setup and proper customized com-pression demands at least one costly coating run. Furthermore, the GD of chirped mirrors does usually contain oscillations (although several techniques strive for minimizing them), leading to satellite pulses. For larger bandwidths, these are getting more pronounced and decrease the usable bandwidth and achievable peak power [9]. Also the dispersion per bounce is limited (and decreases with larger bandwidth), therefore overall dispersion with decent contrast is quite limited.
Adaptive pulse shapers offer a more convenient control of the GD. There are two important kinds: The 4f shaper uses a spatial light modulator (SLM) in the Fourier plane of a 4f setup [143]. This SLM is based on liquid crystals and can induce a phase that depends on the wavelength (pixel position). The maximum shaping window (or GD) is given by the spatial resolution of the modulator and the maximum GDD is limited by the maximum GD and the bandwidth to be shaped [9]. As the modulator is usually discrete (pixelated), it will lead to artifacts in time outside of its shaping window. However it can be used at virtually any repetition rate and provides high throughput. Unfortunately, these modulators are usually not available above 2µm.
The other kind of adaptive pulse shaper is called Acousto-optic programmable dispersive filter (DAZZLER, Fastlite), where a AOM is used in both its polarizations. The optical pulse enters in the fast axis of the crystal (TeO2 in our case) and interacts with an acoustic wave by diffraction.
The phase-matching of this process between acoustic and optical pulse is adapted to diffract different spectral components of the optical pulse at different crystals positions onto the slow axis. As the AOM shows large birefringence along both of its axes, this leads to a spectral dependence of GD(ω) that can be programmed by the acoustic wave. The spectral shaping window is given by the birefringence, whereas the resolution is determined by both length and birefringence of the AOM crystal. As we are employing a diffracted wave, the contrast is not impaired, however the efficiency depends on the shape of the acoustic pulse and the bandwidth and is rather low compared to 4f shapers. As the acoustic wave is pulsed, the speed of sound limits the repetition rate usually to about 20 kHz, making it only useful for medium repetition rate systems. Another feature of AOPDFs is the ability to manipulate the CEP of the optical pulse by changing the CEP of the acoustic wave. Since the acoustic propagation inside the crystal is much slower than in the optical regime, the acoustic wave only needs to be triggered with a delay jitter less than a few 100 ps, to operate without impairing the CEP stability (see section 4.2.1).
Measuring ultrafast pulses
14 1. Theoretical foundations of OPCPA
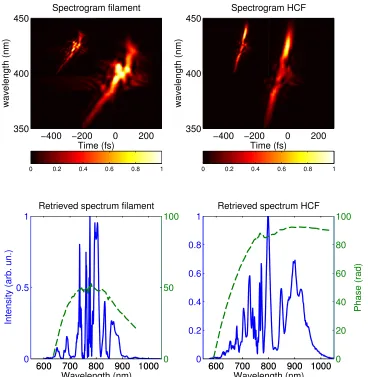
respect to its exact copy (obtained from a balanced beam splitter) and mixing it inside a nonlinear crystal (using SHG, THG, etc.), results in a delay-dependent intensity that can be used (given some assumptions about the pulse shape) to estimate the pulse duration [2]. Much later it was found that spectrally resolving the measurement allows for retrieval of the spectral phase without any additional assumptions [66]. The technique is consequently called frequency resolved optical gating (FROG) and can also be adapted in a cross-correlation (XFROG, using SFG or DFG) with a previously characterized pulse. For the obtained spectrograms, standard software packages are available nowadays, and the method is very well documented by its inventor [138, 139]. It should be mentioned that there are other techniques to characterize ultrashort pulses [10, 60], but these are beyond the scope of this thesis and not used therein.
However, for ever shorter pulses, the supported bandwidth in the nonlinear processes is limited by phase-matching (see section 1.2.2). Attosecond methods [40, 71] of retrieving the electric field directly aim to overcome this limitation in the future.
1.2
Nonlinear optics
The following section is largely adapted from [11] and [133], where derivations are given in more detail.
1.2.1
Second order processes
Whereas linear optics is only concerned about the linear response of the polarization to an electric field ( ˜P(t)= 0χ(1)E˜(t)), nonlinear optics needs to be considered for higher electric fields, where
the nonlinear response of the medium gives rise to new polarization contributions, expandable by a power series of
˜
P(t)=0χ(1)E˜(t)
| {z }
˜ P(1)(t)
+0χ(2)E˜2(t)
| {z }
˜ P(2)(t)
+0χ(3)E˜3(t)
| {z }
˜ P(3)(t)
+. . . (1.4)
where time varying fields are indicated with the tilde. Here we are only interested in second ( ˜P(2)) and third order ( ˜P(3)) polarization. For two different frequencies ω
1 and ω2, the electric
field is given by
˜
E(t)= E1e−iω1t+E2e−iω2t+c.c. (1.5)
so that the second order polarization can be divided into the resulting frequency components
˜
P(2) =X
n
1.2 Nonlinear optics 15
given by
P(2ω1)= 0χ(2)(ω3 =ω1+ω1)E12 (SHG) (1.7)
P(2ω2)= 0χ(2)(ω3 =ω2+ω2)E22 (SHG) (1.8)
P(ω1+ω2)= 0χ(2)(ω3 =ω1+ω2)E1E2 (SFG) (1.9)
P(ω1−ω2)= 0χ(2)(ω3 =ω1−ω2)E1E∗2 (DFG) (1.10)
Here the polarization components for second harmonic generation (SHG), sum frequency gener-ation (SFG) and difference frequency generation (DFG) will lead to radiation, while DC compo-nents are not considered.
Since polarization and electric field inside a crystal need to be represented as vectors with in-dices i,k, j (and not scalars as above) to take the crystal geometry into account, the nonlinear susceptibilityχ(2)is then represented by a tensor
Pi(ωn+ωm)=0
X
jk
X
(mn) χ(2)
i jkEj(ωn)Ek(ωn) (1.11)
however, for a given frequency mixing, crystal orientation and field polarizations, we may reduce it to an effective nonlinear susceptibilitydeff like
P(ω1+ω2)= 40deffE(ω1)E(ω2) (1.12)
for SFG. This allows for easy calculation of the fields and an easy comparison between different crystals and their orientations.
DFG (OPA)
The coupled wave equations for difference frequency generation describe the dependence of the field amplitudes (for signal, idler and pump) As, Ai and Ap on z during propagation through a
nonlinear medium. Note that in DFG, the idler is generated as the difference between pump and signal wave. While this is equivalent to OPA1, the pump wave there is typically a lot more intense and in most cases the amplified signal wave is used. For all cases treated in this manuscript, the medium is assumed to be non-magnetic and non-absorbing at the angular frequenciesωi, ωs or
ωp). Also it contains no free charges or currents, so that∇E˜ = 0 and j = 0. The displacement
vector ˜D= 0E˜+P˜L+P˜NL≡ D˜L+P˜NLcan be separated into a linear and nonlinear polarization
part, where the linear part is simply ˜DL =0LE˜ ≈0n(ω)2E˜and represents the linear (wavelength
dependent) response of the material. Using Maxwell’s equations we obtain a source term in the wave equation that is proportional to the nonlinear polarization:
∇2E˜ − n(ω) 2
c2 ∂ ∂t2E˜ =
1
0c2 ∂
∂t2P˜NL (1.13)
16 1. Theoretical foundations of OPCPA
0 0.5 1 1.5
0 2 4 6 8 10
z in mm
field in MV/m
signal idler 0.5 egz
∆k=6 ⋅ 10−3 k
s
∆k=3 ⋅ 10−3 k
s
∆k=0
Figure 1.2: Amplitudes of the fields in the coupled wave equations (as given in eqs. (1.16) and (1.17)) plotted overz
Now plugging in the amplitude of the polarization given by eq. (1.12) and separating the z-dependence of the amplitudes Em = Am(z)ei(kmz−ωmt) +c.c. we can apply the slowly varying
en-velope approximation. Then, for the one-dimensional case, this simplifies to the coupled wave equations for difference frequency generation:
dAs
dz =
2iω2 sdeff
ksc2
ApA∗ie i∆kz
(1.14)
dAi
dz =
2iω2ideff
kic2
ApA∗se i∆kz
(1.15)
where the mismatch in wave vectors is abbreviated as∆k= kp−ks−ki.
For the boundary conditions of no idler at the front surface of the crystal (Ai(0)=0), the solution
is given by [11]:
As(z)=
"
As(0) cosh(gz)−
i∆k
2g
!#
ei∆kz/2 (1.16)
Ai(z)=
"
A∗s(0)Ap
2iω2 ideff
kic2g
sinh(gz) #
ei∆kz/2 (1.17) wheregis the gain of the optical parametric amplification process and given by
g=
s 4|Ap|2
ωsωi
nsnic2
de2ff− ∆k
2 !2
(1.18)
Equation (1.17) is plotted overzin fig. 1.2 for different values of phase-mismatch∆k. Note how for perfect phase-matching both seed and idler follow 12egz, while for larger∆kthe amplification
1.2 Nonlinear optics 17
The parameters (angular frequencies, deff) for fig. 1.2 are comparable to the first stage of the
OPCPA described in section 5.3.
In eqs. (1.17) and (1.18), we see that the small signal amplification in OPA is exponential and the exponent is proportional to the crystal length, todeffand the square root of the intensity. As soon
as the pump wave is considerably depleted, the gain will finally saturate. More accurate analytical expressions for this behavior are found in [133]. However, temporal (because of group velocity mismatch) and spatial (because of Poynting vector walk-off and different mode divergences) walk-off of the fields still limits the efficiency of the process, so often much more elaborate simulations need to be employed to reproduce the experimental conditions.
1.2.2
Phase-matching
As seen in the previous section, a wave vector mismatch of∆k =kp−ks−kiis detrimental to the
parametric gain process. If we write out this expression, we find that
np(ωp)ωp
c =
ni(ωi)ωi
c +
ns(ωs)ωs
c (1.19)
conservation of momentum is equivalent to phase-matching. Since all refractive indexes are functions of frequency, the phase-matching effectively determines the bandwidth of nonlinear processes (when detecting on-axis radiation only2). In order to find favorable phase-matching,
∆k is minimized in birefringent crystals by choosing the pump polarization (the field with the largest frequency) along the fast axis. If we define the gainGof the OPA process as
Is(L)
Is(0)
=1+G (1.20)
where the intensity Is is given byIs = 2ns0c|As|2 we can plotGover wavelength to find
phase-matched spectral regions.
Angle phase-matching
The two most employed crystals in this manuscript are Lithium Niobate (LNB) and β-Barium Borate (BBO). Both are negative uniaxial crystals, meaning thatne <no. In type-I configurations,
signal and idler both have the same polarization, so eq. (1.19) simplifies to
nep(θ)ωp =nosωs+noiωi (1.21)
where ne
p(θ) can (but does not necessarily) contain phase-matched angles θ. deff can then be
18 1. Theoretical foundations of OPCPA
1500 2000 2500 3000 3500
0 2 4 6 8 10 12 14 16x 10
5
G
wavelength (nm) crystal length 1.5 mm @ 100GW/cm2
1500 2000 2500 3000 3500−50 −40 −30 −20 −10 0 10 20 30 40 50 ∆ k L
1500 2000 2500 3000 3500−50 −40 −30 −20 −10 0 10 20 30 40 50 ∆ k L
1500 2000 2500 3000 3500−50 −40 −30 −20 −10 0 10 20 30 40 50 ∆ k L
1500 2000 2500 3000 3500−50 −40 −30 −20 −10 0 10 20 30 40 50 ∆ k L
θ = 49.2 θ = 49.5 θ = 50.0 PPLN 30.5 µm
1500 2000 2500 3000 3500
0 0.5 1 1.5 2 2.5
3x 10 6
G
wavelength (nm) PPLN 30.7 µm
1500 2000 2500 3000 3500−50 −40 −30 −20 −10 0 10 20 30 40 50 ∆ k L
1500 2000 2500 3000 3500−50 −40 −30 −20 −10 0 10 20 30 40 50 ∆ k L
1500 2000 2500 3000 3500−50 −40 −30 −20 −10 0 10 20 30 40 50 ∆ k L
1500 2000 2500 3000 3500−50 −40 −30 −20 −10 0 10 20 30 40 50 ∆ k L
10 GW/cm2 6 mm 50 GW/cm2 2.65 mm 100 GW/cm2 1.85 mm 200 GW/cm2 1.3 mm
Figure 1.3: Left: OPA gain spectrum for different phase-matching angles of lithium niobate and comparison to QPM in PPLN. Right: Scaling of pump intensity with gain held constant by varying the crystal thickness. solid: gain G, dashed: phase mismatch
Quasi-phase-matching (QPM)
Another approach is to allow phase mismatch for a distance equivalent to the coherence length
Lcoh, when ∆kLcoh = π and then switch the sign of deff after this period before destructive
in-terference of the signal would occur, leading to a continuous buildup of signal and avoiding the back-conversion seen in fig. 1.2. Apart from being tailorable, this kind of phase-matching also allows access to the largest component of the second order susceptibility tensor of lithium nio-bate χ(2)zzz, by having all polarizations aligned along the z-axis. For angle phase-matching, the
use of this large component is not possible (see eq. (1.19)), therefore the nonlinearity of PPLNs is unmatched in the VIS/NIR. The left of fig. 1.3 shows how PPLN easily trumps angle-tuned lithium niobate crystals in bandwidth by better phase-matching alone (consider the more flat phase mismatch curve), while providing larger gain due to higherdeff. (In the plotdeff = 4.0pmV
is held constant for all crystals, otherwise the PPLN would be offthe chart with 14.9pmV). As the PPLN can be selected several times thiner for comparable gain (compare eq. (1.18)), this allows better phase-matching. The downside of PPLNs is that they cannot be grown in large apertures
2As argued in [3] and [96], non-parallel k-vectors and their detection (“dithering”) increase the bandwidth of the
1.2 Nonlinear optics 19
while still providing a clean periodic structure [63]. At the same time, the parasitic nonlineari-ties of lithium niobate are higher than for other crystals (e.g. n2, see table B.1) and the damage
threshold is relatively low. This limits them to low and medium energy applications.
Shorter pump pulses
To extend the bandwidth even further, the crystal length (and therefore the phase mismatch∆kL) can be reduced. An example is shown on the right side of fig. 1.3 for a 30.7µm PPLN, whose thickness was decreased with increasing pump intensity to hold the gainGconstant. The phase-mismatch curve flattens with the shorter crystals, however the pump intensity needs to remain below the damage threshold. As this threshold scales favorably with short pulses [132], the development of ultrashort pump lasers was enforced in recent years.
1.2.3
Higher order processes
Equation (1.4) also contains third order polarization components in ˜P(3)(t). While being more complicated, interesting effects like self-phase modulation (SPM), cross-phase modulation (XPM), third harmonic generation (THG), two photon absorption (TPA) and self-focusing (Kerr-lensing; a spatially dependentn2(x,y) withx,ytransversal to the propagation direction) are caused by the
third order susceptibility χ(3)i jkl. As there are four waves participating (that may be degenerate), these effects can all be considered so-called four-wave mixing (FWM) effects. While for sec-ond order processes, media need to show some kind of anisotropy, third order processes can be observed in virtually all media, including dielectrics and gases.
In the absence of a second field ( ˜E(t)= Ee−iωt +c.c.), the degenerate processes of ˜P(3)(t) can be
separated by their frequency into ˜P(3)(t)=P
nP(ωn)e−iωnt. The interesting components here are
P(ω)=0χ(3)(3EE∗)E SPM (1.22)
P(3ω)=0χ(3)E3 THG (1.23)
With introduction of a second field (that could have the same or different polarization, this only changes the indexes inχ(3)i jkl) ˜E(t) = E1e−iω1t+E2e−iω2t+c.c. new terms become relevant, giving
rise to XPM
P(ω1)=0χ(3) 3E2E∗2
E1 XPM (1.24)
When we plug in eq. (1.22) (similar for eq. (1.24)) into the source term of eq. (1.13), we see that the refractive index has experienced an intensity dependent shift∆n:
∇2E˜− 1
c2 ∂ ∂t2
20 1. Theoretical foundations of OPCPA
If we define the nonlinear refractive indexn2 as a correction to the linear refractive index ∆n =
2n2|E|2, it follows for SPM (fields only along one polarization)
n2=
3 4nχ
(3)
xxxx (1.26)
Likewise, for XPM we find a factor of 6 in eq. (1.25) for all fields being polarized along the same axis in an isotropic medium.
As usually we are more interested in the response of the medium to the intensity, there is a second definition forn2(mostly used in the literature, also dubbedγ):
∆n= 2n2|E|2≡ n I
2I (1.27)
that can be converted byγ≡ nI 2=
n2
0n0c.
B-integral
Often the accumulation of pulse distortions induced by SPM (or XPM) are simply characterized by the B-integral [76]
B= 2π
λ
Z
l
nI2I(z)dz (1.28) which adds up the nonlinear phase shift of eq. (1.27) over the path length l in the transmitted medium. As n2 is usually positive (unless close to two photon absorption) in most materials,
the B-integral is monotonically growing. In space it promotes the small-scale self-focusing of spatial distortions and can lead to optical damage [76]. Also it can distort the temporal profile of the pulse, like shown in fig. 3.5, especially for ultrashort pump lasers that are typically used in OPCPA. ThereforeBshould be kept low.
Spectral broadening and self-steepening
For a pulse with ˜E(z,t) = A˜(z,t)ei(ωt−kz) +c.c. a shift in the (time-dependent) refractive index
∆n(t) over the absolute value ofk0 = ncω leads to a shift ink =k0+ ∆n(t)ωc. Since this leads to a
(time-dependent) phase-shift for the whole pulse, we need to shift the overall phase, to find the relative modulation. We do this using the phase velocity in the substitution:t0 =t−znc. This gives the modulated pulse ˜E(z,t0) = A˜(z,t0)ei(ωt0−∆nωcz)+c.c.and therefore a time-dependent nonlinear
phase-shift of
φNL(t)= −∆n(t)
ω
cz=−
ω
cn
I
2I(t)z (1.29)
For the instantaneous frequency ω(t) of the pulse, this means a shift of δω(t) = dtdφNL(t) and
results in
ω(t)=ω0−nI2 ω
cz dI(t)
1.2 Nonlinear optics 21
As the refractive index n = n0 + n2I(t) changes with the time-dependent intensity I(t) and n2
is usually positive, the instantaneous frequency in eq. (1.30) will create red-shifted frequency-components at the leading edge of the pulse and blue-shifted at the trailing. This mimics a linear chirp in the center of the pulse, but increases the bandwidth elsewhere at the same time. The modulation strength is obviously given by the temporal gradient of the pulse. Note that the phase of the pulse is modulated according to the temporal pulse shape. For non-ideal pulses, this can often not be compensated. As a consequence, the spectral broadening then naturally leads to satellite pulses or pedestals and therefore comes at the cost of contrast [129]. In fact, the temporal shape of the pulse determines how well the broadened spectrum can be compressed [137].
The most broadband spectra generated from broadening are in general not symmetric around the center wavelength. This is caused by higher order dispersion and the effect of self-steepening. As the peak of the pulse experiences a larger group velocity, it is delayed with respect to the center, leading to an even steeper temporal gradient of the trailing edge and (from eq. (1.30)) consequently more spectral extension into the blue from this so-called shock wave. The deriva-tion is beyond the scope of this work and can be found in [11], chapter 13. Self-steepening is significant when the input spectral bandwidth of a pulse is already significant compared to the output spectrum, for example in super-continuum generation (like performed in section 2.2 or section 7.4).
Kerr lensing
An intensity dependent refractive index can also lead to modulations in the spatial domain. This includes effects like nonlinear holography using several beams (transient grating), which can be used for ultrafast pulse characterization. The beam can even focus itself due to a spatial gradient in its beam profile, which is called Kerr-lens self-focusing. For pulses exceeding the critical power
Pcr =
π(0.61)2λ2
8n0n2
(1.31)
this ultimately leads to self-trapping of the beam (filamentation), where one filament carries exactlyPcrand the diffraction (enhanced by plasma generation) is compensated by self-focusing.
As it increases the interaction length of SPM at high intensity, filamentation is useful for spectral broadening. To enhance the self-focusing tendency (that often only leads to very long focal lengths), usually one focuses weakly into a medium. However diffraction and the dispersion of the medium limit the length of the filament.
Two-photon absorption
Four-wave mixing can modulate not only the phase, but also the amplitude of a pulse. The imaginary part ofχ(3)leads to two-photon absorption (TPA) according to [133] dI
22 1. Theoretical foundations of OPCPA
and
β= 3π
0n2cλ
Imχ(3)xxxx(−ω;ω, ω,−ω)
(1.32)
The effect is only considerable when the medium contains a transition which is resonant near twice the photon energy. This is the case for the silicon plates used for pulse compression in section 5.4 and demands low intensities (large spot sizes) as significant fractions of the pulse energy can be absorbed. Besides, it further motivates long wavelength few-cycle pulses for probing ultrafast processes in moderate band-gap dielectrics at high fields (see chapter 6) without breaking the sample under investigation.
Photo-refraction
The properties of lithium niobate are very favorable in general, as it does not show any absorption in the near infrared (see table B.2) and is not hygroscopic. However, especially for shorter wavelengths it suffers from photo-refraction, a spatial laser-induced distribution of carriers. The local fields of these charges then lead to a modulated refractive index. While this is a very strong (and therefore rather slow) nonlinear effect, it cannot be described by means of higher-order susceptibilities. To prevent it to some extent, MgO-doping and heating help to elevate the damage threshold to levels that can be used for OPCPA. However, the damage threshold is still much lower than for crystals like BBO, while n2 is significantly higher (table B.1), leading to
large B-integrals in the OPA stages of chapter 5.
1.2.4
OPCPA
Chapter 2
Seeding OPCPA
2.1
The seed laser
The femtosecond pulses needed for seeding both pump and seed amplifiers of the OPCPA are generated inside a commercial Kerr-lens mode-locked Ti:sapphire oscillator (Rainbow, Femto-lasers). As mentioned in section 1.1.1, this oscillator sets the frequency comb that both amplifiers will be lasing on. It does not need to be CEP stabilized for our purposes.
In OPCPA systems, for all but the most broadband of high-power pump lasers [103, 118], more broadband laser sources are synchronized for seeding. This can either be done directly [36] or, typically for higher seed energies, after further broadening the seed spectrum by using self phase modulation in noble gases. In any case, the synchronization between pump and seed pulses needs to be ensured (see chapter 4).
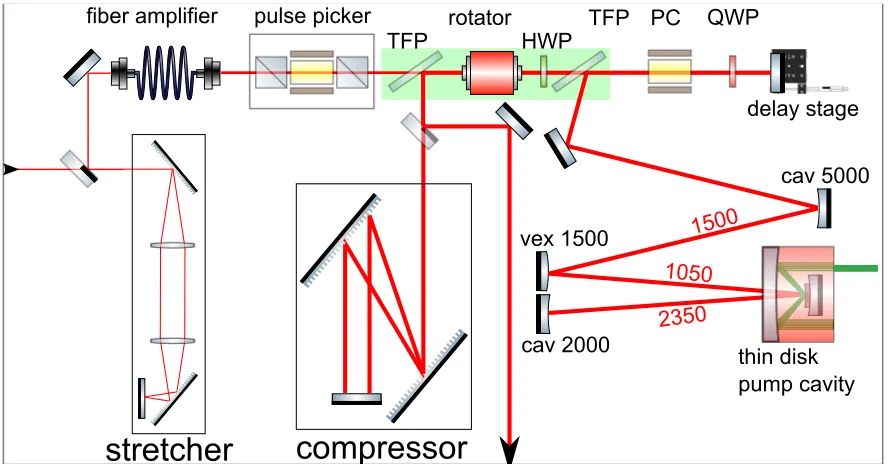
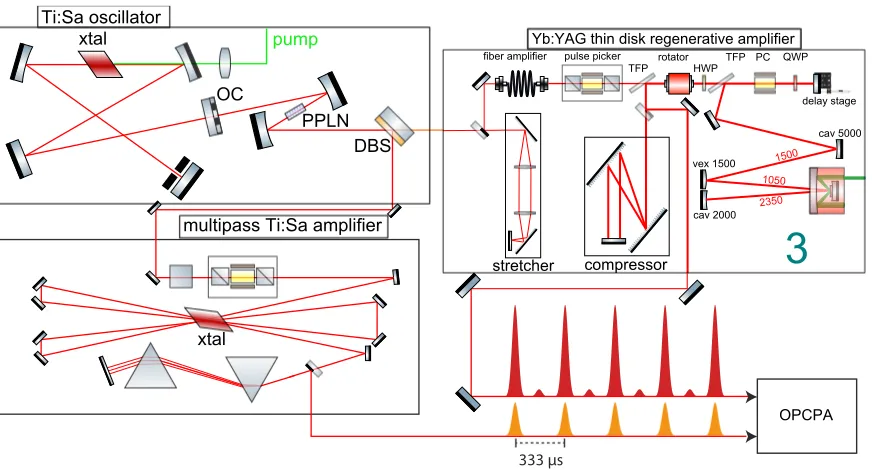
The setup of the seed generation is shown in fig. 2.1. The long-wavelength spectral part of the oscillator output (> 1000 nm) is used to seed the pump laser (see section 3.1.2). A Ti:Sapphire amplifier, running at 3 kHz and described elsewhere in more detail [18], is seeded by the remain-der. It is based on the commercial Femtopower Pro HR/CEP from Femtolasers. After amplifica-tion 5% of the pre-compressed 1 mJ pulses are split offfor our purposes. While 5% of this 50µJ are used for delay and beam pointing stabilization (where chirped pulses are advantageous), the rest is finally compressed by a pair of thick SF57 wedges, AR-coated for the laser wavelength. Figure 2.2 shows a pulse characterization of the compressed pulses using second harmonic gen-eration frequency resolved optical gating (SHG FROG). The retrieved spectral phase indicates some uncompensated higher order dispersion, which is to be expected, given that the final com-pression is done by the thick wedges alone. However most of the pulse energy is confined to the main pulse and the result proved to be sufficient for efficient seed generation. Reconstruction gives a pulse duration ofτFW H M = 26.5 fs and a bandwidth of∆νFW H M = 67 nm. The time axis
24 2. Seeding OPCPA
regenerative Yb:YAG amplifier KLM Ti:Sa oscillator 70 MHz
OC
PC TFP
multipass Ti:Sa amplifier
Si bandstop CM CM CM cav 1000 CM AOPDF to OPA DFG HCF to OPA
Figure 2.1: Seed generation scheme of the OPCPA.
Time (fs)
wavelength (nm)
Spectrograms
−200 0 200
380 390 400 410 420 430
0 0.2 0.4 0.6 0.8 1 0750 800 850
0.5 1
Wavelength (nm)
Intensity (arb. un.)
Retrieved spectrum
750 800 850 0
5 10
Phase (rad)
−100 −500 0 50 100 150
0.2 0.4 0.6 0.8 1 Time (fs)
Intensity (arb. un.)
Retrieved pulse, FWHM = 26.5 fs
Figure 2.2: Measured and retrieved (inset) SHG FROG trace of the seed amplifier and retrieved temporal and spectral intensity and phase.
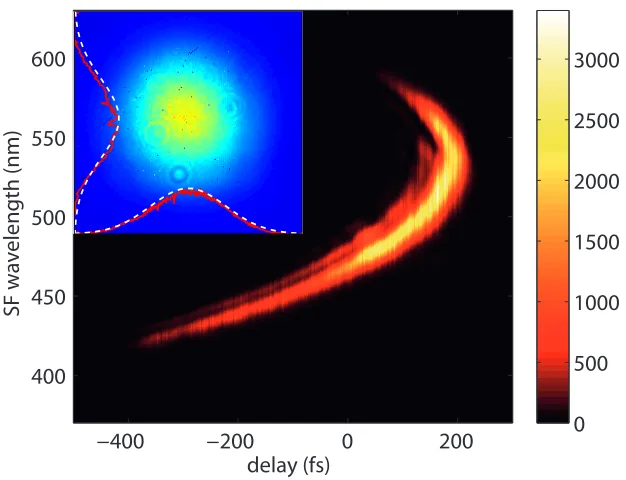
due to dispersion of the entrance window and gas in the gas cell. Moreover the retrieved spectral phase allows the use of the seed laser as a reference pulse for cross-correlation FROG (XFROG) with more complicated, synchronized pulses (as shown in section 2.3).
Stable broadening demands good stability with respect to pulse energy and beam pointing [65] from the driving laser. The pulse energy stability of our seed pulses amounted toσP = 2.2%. It
was characterized using a diode with sufficient aperture and integrating in time over the temporal (electronic) pulse profile.
2.1 The seed laser 25
−10 −5 0 5
−10 −8 −6 −4 −2 0 2 4 6 8
deviation (urad)
deviation (urad)
stabilized free running
Figure 2.3: Angular beam pointing of the seed laser before the entrance of the hollow core fiber.
the (center of mass) position, they need to be calibrated. For the PSDs and readout electronics used this is done in appendix C.1, where very good linearity is found. The fitted scaling coeffi -cients are (17.41±0.02)mVµm and (7.73±0.02)mVµm respectively. One may note that this is actually proportional to the respective detector sizes. PSDs offer sub-µm resolution, however the read-out demands ADCs of higher resolution than usual oscilloscopes (8 bit), since the processed (analog) position signal ranges up to 10 V. Therefore 16 bit ADCs (USB-6229 with 250kS/sfrom National
Instruments) with sub-mV resolution were used. Since the processing read-out electronics di-rectly after the PSDs sample and hold the readings for each optical pulse, the single electronic pulses do not have to be resolved, allowing for relatively slow sampling. Also the RC-constant was very large atτRC ≈ 70µs, due to the large detector size and input impedance (10 GΩ). This
is leading to some overlap between pulses and effectively limits the measured beam pointing bandwidth.
Figure 2.3 shows the measured beam pointing at the focus of a 1 m focusing lens, right where it would be coupled into a hollow core fiber (HCF) (the beam was attenuated to avoid nonlinear effects in this measurement1). With onlyσunstabilized = 1.40µrad, the stability is even sufficient
without external stabilization for a HCF with an inner diameter of 140µrad. However slow thermal drifts make the setup more reliable when using a feedback stabilization and fast beam pointing was improved toσstabilized = 1.07µrad. The pointing appears more centered in fig. 2.3,
however the jitter in y-direction is larger due to mechanical piezo resonances being stronger along this axis. More rigid construction can lead to better performance, as indicated by σstabilized,x =
0.92µrad. Still, the throughput of our 140µm hollow core fiber fluctuated only by 0.8% in
1Note that position sensitive detectors rely on highly linear signals for normalization, therefore nonlinear
26 2. Seeding OPCPA
intensity (measured with a miniature spectrometer over 505 shots at 10 Hz with 12 ms integration time). Note that due to integration the output could only appear more stable than the input of the HCF.
2.2
Spectral broadening for seeding ultrabroadband OPCPA
For broadening the compressed Ti:Sapphire pulses, we used self-phase modulation in inert gases. Two methods are employable for the temporal and intensity regime of the input pulses: filamen-tation and broadening in a hollow core fiber (HCF). The following subsections will describe both methods and results.
2.2.1
Spectral broadening by filamentation
Filamentation is based on the interplay of Kerr-lens self-focusing (see section 1.2.3) and defocus-ing by the generated plasma and diffraction after collapse is reached. Furthermore the intensity of the pulse is clamped by the steep onset [25] of multi-photon-ionization. As spectral broad-ening is happbroad-ening even without further guiding by a hollow fiber, filamentation (and self phase modulation happening during the process) alone can be a very efficient way of broadening, as transmission (and coupling) losses are avoided. However, some off-axis emission occurs that needs to be removed and the achieved broadening is limited, making it less desirable for the generation of the very shortest pulses.
Filamentation has other disadvantages, as the critical powerPcris limited and high gas pressures
for extended broadening can consequently lead to multi-filamentation, especially for beam pro-files that contain spatial distortions [13]. When multiple filaments arise, they tend to interchange energy, changing their spatial and spectral characteristics at the same time. Therefore they cannot be used for stable seed generation.
A clean laser mode is more crucial as compared to HCF broadening, as filamentation is very sensitive to spatial distortions like astigmatism. Also the splitting into several filaments depends on the spatial properties of the beam. Methods of ”cleaning” the beam profile by apertures, leading to a more stable filamentation [22, 24], are lossy and only mimic the inherent nature of a HCF.
In fig. 2.4 the spectral broadening in a gas cell is shown for different pressures. Krypton gas and a
2.2 Spectral broadening for seeding ultrabroadband OPCPA 27
400 500 600 700 800 900 1000
-35 -30 -25 -20 -15 -10 -5 0
wavelength (nm)
rela
tiv
e in
tensit
y (dB)
6bar 7bar 8bar 9bar 10bar
Figure 2.4: Spectral broadening by filamentation for different pressures of Krypton.
finite output window size, clipping the outer parts of the mode. Using larger Brewster windows in another (lower pressure) setup, larger throughput could be achieved. Spectra were taken with an optical spectrum analyzer for sufficient sensitivity in the weak spectral parts (Ando AQ6317). The light was not focused into the collecting fiber, as further broadening was observed there as well. The signal however was still large enough when illuminating the fiber with the filament’s very center. We see in fig. 2.4 that broadening with Krypton was maximized for a pressure of about 8 bar. The blue tail is clearly preferred, whereas the broadening in the red stagnates around 1000 nm. For 6 bar there does not seem to be enough self-steepening (section 1.2.3) for the spec-trum to extend into the blue region. Since most of the energy (85% for 8 bar) is still centered in the spectral part of 700–900 nm, for truly broadband OPCPA seeding this is not a very satis-fying result. Changing gases and focusing conditions did not significantly improve this general tendency. Therefore we went to broadening using a HCF.
2.2.2
Spectral broadening in a hollow core fiber
The used hollow core diameters are rather small compared to [18], since our pulse energies are quite low. As transmission is limited for smaller core sizes, the fiber is also kept short at around 17 cm. The Krypton gas pressure is kept below 5 bar (the mechanical limit for the glued windows, as confirmed experimentally) and the Brewster-windows made from fused silica are 1 mm thick. The fiber is resting on a V-shaped trench cut into a steel rail. Less rigid rails were found to bend and inhibit single mode transmission. A mechanically sound setup for a HCF defines not only position but also direction and divergence of the emitted mode. Therefore it is not only a bench-mark of the spatial jitter of the incoming beam, but also makes alignment-sensitive setups behind it more reproducible, as spatial coupling, dispersion and gas pressure can be optimized while aligning the input beam instead of the static fiber. As only the mode with the least losses (EH11