Scholarship@Western
Scholarship@Western
Electronic Thesis and Dissertation Repository
7-27-2015 12:00 AM
The Relation Between Auditory Integration, Inspection Time, and
The Relation Between Auditory Integration, Inspection Time, and
Language in Children
Language in Children
Rachael E. Smyth
The University of Western Ontario
Supervisor
Dr. Janis Oram Cardy
The University of Western Ontario
Graduate Program in Health and Rehabilitation Sciences
A thesis submitted in partial fulfillment of the requirements for the degree in Master of Science © Rachael E. Smyth 2015
Follow this and additional works at: https://ir.lib.uwo.ca/etd
Part of the Speech and Hearing Science Commons
Recommended Citation Recommended Citation
Smyth, Rachael E., "The Relation Between Auditory Integration, Inspection Time, and Language in Children" (2015). Electronic Thesis and Dissertation Repository. 2974.
https://ir.lib.uwo.ca/etd/2974
This Dissertation/Thesis is brought to you for free and open access by Scholarship@Western. It has been accepted for inclusion in Electronic Thesis and Dissertation Repository by an authorized administrator of
(Thesis format: Monograph)
by
Rachael E. Smyth
Graduate Program in Health and Rehabilitation Sciences
A thesis submitted in partial fulfillment of the requirements for the degree of
Master of Science
The School of Graduate and Postdoctoral Studies The University of Western Ontario
London, Ontario, Canada
© Rachael E. Smyth 2015
ii
Abstract
It has been proposed that impairment in auditory temporal integration (ATI) may be related to impaired language development in children, although results have been inconsistent. We investigated the relation between ATI and language development and whether it is domain-specific (i.e., isolated to the auditory system) or domain-general (i.e., part of a larger, global processing system) using behavioural measures. We measured ATI and global processing speed using experimental tasks, and language and intelligence using standardized tests, in 26 5-6 year old children with typical development. Results revealed no significant relations between ATI and language, between ATI and global processing speed, or between global processing speed and intelligence. Although the correlations between our experimental and standardized tasks were not significant, further research using a larger sample with a broader range of language abilities and intelligence may offer more insight into these relations.
Keywords
iii
Co
-
Authorship Statement
Dr. David Purcell contributed to the article presented in Appendix A. His role was
supervising the timing test and helping to complete the technical components of the process, namely, creating the circuit to measure the camera accuracy. He was also involved in
iv
Acknowledgments
First and foremost, I would like to express my heartfelt gratitude to my supervisor, Dr. Janis Oram Cardy, for her ongoing support and guidance over the course of my MSc. I am so grateful to have had the opportunity to learn from such an incredible mentor for the last two years and I look forward to the learning and laughter that is bound to occur in the years to come. I would also like to gratefully acknowledge my thesis committee members for their contributions: Dr. Andrew Johnson, for his ongoing support, statistical and academic, and his knowledge and insight into inspection time, and Dr. David Purcell, for his positive presence and endless patience in counting frame after frame in timing test after timing test. I could not have asked for a better committee.
I would also like to thank my ASLD lab mates, Elaine, Olivia, Amanda, Margot and Heather, and my Shared Lab lab mates, Nicolette, Monica, Laura, Areej and Kristen, for their support and advice throughout this study. You are all so wonderful.
v
Table of Contents
Abstract ... ii
Co-Authorship Statement ... iii
Acknowledgments ... iv
Table of Contents ... v
List of Tables ... vii
List of Figures ... viii
List of Appendices ... ix
Introduction ... 1
Auditory Temporal Integration ... 2
Auditory Temporal Integration and Language Development ... 4
Auditory Temporal Integration and Language Impairment ... 6
Behavioural Support ... 8
Neurophysiological Support ... 11
Maturation of Auditory Temporal Integration ... 13
Processing Speed in Children with Language Impairment ... 15
Maturation of Information Processing Speed ... 15
Information Processing Speed and Intelligence ... 17
Inspection Time and Intelligence ... 18
Aims ... 20
Hypotheses ... 20
Method ... 21
Participants ... 21
Measures ... 22
vi
Non-Verbal Intelligence ... 23
Auditory Temporal Integration ... 24
Information Processing Speed ... 28
Results ... 31
Outlier Analysis ... 31
Pearson’s Product-Moment Correlations ... 32
Regression ... 32
Discussion ... 34
The Relation Between ATI and Language ... 35
Sample Composition ... 35
What Does the Bird Task Measure? ... 36
No Relation between ATI and Language? ... 37
How Do We Explain Neurophysiological Evidence? ... 39
The Relation Between ATI and Cognitive Processes ... 39
Study Design Issues ... 40
Domain-General Process at Another Level of ATI ... 41
ATI as a Domain-Specific Process ... 42
The Relation Between IT and PIQ ... 42
Study Design ... 43
PIQ as a Measure of IQ ... 44
Maturation of IT ... 45
How Effective is the Bird Task as a Measure of ATI? ... 45
Limitations and Future Directions ... 47
References ... 50
Appendices ... 61
vii
L
ist of Tables
Table 1. Gap Sizes Between Tones ... 26 Table 2. Demographic Information ... 31
Table 3. Bivariate Correlations Between Experimental Measures and Psychometric Measures ... 32
Table 4. Summary of Coefficients, Confidence Intervals, t-values, p-values and Partial
Correlations for ATI ... 33
Table 5. Summary of Coefficients, Confidence Intervals, t-values, p-values and Partial
viii
List of Figures
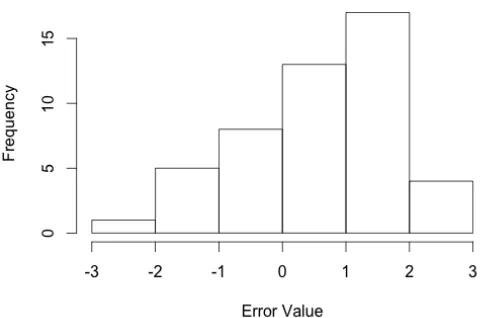
Figure 1: The flowers that appear in the Benny Bee Inspection Time Task (Williams et al., 2009)………....30 Figure 2. Distribution of Timing Error Values………....65
ix
List of Appendices
Appendix A Testing the Accuracy of Timing Reports in Visual Timing Tasks ... 61 Appendix B Ethics Approval ... 69 Appendix C Letter of Information and Consent Form ... 70
Introduction
The human brain processes sensory information as it enters through various sensory pathways. The speed at which this processing occurs can impact the success with which information is processed. While specific sensory systems process specific types of sensory information, an over-arching global processing mechanism plays a role in processing all incoming sensory information on some level (Kail, 2000). One way in which the human auditory system processes sound is by integrating the incoming acoustic information over time to create the sounds that we perceive. This process is called
Auditory Temporal Integration (ATI). In ATI, the auditory system chunks the incoming information. When this process occurs within small windows of time, the signal has good resolution (Näätänen & Winkler, 1999). Whether ATI is simply one reflection of global processing, or is an independent processing mechanism, is unclear.
Research conducted principally with children who have developmental language impairments has suggested that language development may be impacted by the resolution of ATI. In these studies, children who struggle to process auditory stimuli presented in rapid succession at an age appropriate level have tended to be those who have
overall relation between global processing and global cognitive functions that include, but extend beyond, language ability.
Independent bodies of research have suggested that language is related to ATI and intelligence to global processing speed. This study addressed these two separate
hypotheses to investigate whether there is any relation between them. We aimed to understand whether the relation between ATI and language development is independent from, or part of, a larger, global processing mechanism. A review of the relation between ATI and global processing and how differences in the speed of these mechanisms impact other areas of development, namely language and intelligence, is provided in the sections that follow.
Auditory Temporal Integration
ATI is the perceptual process by which the human brain processes incoming acoustic information over time (Cowan, 1984). Auditory information is encoded in short periods of time and unitary auditory percepts are created as the brain integrates this incoming acoustic information. To integrate information successfully over time, all of the information that occurs between the first time point and the second time point must become one auditory percept (Cowan, 1984). Various features of the input, including loudness, pitch, amplitude modulation and formant transitions are integrated so that the percept is a neural representation of the acoustic input (Bailey & Snowling, 2002;
phoneme articulation (Bailey & Snowling, 2002). The ability to integrate acoustic information across slow and fast changes ensures the successful perception of speech.
Early evidence suggests that integrating acoustic features effectively over time requires that the auditory input occur with enough time to allow for full processing of the various acoustic features. Foyle and Watson (1984) measured the time between two tones required by adults in order to accurately identify whether the first tone was lower or higher in pitch than the second tone. As the time between tones decreased in length, accuracy on the task decreased. Foyle and Watson (1984) estimated that the time required between stimuli to accurately identify the pitch of the first tone relative to the second was slightly higher than 100 ms. When the time between stimuli was shorter than 100-200 ms, the auditory features of the first sound were not completely perceived. This study
demonstrated that acoustic information that occurs in close succession can be lost
depending on the length of the individual’s temporal window of integration. This window is a sliding, temporal window in which acoustic information is integrated into one
auditory percept (Näätänen & Winkler, 1999). Any information occurring outside the window of ATI becomes a part of the next auditory percept (Wang, Datta, & Sussman, 2005; Winkler, Czigler, Jaramillo, Paavilainen, & Näätänen, 1998; Yabe, Tervaniemi, Reinikainen, & Näätänen, 1997). Acoustic information in the latter part of the window of integration is weighted more heavily, and can interfere with the consolidation of
approximately 100-200 ms in length in adults (Foyle & Watson, 1984; Yabe et al., 1998, 1997).
Auditory Temporal Integration and Language Development
There is reason to believe that the window of ATI may be important for early language development. Kuhl et al. (1997) provided an overview of support for the idea that infants acquire knowledge about features of the phonology and prosody specific to their native language through exposure to their native language in conversation around them. The smallest unit of meaningful sound that an infant must learn is the phoneme (Tallal, Miller, & Fitch, 1993; Tallal, 2000). Phonemes are not often produced in a simple, understandable way, one by one with natural boundaries between them. Instead, they occur in combination, as part of a long string of sounds, with no identifiable
boundaries, and often with varying acoustic features. The features of surrounding
phonemes affect the features of the phoneme being processed (Bailey & Snowling, 2002; Liberman, Cooper, Shankweiler, & Studdert-Kennedy, 1967; Tallal, 2000). The
inconsistencies in phoneme perception require the brain to break down the incoming strings of acoustic information systematically into consistent sections that represent the phonemes in the infant’s language (Tallal, 2000). The temporal window of integration breaks a string of incoming acoustic information into percepts that ideally represent these phonemes.
This premise of phoneme perception was tested using syllable combinations in children with and without language impairment (Tallal et al., 1993). Different syllables contain different formant transitions. For example, Tallal et al. (1993) used two
the role of temporal processing on phoneme perception. The vowels, /æ/ and /ε/, were steady-state, lasted 250 ms, and did not contain any formant transitions. The CV pairs were /ba/ and /da/ and had different consonant sounds, /b/ and /d/, occurring in the formant transition that occurred in the first 40 ms. The consonants transitioned to the same vowel sound in the final 210 ms. In both conditions, children were trained to associate a certain response button each of the responses in both pairs and in the test session, upon hearing a syllable, had to select the button that was associated with that syllable. In the steady-state condition, both groups of children had similar performance in correct identification of syllables. The difference between groups occurred in the CV syllable condition. Children with language impairment struggled to learn the buttons associated with the CV pairs and 10 of 12 participants with language impairment failed to reach threshold in learning the button associations, whereas children without language impairment performed well above chance (Tallal et al., 1993). The results from this study suggest that children with language impairment struggle to distinguish features that occur across short amounts of time. While performance didn’t differ between groups on the syllables that were steady-state and occurred across 200 ms or more, children with
language impairment struggled to identify phonemes that occurred quickly, across 40 ms, in this case.
lost to perception (Tallal, 2000). Applied to language development, it is easier if the infant’s temporal window of integration is shorter, as percepts can be formed at the individual phoneme level, making phoneme segmentation a less daunting task. When the temporal window of integration is longer and crosses phoneme boundaries, perceptual chunking may capture information at the syllable level rather than at an individual phoneme level (Tallal, 2000). Processing phonemes at the syllable level makes learning the phonemes more difficult because there is an extra level of parsing that must happen. Alongside the challenges of finding consistencies in the features of individual phonemes, infants must find consistencies in the phonemes occurring within syllables (Tallal, 2000). Based on this theory, it is plausible that children with larger windows of ATI would experience difficulty in acquiring language.
Auditory Temporal Integration and Language Impairment
A number of studies have suggested that there is a relation between language development and ATI in children with specific language impairment (SLI). Children with SLI display impaired development of expressive and/or receptive language despite normal hearing, at least average non-verbal intelligence and absence of neurological impairment (Leonard, 2014). As per the DSM-V, language disorder is a
impairment, medical or neurological conditions, or intellectual disability (American Psychiatric Association, 2013).
To investigate its relation with language, ATI has been measured behaviourally and neurophysiologically. Behavioural measures of ATI require participants to make some type of decision about rapidly presented auditory stimuli. McArthur and Bishop (2001) provide an excellent review of common behavioural tasks used to measure ATI. The Rapid Perception task asks participants to identify the order of tones of different frequencies (Tallal & Piercy, 1973). In the Same-Different task, participants must discriminate whether two tones are the same pitch or different pitches (Tallal & Piercy, 1973). The Auditory Choice Reaction Time test requires participants to identify targets that are presented randomly within a string of frequent standard sounds (Neville, Coffey, Holcomb, & Tallal, 1993). Backward Masking tasks present an initial target stimulus followed by trials in which the participant must decide whether the test stimulus, which is followed by a mask stimulus, matches the target stimulus (Winkler & Näätänen, 1992). The Auditory Repetition task uses an adaptive staircase procedure (described in more detail in the Method section) to determine the smallest time required between two tones to accurately repeat the sequence (Oram Cardy et al., 2010; Tallal, 1980).
language impairment is compared to that of participants without language impairment. As detailed below, although several studies provided support for a relation between ATI and language, other studies have found no such relation.
Behavioural Support
Behavioural studies have yielded inconsistent findings in terms of whether children with and without language impairment performed differently on tasks of ATI. Many studies have found results that support a relation between auditory temporal
processing and language impairment. One of the earliest studies investigating this relation in children was conducted by Tallal and Piercy (1973). They asked children aged 6-9 years, both with and without SLI, to identify the temporal order of two tones of different pitches in a temporal order judgment task and to determine whether the two tones were the same or different in a same-different task. The tones were presented first with an interstimulus interval (ISI) of 428 ms and then with varying gaps between them, ranging from 8 ms to 4062 ms. Tallal and Piercy (1973) found that at an ISI of 428 ms, children with and without SLI met criterion (20 out of 24 consecutive correct responses). When the tones were presented with varying ISIs, children without SLI performed significantly better than chance when the gap between tones was as small as 8 ms, whereas the
children with SLI required tones separated by longer gaps of over 300 ms to reach the same level of accuracy. The performance of both groups was similar on the
of children with and without SLI on both tasks suggests that children with SLI have impairments in processing rapidly occurring acoustic information.
Following this study, other researchers also found support for a relation between auditory temporal processing and language. Studies have been completed on children with and without language impairment and with reading disabilities, which includes children with concomitant reading and language impairment. Many results from these studies have supported Tallal and Piercy's findings (Benasich & Tallal, 2002; Heath, Hogben, & Clark, 1999; Tallal & Stark, 1982; Tallal, 1980). For example, Benasich and Tallal (2002) investigated the relation between auditory temporal processing and
language longitudinally in infants up until they were three years of age. They used a look and listen paradigm to measure auditory temporal processing at 7.5 months and
ATI and language. These studies all measured ATI behaviourally in different ways and each study demonstrated a relation between ATI and language or a group difference in ATI based on language ability.
By contrast, some researchers have failed to find group differences or relations between ATI and language ability. For example, Smyth, Archibald, Purcell and Oram Cardy (2014) measured ATI in children with SLI (n = 15) and typical development (n = 21) between the ages of 8 and 13 years and found no difference in their ATI thresholds. The behavioural task measured ATI by asking children to identify the longer of two gaps between pairs of tones. The two groups differed significantly in language ability, but did not differ in age or IQ. Despite differences in language ability, children with and without SLI did not differ in their ATI thresholds (LI = 70 ms, TD = 56 ms, p > .05). Although there was no significant difference in ATI thresholds, ATI threshold and language ability were significantly correlated, r = -.335, p = .046. While this correlation supports a relation between language development and ATI, the lack of group difference suggests that this sample of children with SLI did not have impaired ATI.
results call into question whether impaired ATI is a unique characteristic of SLI or whether it is something that exists as part of a number of, potentially co-occurring, disorders, including those that don’t involve impaired language development. The results also raised the possibility of an issue with the face validity of the auditory repetition task; it is possible that impairments in functions other than ATI (such as attention in children with ADHD) can lead to poor performances on this task.
A study by McArthur and Hogben (2001) also called the relation between ATI and language into question. They measured ATI using a backward masking task in children with typical development, children with SLI who were poor readers, children with SLI who were average readers and children who had a reading disability but average language. While a subset of children with language impairment and poor reading skills demonstrated impaired performance on the ATI task, another subset of children with language impairment who were poor readers performed no differently than children with typical development or reading disability. These results are equivocal with respect to which language profiles are associated with impaired ATI, because a seemingly homogeneous language group (SLI poor readers, in this case) demonstrated
heterogeneous ATI abilities. These group inconsistencies suggest that a correlation between language and ATI may be mediated by other factors and not solely language abilities.
Neurophysiological Support
Oram Cardy et al. (2005) used MEG to examine neural activity during a passive ATI task in children and youth with SLI, autism, Asperger’s syndrome, typical
listening to a series of tone pairs each separated by a 150 ms gap. The passive paradigm removed confounds such as attention, learning, and memory associated with behavioural measures of temporal integration. That is, MEG was used to record brain responses to the tone pairs without the participant having to make a decision about the stimuli. Neural responses to the first tone were expected for all participants, while responses to the second tone were taken as indicative of the participant’s ATI window. Oram Cardy et al. (2005) found no group differences in the neural response to the first tone, but that
significantly fewer participants with SLI and autism (i.e., the groups with language impairment) showed neural responses to the second tone than their peers with typical language. The response to the second tone was indicative of adequate resolution of ATI at 150 ms, thus the groups with SLI and autism appeared to have impaired ATI (Oram Cardy et al., 2005). These results suggest that impairment in ATI is associated with language impairment.
(Benasich et al., 2006). Responses were smaller in infants who had a family history of SLI at an ISI of 70 ms, but not at an ISI of 300 ms.
By contrast, Kwok (2013) measured ATI in children with and without language impairment and found no significant differences between groups. Her study measured ATI using a passive event-related potential (ERP) paradigm, which offered the same benefits as reported by Oram Cardy et al. (2005). The sample consisted of 50 children between the ages of 6 and 11 years (TD: n = 25, M = 9.23 years, SD = 1.14; SLI: n = 25,
M = 9.25 years, SD = 1.44). Participants listened to five conditions: one of a single tone presented repeatedly (One Tone) and four consisting of tone pairs that were presented with ISIs of 100ms, 200ms, 300ms or 400ms. Brain responses from the One Tone condition were subtracted from responses for each of the tone pair conditions to investigate whether children with typical development differed from children with language impairment in their neural responses to the second tone when different ISIs were used. There were no significant differences in neural responses between groups in any of conditions used in this study (Kwok, 2013). This study suggested that there is no difference in ATI between children with and without language impairment.
Maturation of Auditory Temporal Integration
become smaller. Fox et al. (2010) used EEG to examine ATI in 28 children aged 7 to 9 years and 15 young adults. Participants heard two tones that were separated by ISIs of 25, 50, 100, 200, 400, and 800 ms. The children showed a distinct neural response to the second tone when the tones were presented with an ISI of 200 ms or higher, while the adults demonstrated a neural response when the tones were presented with an ISI of 25 ms or higher (Fox et al., 2010). This suggests that adults have a shorter temporal window of integration than children, indicating maturation of ATI.
Wang, Datta and Sussman (2005) used MEG to investigate the length of the temporal window of integration of young children aged 5-8 years (n = 11), older children aged 9-11 years (n = 9), and young adults (n = 6) using a double-deviant mismatch field (MMF) paradigm. Each group of participants listened to a stream of standard tones of 440 Hz played at 80 dB that were randomly replaced on 15% of trials with a frequency deviant tone of 494 Hz played at 80 dB that was immediately followed by an intensity deviant tone of 440 Hz played at 65 dB. Four thousand stimuli were presented in total (3400 standards and 600 double-deviant pairs) in each of four stimulus onset
Processing Speed in Children with Language Impairment
From the review above, it is clear that children with LI have atypically long windows of ATI and that the window of ATI decreases with increasing age in typical development. What is unknown is whether the processing involved in ATI is isolated to the auditory system, or part of a larger, global processing system. Miller, Kail, Leonard and Tomblin (2001) studied a variety of linguistic and non-linguistic reaction time measures in children with SLI (impaired language and PIQ in the normal range) and Nonspecific Language Impairment (NLI; impaired language and PIQ below the normal range). The children with typical language development performed faster on both linguistic and non-linguistic tasks than children with SLI, who performed faster on both linguistic and non-linguistic tasks than children with NLI. Their results support a theory of generalized slowing in children with SLI as explained by Kail (1994), which stipulates that children with SLI perform more slowly than children with typical development on all types of processing tasks by a constant factor.
Maturation of Information Processing Speed
The human central nervous system processes incoming sensory stimuli using multiple processing systems. Perception is the mechanism by which incoming sensory stimuli is received and interpreted by the body (Julesz & Hirsh, 1978). The time it takes to react to this incoming stimuli and to make a decision about it is termed global
Information processing speed, like auditory processing and ATI, has been shown to mature with age. Kail (1991) compiled data, by age band, from 72 studies that
compared response times (RT) of 1,826 children or youth with typical development (TD), to those of adults. The developmental age bands Kail used were 3-4, 5, 6, 7, 8, 9, 10, 11, 12, 13 and 14 years. UsingRT = a + b + c… as a formula for RT, where a, b and c are the time required for various mental processes, Kail was able to adjust the formula using a constant, m,as a slowing coefficient for each age band, in order to demonstrate the maturation of information processing speed. Using the slope of the function to compare the children’s RTs to the adults’ RTs, Kail calculated m values for each age band. The calculated m values, or slowing coefficients, ranged from 3.102 for 3-4 year-olds to 1.290 for 14 year-olds and showed a general decline. That is, RTs become faster as age
increases. This suggests that as children become older, their RTs in speeded tasks of information processing become closer to adult levels.
Kail (1992) performed a similar analysis using studies that had investigated the RTs of individuals with varying levels of impaired cognitive development compared to age matched individuals with TD. Subgroups were created based on age and level of cognitive ability, as indexed by IQ. The RTs of individuals in three age bands (12-16, 17-33 and 39-45), with four ranges of IQ (SS = < 17-33, 50-63, 64-67, and 68-71), were
involves slower RTs, which may reflect slower information processing speed (Kail, 1992).
Information Processing Speed and Intelligence
Investigating the relation between information processing speed and intelligence dates back to the 1920’s. In 1927, Thorndike, Bregman, Cobb and Woodyard concluded that, “Other things being equal, the more quickly a person produces the correct response, the greater is his intelligence.” (p. 24). General intelligence, that is, psychometric g, and IQ are two ways in which intelligence is frequently reported in studies of information processing speed.
First Kranzler and Jensen (1991), then Carroll (1991), performed a factor analysis investigating the make-up of psychometric g, with different results. Kranzler and Jensen initially addressed the question of whether psychometric g is one unitary process or multiple independent processes. Kranzler and Jensen reported that g is composed of multiple, independent processes that share some common variance, potentially due to a common speed of processing factor. They determined this by performing a stepwise multiple regression on independent variables. Each variable added a significant
contribution to R2 in predicting g. Thus, they concluded that psychometric g cannot be a unitary process (Kranzler & Jensen, 1991). Carroll performed slightly different analyses and concluded that it was more probable that g is one unitary process. In Carroll's
although efficiency of information processing is not a perfect measure of g, it does make an important contribution to g.
Coyle, Pillow, Snyder and Kochunov (2011) performed the first study to directly link information processing speed to the development of g. Coyle et al. used the Armed Services Vocational Aptitude Battery (CAT-ASVAB forms 1 & 2, 2006; CAT-ASVAB forms 3 & 4, 2009; CAT-ASVAB forms 5-9, 2008; P&P-ASVAB forms 23-27, 2012) to measure the correlation between information processing speed and g in a group of adolescents aged 13-17 years. They found that both information processing speed and g
improved with age. The mean effect of age on information processing speed was 0.34, and the mean effect of age on g was 0.29. Information processing speed and g were more strongly related, with a mean effect of 0.77 (Coyle et al., 2011). The results indicated that performance on information processing speed tasks and g in individuals are related. As g
is a general measure of intelligence, those with faster information processing speeds have higher levels of intelligence (Coyle et al., 2011).
Inspection Time and Intelligence
The presentation time of the two lines is adjusted to determine the shortest duration at which the participant can identify the longest line. The participant’s required accuracy (i.e, % correct response rate) varies depending on the specific paradigm being used. IT measures processing speed irrespective the motor confounds associated with reaction time tasks (Williams, Turley, Nettelbeck, & Burns, 2009). The length of time that is required to respond is not important relative to the amount of time required by the participant to make a correct observation about the stimuli (Williams et al., 2009). This eliminates some of the behavioural (motor speed) confounds of other reaction time tasks on measuring information processing speed.
Sheppard and Vernon (2008) performed a meta-analysis spanning 50 years and including 172 studies, which examined the relation between intelligence and information processing speed, as measured by IT. They investigated the correlations between IT and RT and between IT and g. Overall, they found that reaction time and IT were negatively correlated with g (r = -0.26). This means that longer reaction times or slower speeds of information processing signify overall lower g. IT was more highly correlated with g (r = -.36) than RT, although there were only 36 studies in the IT-g analysis relative to 112 studies included in the RT-g analysis.
uncorrected correlation between IT and intelligence in this meta-analysis was r = -0.30, which is similar to the correlation between IT and g found by Sheppard and Vernon (2008). While an overall correlation was reported, there are gaps in the results that are not fully explained. Confidence intervals are reported for some, but not all, analyses, and the corrections made on the correlations are not explained in detail. Since the publication of these meta-analysis results, use of IT as a measure of information processing speed has increased.
Aims
To summarize, there is support for a relation between ATI and language
development, and there is support for a relation between speed of information processing, as measured by IT, and intelligence. What remains unclear is whether ATI connections with language are domain specific (i.e., isolated in the auditory and language systems) or domain general (i.e., part of a larger global processing function). The purposes of this study were to investigate: (a) the relation between ATI and language, (b) the relation between information processing speed and IQ, and (c) the relation between ATI and other cognitive processes, namely intelligence and information processing speed (as measured by IT), in 5- to 6-year old children with typical development.
Hypotheses
Piercy, 1973). We also hypothesized that information processing speed and intelligence would be related, as supported by earlier studies (Coyle et al., 2011; Grudnik & Kranzler, 2001). Our final hypothesis, based on the ATI theory of SLI, is that ATI and IT, and ATI and IQ, would not be correlated. Under this theory, difficulties specific to auditory temporal processing, rather than global processing abilities, are a key contributor to language impairments. By extension, language functioning should be correlated with ATI but not with an index of global processing, IT. An alternate hypothesis is that ATI is merely one index of maturation of the overall processing system, and is only linked to language abilities to the extent that linguistic development is driven by overall processing ability. Under this alternate hypothesis, ATI and IT would be correlated with one another and with language ability.
Method
Participants
A total of 29 five and six-year-old children were recruited for this study through an existing epidemiological pool of children from London, Ontario schools who
participated in a language screening study in early 2014 and indicated they would be willing to be contacted again about studies in the future. Three participants were excluded because they had a first language other than English, resulting in a final sample of 26 five and six-year-old children (M = 6.05, SD = 0.24 years), all with typical development. Participants were recruited through phone calls and personal emails.
relation between ATI and language, and the distinction between those with and without LI in ATI thresholds, is more evident at younger ages. Examining this relation earlier in development may allow us to capture a relation that had slowed or begun to plateau by 8-13 years of age.
All 26 participants in the final sample spoke English as their primary language and had no neurological, hearing or visual impairments according to their parents/ guardians. Participants either came to Western University or were tested in their homes. Each participant spent approximately one hour completing tests of language ability, intelligence, ATI and information processing speed.
Measures
Participants completed a battery of tests assessing language ability, intelligence, ATI and information processing speed.
Language Ability
Language ability was assessed using the Clinical Evaluation of Language
Fundamentals-Preschool 2 (CELF-P2, Wiig, Secord, & Semel, 2004). The CELF-P2 is a standardized test that is used to measure language ability and identify language
Vocabulary measures the child’s ability to name pictures of objects, actions and people (Wiig et al., 2004).
Language ability was also assessed using the Peabody Picture Vocabulary Test-Fourth Edition (PPVT-IV, Dunn & Dunn, 2007). The PPVT-IV is a valid and reliable norm-referenced receptive vocabulary test for people aged 2 years, 6 months to 90 years. In the PPVT-IV, children are orally presented with a word and shown four pictures. They are required to choose the one picture that best goes with the given word (Dunn & Dunn, 2007).
Each participant’s CLS and PPVT standard scores were averaged to create an overall language composite. This composite ensured that receptive and expressive vocabulary, and receptive and expressive language structure were included in the language measure used to investigate the correlation between ATI threshold and language.
Non-Verbal Intelligence
We elected to examine PIQ rather than overall (full scale) IQ because PIQ offers an opportunity to measure intelligence independent from language, which was measured using the CELF-P2 and the PPVT-IV. In samples that include children with language impairment, PIQ provides a measure of IQ that is not confounded by linguistic ability. Using Verbal IQ (VIQ) or Full Scale IQ (FSIQ) as measures of IQ include tests that draw on language ability. When the sample contains children whose language ability is known to be impaired, PIQ offers an IQ score that is not artificially lowered by the language ability of those participants with language impairment.
Although a number of the previously reviewed studies of the relation between inspection time and IQ used FSIQ measures, links specifically between inspection time and PIQ have been reported. Of particular relevance here, Nettelbeck and Young (1989) demonstrated a significant correlation between PIQ and inspection time in a sample of six-year-old children.
Auditory Temporal Integration
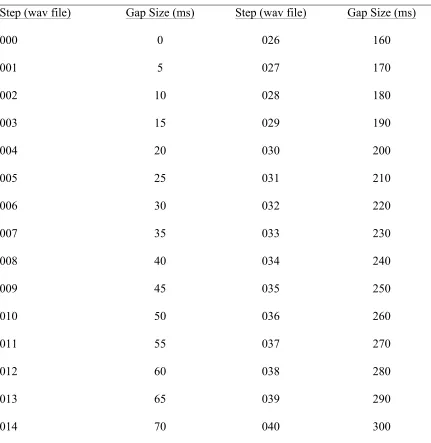
The Bird Task is a computerized behavioural task that measured ATI. The participants were tasked with listening to a pair of birds chirp twice each and identifying which bird chirped with a longer gap between chirps. In each trial, one bird chirped with 0 ms between chirps. The other bird chirped with a gap of varying lengths depending on accuracy of earlier trials. Which of the two birds had the 0 ms gap varied with each trial. The Bird Task generated an ATI threshold, which is the threshold at which the participant was 75% accurate in identifying the slowest chirp.
Bishop, 2005) to adjust the gap size between chirps for each trial. In this protocol, four tones were presented in pairs and participants were required to make a choice about which tone pair had a longer gap between tones before moving on to the following trial. Gap sizes varied depending on the accuracy of the responses to earlier trials. Participants began with five practice trials, which started with a gap size of 500 ms. These practice trials followed the same PEST procedure as the experimental task itself. After each response, the program provided feedback on response accuracy in the form of a celebratory tone for correct responses or a sigh for incorrect responses. The examiner provided additional explanations and coaching as needed, and, where necessary, repeated the practice trial if the child appeared not to understand the task. Participants then started the task and had to complete eight reversals or 40 trials, whichever occurred first. A reversal occurred when a correct response was followed by an incorrect response, or an incorrect response was followed by a correct response.
In the Bird Task, the first tone of each tone pair was a 50 ms 440Hz tone and the second tone of each pair was a 50 ms 490Hz tone. Both tones were recorded with
onset/offset ramps of 10 ms, meaning that the first 10ms of the tone contains an increase in amplitude from 0-100% and the final 10ms of the tone contains a decrease in
tones that ensured a file duration of 600 ms, so as to prevent visual cues in the task. The first trial contains a gap of 500 ms and following two correct responses the length of the gap between tones is reduced. Based on the participant’s accuracy, the length of the gap between tones is adjusted. The threshold, in ms, is determined using the average gap size following the fourth reversal.
Table 1.
Gap Sizes Between Tones
Step (wav file) Gap Size (ms) Step (wav file) Gap Size (ms)
000 0 026 160
001 5 027 170
002 10 028 180
003 15 029 190
004 20 030 200
005 25 031 210
006 30 032 220
007 35 033 230
008 40 034 240
009 45 035 250
010 50 036 260
011 55 037 270
012 60 038 280
013 65 039 290
015 75 041 320
016 80 042 340
017 85 043 360
018 90 044 380
019 95 045 400
020 100 046 420
021 110 047 440
022 120 048 460
023 130 049 480
024 140 050 500
025 150
Each bird in the bird task moved up and down with the two tones, that is, when they were “chirping.” It was intended that this would provide a visual cue about which bird was chirping, but not provide any visual cues about the duration of their chirps. However, at the outset of the study, the birds were unintentionally programmed to move up and down with the specific timing of the two tones. For example, the bird whose chirps were separated by 0 ms moved up, and then moved down 0 ms later (i.e.,
irrespective of the length of the gap in between chirps. An independent samples t-test confirmed that visual cues about gap duration did not result in any differences in the ATI estimates between the children who performed the task before versus after the
adjustment.
At the outset of the study, the task instructions to the children were:
These two birds make different sounds. One bird chirps slowly. He makes one chirp, waits, than makes another chirp. The other bird chirps really fast. Listen very carefully and tell me which bird chirps the slowest. Is it the bird on the red box or the bird on the yellow box? You need to listen carefully because it won’t always be the same bird. Let’s practice a few first.
During data collection, we observed that these instructions were not sufficient for some participants during the practice trials. Specifically, some children were confused by the task of identifying the bird that chirped the slowest. To make the instructions more understandable, alternative explanations were used, including asking the child to select the bird that chirped twice instead of once, waited longer in between its chirps, or
chirped, had a long pause and chirped again. The use of these alternate explanations made the instructions more understandable for children in this sample.
Information Processing Speed
bumblebees then appeared on both flowers to mask the initial stimulus (i.e., Benny). Participants were tasked with identifying which flower Benny the bee landed on before the mask (see Figure 1 for an example; Williams et al., 2009). Using an adaptive staircase algorithm, the time between Benny landing on the flower and his friends arriving at the flower changes depending on the accuracy of previous trials. The Benny Bee IT task produces a threshold at which the participant is 79% accurate at identifying the flower that Benny the Bee landed on first.
The Benny Bee IT task was validated against the Pi-figure IT task, which is commonly used to test IT in adults (Evans & Nettelbeck, 1993; Vickers et al., 1972). The Benny Bee IT task correlated r = .527 p < .001 with the Pi-figure IT task in a group of adults. Williams et al. (2009) presented the Benny Bee IT task at two time points to 71 four-year-old children (M = 4.45, SD = 0.27). The test-retest reliability between time 1 and time 2 for the children was r = .793, p < .001, indicating no practice effects and good reliability.
Statistical Analyses
Pearson’s product-moment correlations were run between the following variables: age, language ability (CLS, PPVT and Language Composite), PIQ, ATI threshold (ms) and IT threshold (ms). Direct entry regression analyses were also run on ATI and IT using Age, CLS, PIQ and ATI or IT as predictors.
Results
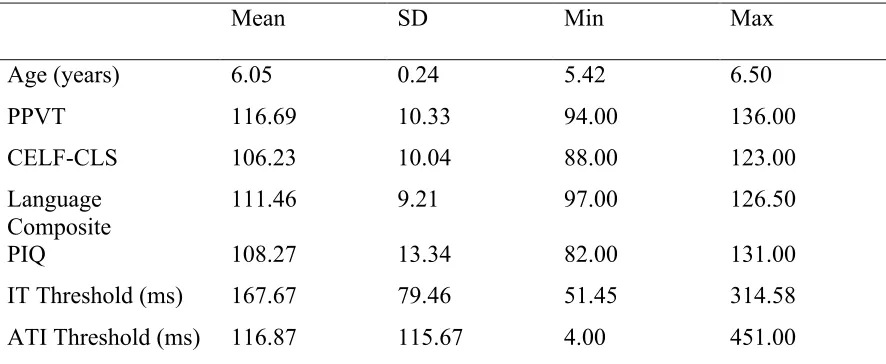
Demographic information for the sample on all variables is provided in Table 2. Table 2
Demographic Information
Note. Peabody Picture Vocabulary Test (PPVT), Clinical Evaluation of Language Fundamentals (CELF) and Performance IQ (PIQ) are standard scores with M = 100 and
SD = 15.
Outlier Analysis
Outliers were defined as participants with scores that fell more or less than 3 SD from the mean. In both experimental tasks (The Bird Task and The Benny Bee IT task), there were no participants whose ATI threshold or IT threshold fell outside +/- 3 SD.
Mean SD Min Max
Age (years) 6.05 0.24 5.42 6.50
PPVT 116.69 10.33 94.00 136.00
CELF-CLS 106.23 10.04 88.00 123.00
Language Composite
111.46 9.21 97.00 126.50
PIQ 108.27 13.34 82.00 131.00
IT Threshold (ms) 167.67 79.46 51.45 314.58
Therefore, no participants were excluded for being outliers based on their ATI thresholds or their IT thresholds.
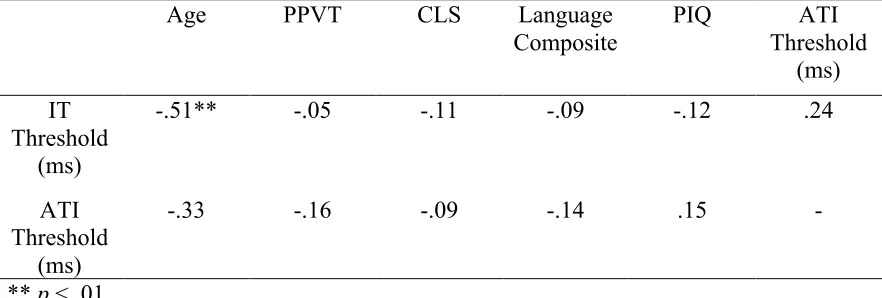
Pearson’s Product-Moment Correlations
Correlations were run between the experimental tasks and the other behavioural measures. There was a significant correlation between inspection time threshold and age,
r(25) = -.51, p < .01. The correlations between the other standardized and experimental variables were not significant. The expected relations between processing speed tasks and language and IQ were not significant (see Table 3).
Table 3
Bivariate Correlations Between Experimental Measures and Psychometric Measures
Age PPVT CLS Language
Composite
PIQ ATI
Threshold (ms) IT
Threshold (ms)
-.51** -.05 -.11 -.09 -.12 .24
ATI Threshold
(ms)
-.33 -.16 -.09 -.14 .15 -
** p < .01
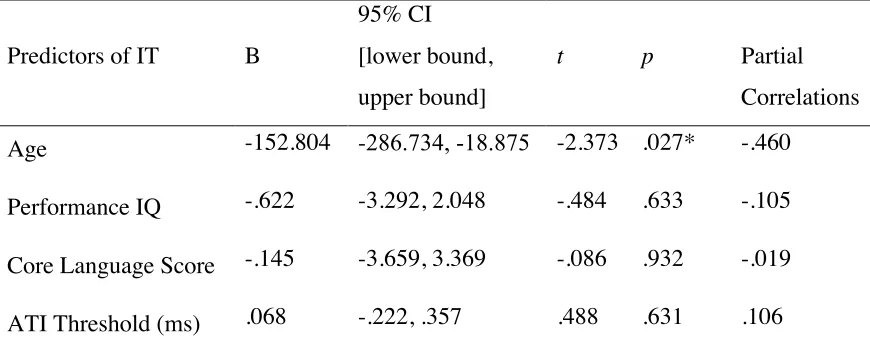
Regression
Two direct entry regressions were run. The first was conducted on ATI threshold with Age, CLS, PIQ and IT threshold as predictors. The second was conducted on IT threshold with Age, CLS, PIQ and ATI threshold as predictors. In the regression
not significantly predict variation in IT threshold. Overall, the model explained 14% of the variability in IT threshold (see Table 5).
Table 4
Summary of Coefficients, Confidence Intervals, t-values, p-values and Partial Correlations for ATI
Predictors of ATI B
95% CI [lower bound, upper bound]
t p Partial
Correlations Age -126.260 -354.266, 101.746 -1.152 .262 -.244
Core Language Score -2.042 -7.442, 3.357 -.787 .440 -.169 Performance IQ 2.217 -1.846, 6.279 1.135 .269 .240 IT Threshold (ms) .165 -.538, .868 .488 .631 .106
Note. Model accounts for 1% of the variability in ATI; p > .05; CI = confidence interval; * = significant variable; ATI = Auditory Temporal Integration; IT = Inspection Time. Table 5
Summary of Coefficients, Confidence Intervals, t-values, p-values and Partial Correlations for IT
Predictors of IT B
95% CI
[lower bound,
upper bound]
t p Partial
Correlations
Age -152.804 -286.734, -18.875 -2.373 .027* -.460 Performance IQ -.622 -3.292, 2.048 -.484 .633 -.105
Core Language Score -.145 -3.659, 3.369 -.086 .932 -.019
ATI Threshold (ms) .068 -.222, .357 .488 .631 .106
Discussion
In the current study, we measured ATI, language, information processing speed and intelligence to investigate whether ATI is related to language and isolated to the auditory processing system, or whether it is a more global process related to global processing speed and intelligence in young children. We sought to examine the relations between ATI and language, and between IT and intelligence, and to determine whether ATI may be domain specific (i.e., isolated to the auditory system) or domain general (i.e., part of a larger, global processing system). To do this, ATI and information processing speed were measured behaviourally, using the Bird Task and the Benny Bee Inspection Time task, respectively. Standardized tests evaluated participants’ oral language abilities and PIQ. Correlational analyses investigated the relation between ATI and language and between ATI and other cognitive processes, namely information processing speed as measured by IT and nonverbal intelligence. Regression analyses examined the predictive effect of language, intelligence and age on ATI and IT, separately.
As reported in the Results section, the correlation between age and IT was
significant. By contrast, there were no significant correlations between ATI and language, ATI and IT, and IT and PIQ, suggesting that these processes are not related. Not only were the correlations not significant, but they also were quite weak and could have occurred due to chance. The absence of expected correlations between these cognitive processes makes it difficult to interpret whether ATI is a specific or domain-general process. Despite the lack of significant results, we do not have sufficient
The Relation Between ATI and Language
The primary aim of this study was to investigate the relation between ATI and language in young children using a behavioural measure of ATI. We hypothesized that ATI and language would be related in our sample based on support from prior studies demonstrating this relation between ATI and language (Benasich & Tallal, 2002; Bishop & McArthur, 2005; Korpilahti & Lang, 1994; Oram Cardy et al., 2005; Tallal & Piercy, 1973; Tallal & Stark, 1982). Children who performed better on the CELF-P2 were hypothesized to require smaller gaps between chirps on the Bird Task to identify the bird that chirped the slowest, and children with lower CELF-P2 scores were expected to require larger gaps between chirps to detect a difference between the two birds. Contrary to these findings, our analysis did not show a significant correlation between ATI and language ability. Possible explanations for this unexpected result, discussed in further detail below, relate to (a) an issue with sample composition, (b) an issue with the nature of the Bird task, and (c) a relation that may not, in fact, exist.
Sample Composition
Smyth, Archibald, Purcell, and Oram Cardy (2014) found that ATI as measured by the Bird Task and language were significantly correlated in a combined sample of 36 8-13 year old children with and without language impairment. However, the correlation was not evident within each group alone. That is, ATI and language were not
was split by language ability. The sample studied in the present thesis, much like the group with typical development in our prior study, consisted of 26 children whose
language scores were within the average to above average ranges, with many participants approaching 2 SD above the mean. This range restriction was unintentional, but rather an artefact of recruitment from the epidemiological sample: parents who agreed to
participate happened to have children who were developing language normally or even precociously. This might account for the low correlations between ATI and language found here.
When there is a restricted range of scores, the sensitivity to detect a correlation between measures is highly reduced because there is small variability (Sackett & Yang, 2000). In the present study, to detect how differences in language scores are related to differences in ATI, differences in both scores must exist (Howell, 2010). Although the variation in ATI is large in our sample, the variation in language scores was less so, decreasing the ability to detect a correlation in this sample.
What Does the Bird Task Measure?
impairment is temporal, other hypotheses may explain the differences in performance on these tasks. The tones presented in these tasks are often different frequencies.
Researchers have questioned whether the impairment has to do with discrimination at the temporal level, discrimination at the frequency level, or some interaction of the two (Burlingame, Sussman, Gillam, & Hay, 2005; Hill, Hogben, & Bishop, 2005). The Bird Task requires children to make a decision about the relative gap size between two tone pairs. Although the tones within each tone pair are not the same frequency, the task does not require the participant to discriminate the frequencies because both tone pairs have the same two tones in the same sequence. If, as has been questioned, the impairment in children with SLI exists at a frequency discrimination level, the Bird Task would likely not capture this difference between children with TD and children with SLI. A more thorough analysis of what the Bird Task measures is discussed towards the end of the Discussion.
No Relation between ATI and Language?
A final explanation for the lack of significant correlation between ATI and language is that there may be no relation between ATI and language development. As discussed in the Introduction, behavioural paradigms have shown inconsistencies in identifying group differences in ATI between individuals with and without language impairments. The literature investigating the relation between ATI and language development has also presented contradictory results. McArthur and Bishop (2001) reviewed the results of 35 studies that measured ATI behaviourally and found a mix of results, some of which support a difference in ATI, and some of which identify no
researchers used to measure ATI have been varied. Although different tasks are often used to measure ATI, if an impairment in ATI exists in children with a language
impairment, the tasks should all capture this impairment (McArthur & Bishop, 2001). If some tasks are finding impaired ATI and some are not, there may be an inconsistency in what the tasks themselves are measuring.
How Do We Explain Neurophysiological Evidence?
While there are confounding variables that are associated with measuring ATI using behavioural tasks, there remains support for the relation between ATI and language ability from passive neurophysiological paradigms. For the present study, the absence of a relation between ATI and language might be explained by confounds associated with using the Bird Task, an active paradigm. If there is really no relation between ATI and language, the passive neurophysiological results supporting impaired ATI in individuals with SLI remain unexplained. Many of the neurophysiological studies of ATI use passive auditory paradigms in which ATI is assessed based on neural responses to simple tones without any active response required by the participant (See Clunies-Ross, Brydges, Nguyen, & Fox, 2015; Fox, Anderson, Reid, Smith, & Bishop, 2010; Kwok, 2013; Oram Cardy, Flagg, Roberts, Brian, & Roberts, 2005 for examples). The passive component of the paradigms ensures that external factors, such as attention, memory, motivation and learning, are not confounding. The support in the literature for a relation between ATI and language based on the use of passive neurophysiological tasks limits the likelihood that the lack of correlation between ATI and language in the present study reflects a true lack of relation between these functions.
The Relation Between ATI and Cognitive Processes
As was expected, ATI was not significantly correlated with IT or with PIQ. These results can be interpreted in several ways. Based on the discussion in the previous
correlation could also suggest that domain-general information processing speed is related to a level of auditory processing that is not captured by tests of ATI. Finally, the absence of a significant correlation could suggest that ATI is a domain-specific process and is isolated to the auditory system, as we hypothesized.
Study Design Issues
As has been previously discussed in the section on ATI and language, there were aspects of study design that may have impacted the correlational results. First, the sample composition may have affected not only the correlation between ATI and language, but also other correlations in the study. Reduced variability in scores may have reduced the ability for the study to detect relations between all tasks (Howell, 2010). The PIQ scores in this study ranged from 82-131. There was only one child who scored below 90 and the rest of the sample ranged from 90-131. The IT task also showed a reduction in range. The range of thresholds in the Benny Bee IT task for this study was 51-315 ms. When
compared to the range of IT reported by Williams et al. (2009), which was 88-644 ms, it is apparent that our study had a truncated range in IT thresholds. The difficulty associated with a reduced range of scores to detect correlations between ATI and language is much the same as the difficulty in finding correlations between ATI and PIQ and between ATI and IT threshold.
Domain-General Process at Another Level of ATI
The theory of domain-general processing cannot be ruled out due to the absence of a significant correlation between ATI and PIQ and between ATI and IT. It may be that on some level, ATI is a domain-general process that is related to overall information processing speed and that the Bird Task is tapping ATI at an auditory specific level. There is support in the literature for the possibility of a domain-general theory. The theory of rapid temporal processing posits that auditory temporal processing is dependent on the speed at which information can be processed at a pansensory level, that is,
including but not restricted to the auditory modality (Tallal, Stark, & Mellits, 1985). Rammsayer and Brandler (2007) collected data on 15 intelligence tasks and 8 temporal tasks. They performed a principal components analysis on the psychometric tasks of intelligence to estimate psychometric g. Seven temporal tasks that were auditory in nature, loaded on a temporal g factor that was significantly correlated with psychometric
g (r = 0.56, p < .01). These results suggest that higher psychometric g is correlated with better performance on temporal auditory tasks (Rammsayer & Brandler, 2007). This supports a relation between auditory temporal processes and overall psychometric g. In the study by Rammsayer and Brandler, one auditory temporal task did not load on the temporal g factor, and was not significantly correlated with psychometric g.
ATI as a Domain-Specific Process
The absence of a significant correlation between ATI and PIQ and between ATI and IT in this study may also suggest that ATI is, in fact, a domain-specific process. While there is support in the literature for a domain-general theory, there is also support in the literature for ATI as a domain-specific process. According to the definition of SLI, children with SLI have impaired language without impairments in nonverbal intelligence (Leonard, 1998). It may then be reasonable that ATI, a process thought to be related to language, and PIQ and IT, processes related to intelligence, may be independent. However, the absence of a relation between ATI and IQ and ATI and IT found here would provide more compelling support for the domain-specificity of ATI if the relation between ATI and language had been significant in this study. The lack of a relation between ATI and language raises significant questions about the Bird Task, which limit the ability to draw conclusions from the absence of correlations between ATI and IQ and between ATI and IT.
The Relation Between IT and PIQ
possible, it seems unlikely that limitations of the task itself account for the lack of a significant correlation between IT and PIQ, as the validity and reliability of the Benny Bee IT task were well documented (Williams et al., 2009). In the Williams et al. validation sample, a correlation of r(67)= -.535, p < .01 was found between the Benny Bee IT task and the unrotated first principal component of a principal component analysis of four psychometric tests, which represented an approximation of g.
Because the correlation between IT and IQ has been widely established, there are two more probable explanations for the absence of a significant correlation between IT and IQ in this study. The first is a reiteration of the explanation for other non-significant correlations in this study, study design. The second explanation is that our decision to use PIQ as our measure of intelligence may have impacted the correlation between IT and IQ.
Study Design
PIQ as a Measure of IQ
The decision to use PIQ as a measure of IQ in this study stemmed from our desire to have a measure of intelligence that was independent from language, which was
measured using other tools. Full-scale IQ (FSIQ) and verbal IQ (VIQ) both contain tasks that have verbal demands and as such, PIQ was chosen as a measure of IQ so as to eliminate the effect that the verbal demands would have on IQ estimation.
Maturation of IT
One relation of interest that has been supported in the literature and that we found to be significant in our sample was the correlation between IT and age. Despite a narrow age range (5.42 – 6.50 years), which reduces variability, a significant correlation was found between age and IT. This result suggests that the IT-age relation is quite strong. The regression run on predictors of IT demonstrated that age was a significant predictor of IT. The results of the regression suggested that as children age, their performance on the IT task improves at a rate of 14 ms/month. The results of this age analysis suggest that despite low variability, strong relations can be demonstrated in smaller samples.
How Effective is the Bird Task as a Measure of ATI?
The lack of predicted correlations between ATI and language, and ATI and age raise the possibility that the Bird Task is not an effective measure of ATI. As has been previously discussed, the Bird Task is a paradigm that requires the active participation of children. Although we made efforts to design the task in a way that it would be easier and more engaging than some other psychobehavioural ATI tasks used in the literature, the active response component, in and of itself, created a risk for confounds because of possible demands on cognitive factors such as attention, memory, motivation and learning.
third tone is the target tone; the second tone is always the same in frequency as the target. The remaining tone is different in frequency. The participant must identify whether the first or the third tone is the same as the second tone. This task format reduces verbal labeling because it doesn’t require participants to associate labels (i.e., low or high) with tones. That is, it reduces memory load through eliminating the absolute determination about the stimuli (i.e., were the tones ordered low high or high low) after making the relative judgment. Using a task with reduced memory and verbal labeling load ensures that the score obtained better represents the auditory processing ability of those being tested (McArthur & Bishop, 2004). A similar task to 3I-2AFC paradigms is the six interval backward task (6I). In 6I paradigms, three tone pairs are used and participants must decide whether tone pair two is the same as tone pair one or tone pair three. The 6I paradigms seem to most reliably and most effectively measure auditory processing for young children (Sutcliffe & Bishop, 2005). Based on the temporal uncertainty account,
Limitations and Future Directions
One limitation of this study was that the sample was intended to be a
representative sample of 5 and 6-year-old children and be made up of children with a full range of abilities. Instead, the children who agreed to participate in this study were 26 children with typical development. No children with lower language and/or intelligence agreed to participate. Participants were recruited as part of a kindergarten screening validation study with the intention of recruiting children of all ability levels. The
participant pool consisted of over 200 kindergarteners, some of whom were contacted for a follow-up visit to validate the language results of the screening study as well as
participate in the experimental tasks for this study. Children who had performed at all levels on the screener were invited for this study. If we had been able to recruit some participants with lower ability levels, the variance in language and IQ scores would have been more dispersed and correlations may have been easier to identify (Deary et al., 1989).
Another limitation is that we have not conducted any investigations to determine whether the Bird task is a valid or reliable measure of ATI. This is problematic because the aims of this study were focused on ATI and its relation to a number of cognitive factors. The results of this study would have been more interpretable if we could identify with some degree of certainty that the Bird Task was measuring ATI.
we had hoped to investigate whether this relation was stronger at a younger age. It is possible that the range chosen was too narrow and, if expanded, it would show the expected relation between ATI and age. On the other hand, we did find a significant relation between IT and age despite the narrow age range of our sample.
To further investigate the relations between ATI and language, ATI and other cognitive processes, and IT and IQ in children, it would be beneficial to continue recruiting participants to expand the size and variability of the sample. Children with lower language and intelligence scores and across a wider age range would enrich the sample, enabling a more thorough investigation into the relations of interest. Although significant correlations were not seen in the data collected thus far, there is ample support in the literature for these relations and it would be worth investigating further with a broader sample of abilities.
Another priority for future studies is to use a more reliable experimental task to measure ATI or to directly study the reliability and validity of the Bird Task. While the Bird Task may measure ATI, it has yet to be shown. Before using it in future studies, its validity and reliability need to be investigated. Another option would be to use an experimental task to measure ATI that has some existing evidence in support of its validity and reliability, such as one using a 6I-2AFC paradigm (Sutcliffe & Bishop, 2005).
References
American Psychiatric Association. (2013). Diagnostic and statistical manual of mental disorders: DSM-5. Arlington, VA.
Bailey, P. J., & Snowling, M. J. (2002). Auditory processing and the development of language and literacy. British Medical Bulletin, 63, 135–146.
doi:10.1093/bmb/63.1.135
Benasich, A. A., & Tallal, P. (2002). Infant discrimination of rapid auditory cues predicts later language impairment. Behavioural Brain Research, 136(1), 31–49. Retrieved from http://www.ncbi.nlm.nih.gov/pubmed/12385788
Bishop, D. V. M., Anderson, M., Reid, C., & Fox, A. M. (2011). Auditory development between 7 and 11 years: an event-related potential (ERP) study. PloS One, 6(5), e18993. doi:10.1371/journal.pone.0018993
Bishop, D. V. M., & McArthur, G. M. (2005). Individual differences in auditory
processing in specific language impairment: A follow-up study using event-related potentials and behavioural thresholds. Cortex, 41(3), 327–341.
Boersma, P., & Weenink, D. (2014). Praat: doing phonetics by computer [Computer program]. Version 5.3.74, retrieved from http://www.praat.org/
Brand, C. ., & Deary, I. . (1982). Intelligence and “Inspection Time.” In H. Eysenck (Ed.), A Model for Intelligence (pp. 133–150). Berlin: Springer-Verlag Berlin. Burlingame, E., Sussman, H. M., Gillam, R. B., & Hay, J. F. (2005). An investigation of
speech perception in children with specific language impairment on a continuum of formant transition duration. Journal of Speech, Language, and Hearing Research,