Genome-Wide High-Resolution Mapping
by Recurrent Intermating
Using Arubidopsis thulium
as
a Model
Sin-Chieh Liu,
*
Stanley P. Kowalski,
* Tien-Hung
Lan,
*
Kenneth
A.Feldmann’
and
Andrew H. Paterson
*
*
*Department of Soil and Crop Sciences, Texas A b ” University, College Station, Texas 77843-2474, iDepartrnent of Plant Sciences, University of Arizona, Tucson, Arzzom 85721 and rDepartment of Plant and Soil Sciences,
University of Delaware, Newark, Deleware 1971 1
Manuscript received May 8, 1995 Accepted for publication October 7, 1995
ABSTRACT
We demonstrate a method for developing populations suitable for genome-wide high-resolution ge- netic linkage mapping, by recurrent intermating among F2 individuals derived from crosses between homozygous parents. Comparison of intermated progenies to F2 and “recombinant inbred” (RI) popula- tions from the same pedigree corroborate theoretical expectations that progenies intermated for four generations harbor about threefold more information for estimating recombination fraction between closely linked markers than either RI-selfed or F2 individuals (which are, in fact, equivalent in this regard)
.
Although intermated populations are heterozygous, homozygous “intermated recombinant inbred” ( I N ) populations can readily be generated, combining additional information afforded by intermating with the permanence of RI populations. Intermated populations permit fine-mapping of genetic markers throughout a genome, helping to bridge the gap between genetic map resolution and the DNA-carrying capacity of modern cloning vectors, thus facilitating merger of genetic and physical maps. Intermating can also facilitate high-resolution mapping of genes and QTLs, accelerating m a p based cloning. Finally, intermated populations will facilitate investigation of other fundamental genetic questions requiring a genome-wide high-resolution analysis, such as comparative mapping of distantly related species, and the genetic basis of heterosisH
IGH-DENSITY genetic linkage maps of many plants and animals are finding utility in a wide range of basic and applied endeavors ( cf: PATERSON etal, 1991 ) and are now being used to assemble “contig maps”, contiguous sets of DNA clones that span the genomes of several organisms ( COULSON et al. 1988; HWANC et al. 1991; SCHMIDT et al. 1992; COHEN et al.
1993; PUTTERRILL et al. 1993 )
.
A factor of growing importance in genome analysis is the “resolution” of genetic maps, that is the differing power afforded by various experimental designs to de- tect recombination events between closely linked loci. High-resolution maps that accurately order closely linked markers are crucial in “positional cloning” (COLLINS 1992), wherein one seeks genetic map resolu- tion compatible with the DNA “carrying capacity” of “artificial chromosomes”. Assembly of “contig maps” is facilitated by use of closely linked DNA markers to quickly identify sets of large DNA clones corresponding to different genetic loci. Determination of the compara- tive organization of chromosomes in disparate taxa hav- ing gene orders conserved over only short distances is facilitated if closely linked markers can be ordered accurately ( KOWALSKI et al. 1994; see especially Figure
Carresponding authm: Andrew H. Paterson, Department of Soil and Crop Sciences, Texas A&M University, College Station, TX 77843-
2474. E-mail: [email protected]
Genetics 1 4 2 247-258 (JanuaIy, 1996)
2 )
.
Finally, resolution of individual quantitative trait loci associated with complex phenotypes is delimited in part by the amount of recombinational information in a mapping population ( PATERSON et al. 1990).Many genetic linkage maps are based on segregating backcross or F2 populations, in which gametes have un- dergone only a single cycle of recombination, and are rarely recombinant between closely linked loci. At the initiation of genetic mapping, such strong “linkage dis- equilibrium” facilitates establishment of linkage groups among widely dispersed loci. However, as a genetic map becomes densely populated with marker loci, more in- formation is necessary to resolve the linear order of closely linked markers. An efficient method for high- resolution mapping in specific targeted regions of the genome has recently been described ( CHURCHILL et al.
1993) ”however such methods are less amenable to applications in which information is sought for all geno- mic regions simultaneously.
Classical plant breeders, faced with the need to over- come “correlations among traits” (unfavorable genetic linkage), long ago devised a technique suitable for ge- nome-wide high-resolution mapping ( cf: HANSON
1959a,b; MILLER and RAWLINCS 1967; FREDERICKSEN
and KRONSTAJI 1985; KWOLEK et al. 1986; WELLS and
248 S.-C. Liu et al.
individuals within a population, mimicking the random- mating behavior of many natural populations. In a pop- ulation random mated for many generations, homoge- nization of the ancestral chromosomes becomes so
complete (WRIGHT 1969) that genetic linkage between alleles at nearby loci can only rarely be detected ( c f : LANGLEY et al. 1982; LEIGH BROWN 1983; MACPHERSON
et al. 1990)
.
However populations random mated for only a few generations retain sufficient “disequilib- rium” to detect genetic linkage-and harbor more in- formation for ordering closely linked markers, as a re- sult of multiple meiotic cycles ( HANSON 1959a,b).To evaluate the efficacy of recurrent intermating as a strategy for genome-wide high-resolution genetic mapping, an intermated population of Arabidqsis thali- ana was developed and compared with F, and recombi- nant inbred-selfed
(RI
) populations of the same pedi- gree. The results corroborate theoretical expectations, demonstrate an experimental design that is suitable for a wide range of applications, and impel development of intermated populations in crop plants and other or- ganisms. The theoretical expectations for intermated populations were based on calculations assuming large population sizes that have no selfing and were not in- fluenced by the effect of genetic drift. The intermated progenies described herein are being selfed down to provide a homozygous population of ca. 100 individuals that afford rapid genetic orientation of ArabidopsisYAGs or contigs along the chromosomes, contributing to identification of a minimal set of contiguous DNA
clones that span the genome.
MATERIALS AND METHODS
Population development: Arabidopsis thaliana ecotypes Wassilewskija (WS) and mutant stock M13 (biological eco- type Landsberg, carrying angustifolia, Leaf/ Silique Pheno- type, distorter-l, Trichome Phenotype, and e-recta, Size/Inflo- rescence Phenotype; KRANZ and KIRCHHEIM 1987), were hybridized by hand-crossing, the F, verified by RFLP analysis, and the F, selfed to generate F2 seed. A total of 120 F2 individu- als were the starting point for two additional mating schemes, as follows:
Recombinant inbred (Rl-seljed population): Each F2 individual was selfed to generate F3 progeny, a single F3 progeny individ-
ual was selfed to generate F4 progeny, etc., to Fs. At F6, 95 of the 120 FP lineages were still represented, the remainder lost due to sterile plants at intervening generations. Only a subset of RI lines were analyzed.
Recurrent random-intemzating (intermated population ): Each FP
individual was used as the pollen parent in a hand-cross to another randomly chosen F2 individual. Each F2 individual was also used as a seed parent in such a cross, receiving pollen from another FP individual. Cross-combinations were selected using a simple random-number generator (in Microsoft Ex- c e l ) , with the restriction that no repeats or selfs were allowed. From the seed produced by each cross, one plant was grown to flowering, and the procedure repeated. After four genera- tions of random mating, 99 of the 120 FP lineages were still represented, the remainder having been lost due to a sterile plant at one of the intervening generations.
F1 and F2 generations were grown in the greenhouse (in Newark, DE) with 16 hr photoperiod, 22” night temperature,
I I I I I I I I
~
mg
o~
~o
og
mg
oa
9
ma
q
s
o
o
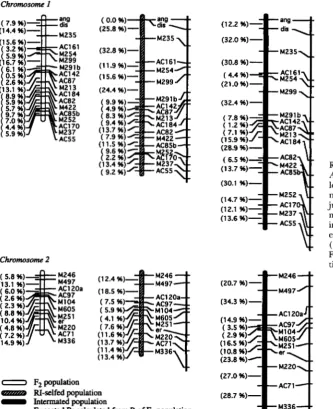
Adjusted recombination fraction per meiosis (r)FIGURE 1 .-Relationship between the adjusted recombina-
tion fraction per meiosis ( r ) and the expected values of the observed recombination fraction ( R ) of F2, RI-selfed, in- termated, and RI-sibbed populations. Values for RI-selfed, in- termated, and RI-sibbed populations are derived from ( 1 ) , ( 3 ) , and ( 9 ) , respectively.
and ca. 27” day temperature; subsequent generations were grown at 16 hr photoperiod and constant 22“, in a growth chamber.
Genetic mapping: All laboratory procedures were as de- scribed previously ( KOWALSKI et al. 1994). DNA probes pre- fixed “M” were provided by E. MEYEROWITZ, while those pre- fixed “AC” are anonymous cDNAs from a library provided by Clontech, Inc (Palo Alto, C A )
.
Data analysis. Determination of recombination fractions utilized MapMaker (LANDER et al. 1987), (generously pro- vided by S. TINGEY, duPont), on a Macintosh Quadra 650. The “observed recombination fraction” ( R ) is an estimate
of the probability of observing a recombinant in a population, and was used to measure the genetic map expansion under the respective breeding systems. Observed recombination fractions and order of loci for RI-selfed and intermated popu- lations were determined by analyzing data as F2 populations, except that residual heterozygotes in the RI-selfed population were scored as missing data, and a LOD score 6.0 was used as linkage threshold in the RI-selfed population ( REITER et
al. 1992).
A likelihood ratio test was used to compare the values of the observed R ( & ) in the RI-selfed and intermated maps with the values of the expected R
(8)
, which were derived for the respective populations from the Rvalues of corresponding intervals in the F2 map. The test statistics arefor RI-selfed population and
for intermated population, where n = number of observations and A , Bo, G,, and Do, and 4, B,,
G ,
and De are ( 1 - R ) ? / 2, R 2 / 2 , 2 R ( 1 - R ) , [R?+
( 1 - R ) ‘ ] / 2 andwith R = R,8
0
v)
8
0 10
v)
7
0
0
2
v)
2
0 0 mv)
a
3
0
In
X
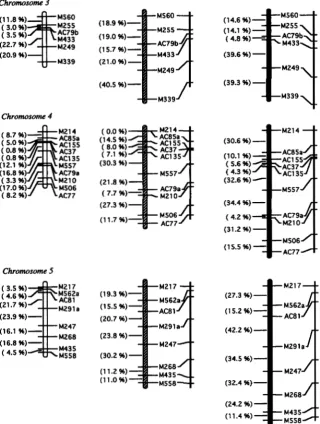
Adjusted recombination fraction per meiosis (1)FIGURE 2.-The precision of the estimated r (adjusted re- combination fraction per meiosis) of FS, RI-selfed, in- termated, and RI-sibbed populations. Measurement is based on the mean amount of information per individual ( iT) rela- tive to F2 population: i, interma& > irF2 > i, Mselfed when 0 <
r < 0.131; irF2
>
iTIntemated > &&elfed when 0.131 < r < 0.196;i F n > iTRI.selfed > z,lntermated when 0.196 < r < 0.5. Values
for F2, RI-selfed, intermated, and RI-sibbed populations are derived from ( 4 ) , ( 5 ) , ( 7 ) , and
( l o ) ,
respectively.However, the tests performed within a population are not independent, because the intervals are not independent.
RESULTS
Expected recombination under different breeding systems: The observed recombination fraction ( R ) of an F2 population is equal to its adjusted recombination fraction ( r ) per meiosis, because an F2 population is derived from a single meiosis. Therefore, the F2 popula- tion, in which R
+
r, is used as the base line for compar- ing map expansion in RI-selfed and intermated popula- tions. HALDANE and WADDINGTON (1931 ) derived the relationship between Rand r for a population of recom- binant inbred strains (derived by selfing) asThe R and T of our RI-selfed population is also defined
by ( 1 ) , because the RI-selfed population contained 97.3% homozygotes on average (96.9% is expected based on the mating scheme). The small proportion of heterozygotes were analyzed as missing data. For an intermated population, the expected R for different generations of intermating is obtained by summing the contribution of recombinant gametes from all mating combinations in the previous generation: = R, -
rRt
+
r/2
,
where t is the number of generations of intermating following F2, and&
= r . Therefore, the0.9 I
,
0.9A
0.8 -
"""
0.7- ..._..._.._.._..
1
.l
0.6-b
2
0.5-L n
Intermated N = 93
RI-selfed N = 59
F2N=98 0.7
0.6
0.8
0.5
0.4
0.3
0.2
B
Intermated N = lo(
RI-selfed N = 100
F,N=100 """
. . . , . . .
I
I
Adjusted recombination fraction per meiosis (r)
FIGURE 3.-Standard deviation ( s ) of the estimated r (ad- justed recombination fraction per meiosis) calculated from
( 8 ) for populations with Nindividuals. ( A ) Our F2 ( N = 98), RI-selfed ( N = 59), and intermated ( N = 93) populations:
Sintrrmated < SF^ < Siwsrifed when 0 < r < 0.131; SF^ < Sintermaced < SRI-selfrd when 0.131 < r < 0.255; SFp < SRIsrlfed < Sintermatcd when 0.255 < r < 0.5. ( B ) F P , RI-selfed, and intermated populations having equal population sizes ( N = 100):
Sincemated < SF2 < SRIselfed when 0 < r < 0.131; SF2 < Sintermated <
SRkelfed when 0.131 < r < 0.196; F''S < SKheifed < S,,termatrd when
0.196 < r < 0.5.
relationship between R and r in an intermated popula- tion can be derived as
1
2
R = - [ l - ( 1 - r ) , ( l -
2 r ) ] ,
( 2 )and the R and r of our intermated population have a relationship of
1
2
R = - [ l - ( 1 - r ) 4 ( l -
2 r ) l .
( 3 )The expected R of our intermated population is larger than that of a RI-selfed population for 0
<
r<
0.5 (Figure 1 ).
However, the degree of map expansion in both intermated and RI-selfed populations (relative to the F2) depends on the values of r, i e . , the larger the value of r, the less the expansion. Maximum expansion occurs at values of r approaching 0: at which point a twofold expansion in RI-selfed population ( HALDANEand WADDINGTON 1931 ) and a threefold expansion in intermated population is expected, because
respectively.
250
Chromosome I
(1 4.4 %)-
M235
S.-C. Liu et al.
Fzpopulation amZc0 RI-selfed population
-
Intermated population-
Expected R calculated fmm R of F2 populationchromosome 2
( 5.0 96) M246 (13.1 96) M497
( 6.0 96) ACl20a ( 2.6 96) AC97 ( 2.3 96) M104 ( 0.0 96) M605
(1 0.4 96)
( 4.0 %) M220
(1 4.9 %) M336
tp
1( 7.2 96) AC7 1
precision of estimates of r, in F2, RI-selfed, and in- termated populations can be compared based on the mean amount of information
(i,)
provided by a single individual in each population. MATHER ( 1936) derivedi, of a single F2 individual as
2 ( 1 - 3 r + 3 2 ) r ( 1 - r ) ( l - 2 r + 2r2) '
2, = ( 4 )
By following similar derivation, i, of a single lineage in a RI-selfed population was derived as
0
2, = L
r ( 1
+
2r)Z 'and i, of a single lineage in an intermated population was derived as
( 1 - r ) 2 L - 2 [ 2 ( 1 - r ) + t ( 1 - 2r)]2
X [I
+
3 ( 1 - 2 ~ ) ~ ( 1 - v ) ~ ' ] 2, =
[ I - ( 1 - 2r)4(1 - r ) 4 7 > ( 6 )
where t is the number of generations of intermating
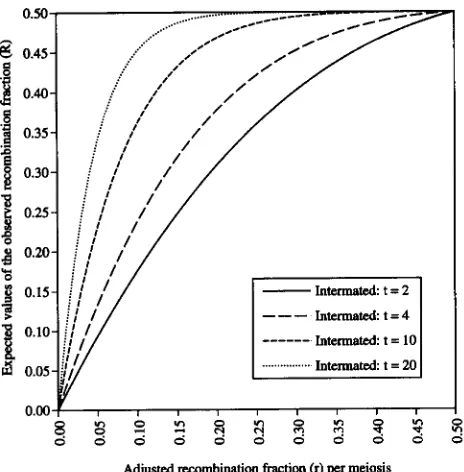
FIGURE 4.-Genetic linkage maps of F2, RI-selfed, and intermated populations of
Arabidopsis thaliuna WS X M13. Interval lengths are expressed as observed recombi- nation fraction ( R ) estimated without ad- justing for multiple meioses. Expected maps were constructed for RI-selfed and intermated populations by calculating the expected R for each interval from ( 1 ) and ( 3 ) , respectively, using observed R of the Fe population as the adjusted recombina- tion fraction ( r ) per meiosis.
following F2 (APPENDIX A ) . Thus,
i,
of a single lineage of our intermated population is( 1 - ~ ) ' [ 2 ( 1 - r )
+
4 ( 1 - 2 r ) l 'X [ l
+
3 ( 1 - 2r)'((l - T ) ' ]2, =
[ I - ( 1 - 2 r ) 4 ( 1 - r ) l G ~
9
( 7 )
Populations intermated for four generations yield threefold more information per individual than F2 and RI-selfed populations, for values of r approaching 0
(Figure 2 ) . The values of i, for intermated population remain the highest among the three populations when r
<
0.131, but decrease to the lowest when r>
0.196(Figure 2 ) .
The standard deviation (s) of the estimate of r can be derived for each population as
7
s =& ,
Chromosome 3
(1 1.8 %) ( 3.0 %) ( 3.5 %)
(22.7 %) M249
M560
M249
M339
(39.6 %)-
M249
(39.3 %)
-
Chromosome 4
Chromosome 5
AC85a M214
M210
M506 AC77
FIGURE 4.- Continued
M217
M247 M268
(1 9.3 %)
(1 5.5 %) (20.7 %)
(23.8 %)
M291 a
M247
M268 M43 5 M558 (30.2 %)
(1 1.2 %) (1 1 .o %)
(27.3 %)
-
(15.2 %)-(42.2 96)
-
(34.5 %)
-
(32.4 %)
-
(24.2 %)
-
M291a
M247
M268
M435
M558
ment, the precision of recombination estimates for Fz, and intermated populations correspond approximately to that of i, (Figure 3 )
,
and RI-selfed populations are somewhat less ( i . e . , higher value of s),
as we obtained linkage information for an average of 98, 93, and 59individuals (respectively) at each locus.
Genetic maps: For each population (F,, RI-selfed, intermated), the 50 DNA and three morphological
( an, d i d , er) markers fell into five linkage groups, corre- sponding to the five haploid chromosomes of A. thali- ana (Figure 4 ) . Although there were no overt conflicts in order of loci along the maps of the three populations, there were several cases in which closely linked markers could not be resolved in the F2 population (see below), and several cases in which large gaps between markers in the intermated population precluded orientation of the groups separated by the gaps. The concensus order shown (Figure 4 ) uses the order of closely linked mark- ers in the
RI
or intermated populations in cases that the F2 could not resolve, and relies upon F2 informationto span large gaps in the
RI
or intermated maps. The order of markers along the chromosomes was consis- tent with the published order of markers previously mapped ( CHANG et al. 1988; HAUGE et al. 1993; LISTERand DEAN 19 93) , except that markers M217and M562a
on chromosome 5 are inverted.
In several cases, the orders of closely linked markers could not be resolved with confidence in the F2 popula- tion, but could in the RI-selfed and/ or intermated popu- lations, validating the underlying rationale for our exper- iment. Specifically, alternate LODs for "ripple" (using MapMaker ; LANDER et al. 1987) of several groups of markers were not significantly different for the Fz, but were significantly different (LOD 2 2 ) for the RI-selfed
and
/
or intermated populations. These groups of mark- ers, with the respective LODs in parentheses, were -AC87- AC142- (F2: -0.48, RI-selfed: 0.23, intermated: 2.65)and "422-AC85b (F,: 0.79, RI-selfed: 8.89, intermated:
14.12) on chromosome 1, M246M497- (F2: 0.20, RI-
252 S.-C. Liu et al.
-AC155-AC37-AC135 ( FP: 0.13, RI-selfed: 2.44, in- termated: 1.91 ) on chromosome 4.
The linkage maps included intervals ranging from
R = 0.5% to 23.9% ( F 2 ) , 2.2% to 40.5% (RI-selfed),
and 1.2% to 42.2% (intermated)
.
Two intervals in theRI-selfed population, which showed R = 0 were ex- cluded from consideration, because adjacent markers segregated as “dominant” (present or absent), and the possibility of heterozygous recombinants could not be discerned.
Nine intervals in six chromosomal regions and 19 intervals in 12 chromosomal regions of the RI-selfed and intermated populations, respectively, showed sig- nificant difference between the observed R and the ex- pected R with P values <0.05 for the likelihood ratio tests. Five of these significant intervals in different chro- mosomal regions showed similar deviation from the ex- pected R in both RI-selfed and intermated populations
( see DISCUSSION )
.
Average heterozygosity across the genome for the F2 (50.6% ) and intermated (48.2%) populations agreed closely with the Mendelian expectation of 50%. How- ever, the average percentages of the WS allele in all three populations were higher than the expectation of 50% for the 47 RFLP loci showing codominant segrega- tion (F2: 52.7% WS allele, t = 3.89, P valueovrrtall -
0.0003; RI: 54.5% WS allele, t = 2.77, P value,,,,il = 0.0080; intermated: 55.1% WS allele, t = 5.51, P
value,,,.,,il
<
0.0001 ).
Twelve regions on five chromo- somes of the F2 population showed significant devia- tions from the Mendelian expectation of monogenic segregation ratios; eight regions on four chromosomes of the RI-selfed population showed significant segrega- tion deviations, and 16 regions on five chromosomes of the intermated population showed significant segre- gation deviations. We found no evidence of differences in order of DNA marker loci associated with regions of segregation distortion.-
DISCUSSION
Recurrent intermating is an experimental design that offers marked efficiencies for many genetic linkage map- ping applications, including comparative mapping, QTL mapping, and map-based gene cloning. Intermated populations are ideal for making “second-generation” genetic linkage maps, which simultaneously resolve local orders in many genomic regions densely populated with DNA markers. Previously, recombinant inbred popula- tions derived by self-pollination of plant lineages
(“RI-
selfed populations”) have been suggested to “permit higher mapping resolution for short linkage distances” than F2 populations (BURR et al. 1993; see also BURR et
al. 1988 and BURR and BURR 1991). RI-selfed popula- tions do afford approximate doubling of nominal re- combination fraction ( R ) , at values approaching 0. However, for accurately ordering closely linked markers, the information content of a single RI-selfed individual
is equal to that of a single F2 individual on& at a recombi- nation distance of 0, and becomes progressively less than that of a single F2 individual at larger distances. In con- trast, by intermating among different Fz-derived lineages for four generations, the resulting progeny yield three- fold more information per individual than F2 or
RI-
selfed progeny at values of r approaching 0, and remain more informative than F2 or IU-selfed individuals at all values of r
<
0.131 (Figure 2 ).
Once the “first-genera- tion” genetic map of an organism has reached a molecu- lar marker density such that there are few intervals of r>
0.131, an intermated population provides the means to resolve local marker orders on a genome-wide scale, by analysis of a minimal number of individuals.Mammalian
RI
populations, derived by sibmating, re- semble intermated populations in that new recombina- tional information is accumulated during the relatively slow loss of heterozygosity ( c j TAYLOR 1978; BAILEY1981 ) . RI-sibbed populations yield a maximum of four- fold expansion of R when rapproaches 0 ( HALDANE and WADDINCTON 1931; TAYLOR 1978) (Figure 1 ) :
4r
1
+
6rR = -
and
The
z,
of a single lineage of a RI-sibbed population can be derived from the standard deviation of r (GREEN, 1981 ) :4
a, =
r ( 1
+
2 r ) ( l+
6r)Z’ (10)which is smaller than that of the intermated population when r < 0.310 (Figure 2 ) . In contrast, plant
RI
popula- tions, to date all generated by recurrent self-pollination( i . e . , single seed descent: BRIM 1966), lose 50% of re- maining heterozygosity each generation, yielding a maximum of twofold expansion of R when rapproaches 0 (see RESULTS). RI-selfed individuals are thus com- prised of two identical gametes which have been through the equivalent of two cycles of recombination, while F2 individuals are comprised of two different ga- metes that have each been through only one cycle of recombination-providing equivalent information for resolving close linkages (Figure 2 ) . The loss of hetero- zygosity during selfing is so rapid that gains of informa- tion from new recombination are exactly canceled out.
0.50.
8
0.45.1
0.40,a
1
0.35 aI
0.30-8
k
0.25Q 0.20
3
0.15I
i
0.10a
0.050.00
htemated:t=4
Adjusted recombination fraction (r) per meiosis
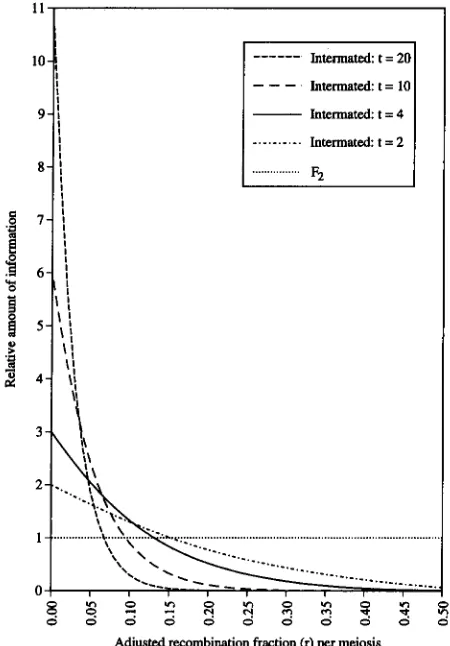
FIGURE 5.-Relationship between the adjusted recombina- tion fraction ( r ) per meiosis and the expected values of the observed recombination fraction ( R ) of intermated popula- tions undergo different numbers of generations ( t ) of in- termating. Values are derived from ( 2 ) .
recombinational information and can be subjected to many cycles of recombination to afford further accumu- lation of information (Figures
5 - 7 ) .
Many other combinations of intermating and in- breeding are possible. While map expansion is a disad- vantage in initial assembly of genetic maps, it affords maximal exploitation of high density maps by facilitat- ing resolution of close linkages.
Design and development of intermated mapping p o p ulations: A population subjected to recurrent intermat- ing has individuals comprised of two different gametes harboring unique recombination sites. Each generation of a recurrent intermating population retains heterozy- gosity at 50% (theoretically) and accumulates new re- combination sites at a constant rate through additional generations of intermating. Consequently, a pair of markers that are linked by a recombination fraction of r will yield progressively higher values of R after more generations of intermating, and will segregate indepen- dently after sufficient generations of intermating. The frequencies of genotypes for such a pair of markers, at the tth generation of intermating are as follows:
frequency (AABB) = frequency (aabb)
1
16
= - [ ( l - 2 r ) ( l - r ) t + 1]*,
frequency ( AAbb) = frequency ( aaBB)
1
16
= - [ ( l - 2 r ) ( l - r ) t - 1 ] 2 ,
160
_.
150
140 ;
100;
9
0
:
l o . . .
. 0 **e..
.*...
...
Adjusted recombination fraction per meiosis (r)
FIGURE 6.-Relationship between (adjusted recombina- tion fraction per meiosis) and tBo.4, the number of genera- tions of intermating expected to render R (observed recom- bination fraction)
>
40%, a value beyond which it is very difficult to detect linkage between markers. Values are de- rived from ( l l ) .frequency ( AABb) = frequency ( a a B b )
= frequency ( AaBB) = frequency (Aabb)
1
8
= -[1 - (1 - 2 r ) ' ( l - r)*",
and
frequency (AaBb) = frequency ( A B / a b )
+
frequency (Ab/&)1
8
= - [ ( 1 - 2 r ) ( l - r ) t + l ] *
1 8
+ - [ ( l - 2 r ) ( l - ? . ) I - 1]*,
which approach 1
/
16, 1/
16,2 /
16 and 4 / 16, respec- tively, when t increases. This can also be observed from( 2 ) with an increase of t (Figure 5 )
.
Clearly, the degree of map expansion increases with additional generations of random intermating. For a pair of markers linked at r recombination fraction (adjusted recombination fraction per meiosis), the number of generations( tR,0.4) of intermating needed before the value of R
S.-C. Liu et al.
= F 2
1
"""
I
n
e
t
e
t = 20
IntemM t = 10
Intemted: t = 4
Intematd t = 2
. . . . .. . .
Adjusted recombination fraction (r) per meiosis
FIGURE 7.-The precision of the estimation of r (adjusted recombination fraction per meiosis) of intermated popula- tions undergo different numbers of generations ( t ) of in- termating. Measurement is based on the amount of informa- tion relative to F2 population. Values for F2 and intermated populations are derived from ( 4 ) and ( 6 ) , respectively.
>
In(1 - 2R) - l n ( 1 - 2 r)l n ( 1 - r ) lR=O.4)' ( I 1 )
Figure
7
shows the relationship between tR>o.4 and r .Our intermated population had been through four gen- erations of intermating and is inadequate for detecting linkage between markers linked at r
>
0.22 (Figure 6 ) .Therefore, several intervals of our map with large R
( = r ) in F2, had become so large in the RI-selfed and intermated populations as to preclude detecting link- age. The F2 orders had to be used to ascertain orienta- tions of groups of markers flanking these gaps. How- ever, the r estimated from an intermated population is much more precise for closely linked markers than that from F2 or
RI
populations of the same size (Figure 2 ).
The better resolution of closely linked markers af- forded by intermated populations was evident in our data. In three-point comparisons ( MapMaker "ripple" command), the order between M422 and AC85b on chromosome
I
yielded a LOD of 0.79 greater than the best alternative order in the F2 population (not signifi- cant), but LODs of 8.89 and 14.12 greater than thebest alternative order in RI-selfed and intermated popu- lations, respectively (both highly significant). Likewise, the order between AC87 and AC142 on chromosome 1
yielded a LOD of 0.48 less than the best alternative order, but LODs of 0.23 and 2.65 (significant) greater than the best alternative order in RI-selfed and in- termated populations, respectively. In this case, use of the best order in F2 population would have incorrectly ordered the markers. In the other two cases of closely linked markers, M246M497- on chromosome 2 and
-AC155AC37-AC135 on chromosome 4, uncertain or- ders in F2 were also better resolved in RI-selfed and intermated populations; however, RI-selfed population showed higher LODs for the best order. Because both chromosomal regions involved markers with severe seg- regation distortion in the intermated population, it is likely that the expected better resolution from the in- termated population was affected by selection at these regions, through generations of intermating. This may also account for the significant difference observed in the likelihood ratio tests comparing the observed Rand the expected Rof the intermated population. The likeli- hood ratio tests were used to compare the observed R with the expected R derived from the R observed in the F2 population. Because the F2 population does not provide more precise estimation of the r for a small interval than an intermated population, the test results reflect the differences in the estimation of recombina- tion fraction among populations, rather than the preci- sion of the estimation of recombination fraction in the populations. The five significant intervals showing simi- lar deviation from the expected R in both RI-selfed and intermated populations are likely to result from inaccurate estimation of the recombination fraction in the F2 population. The problems involving selection causing recombinational variation in the intermated population can be minimized by increased population size as discussed below.
The greater recombination afforded by intermated populations was also reflected in the observed segrega- tion distortion in these populations. Specifically, the intermated population showed 16 distinct regions of segregation distortion, while the F2 population showed only 12. The greater number of distorted regions in the intermated population is expected, due to the greater recombination in this population; as factors closely linked in early generations become uncoupled, natural selection at a larger number of discrete points across the genome can be seen. However, if segregation distor- tion is due to natural selection, it must be noted that there would be greater opportunity for selection to act during the course of intermating, a factor that is com- pletely confounded with recombinational differences. The absence of a heterozygous class makes it difficult to interpret differences between
RI
and the other two populations, regarding segregation distortion.many individuals as possible, even if only a subset are used for genetic mapping. Heterozygosity is gradually lost in an intermated population of finite size, but the loss is slower in a large population (STRICKBERGER 1968). Furthermore, repeated intermating in a small population can magnify the effect of genetic drift, i.e.,
rare gametes that are recombinant between closely linked markers might be either “propagated” or lost. However, this limitation is easily overcome in crop plants by using large populations segregating for genetic male- sterility ( cJ SORRELLS and FRITZ 1982) or self-incompat- ibility ( cJ ST. MARTIN and EHOUNOU 1989) to enforce intermating. In an intermated population, population size ( N ) and the number of generations of intermating
( t ) determine the precision of the r estimate, which can be measured by the amount of information ( Ir) = Ni, [ ir is defined in ( 6 ) ]
.
Increase of Nimproves the preci- sion of the r estimate under all circumstances. However, increase of t only improves the precision of the r esti- mate when r is small, but greatly decreases the precision of the r estimate when r is large (Figure7 ) .
Therefore, decisions regarding population size, and number of gen- erations of intermating, should based on the required precision of the restimate, which can also be measured by the standard deviation ( s) ( 8 ).
An
intermated population fosters even more rapid accumulation of new recombination if the initial pedi- gree is complex ( HANSON 1959b). For example, one could intermate among many different F1 hybrids to create an F2 population carrying greater allelic diversity. This complicates genetic mapping because it would be necessary to find RFLP alleles unique to each ofthe geno-types contributing to the pedigree. However, such an
approach might be useful in highly polymorphic species such as maize, or using highly variable DNA markers
( cJ TAUTZ 1989; WEISSENBACH et al. 1992).
Development of homozygous high-resolution map- ping populations: As a high-resolution alternative to RI-selfed populations, intermating for four genera- tions followed by self-pollination (single seed descent) for six to eight generations, would produce a homozy- gous “intermated recombinant inbred population” (IRI)
.
The IRI will embody both the high resolution of the intermated population and the permanence of the RI population (BURR et al. 1988, 1991, 1993; RE- ITER et al. 1992; WANG et al. 1993). We are now selfingour intermated population, and the resulting IRI pop- ulation will be deposited in the Arabidopsis Biological Resources Center ( a t Ohio State University). More- over, we are developing an IRI population of sorghum
( S . bicolor L.: A. H. PATERSON and K. F. SCHERTZ, un-
published results), and our colleagues are doing like- wise in maize ( Z e a mays L.: W. BEAVIS, personal commu- nication )
.
During the process of selfing to homozygosity, bulk populations of seed derived from one selfing of individ- ual intermated plants can be used as an interim re- source (such as we used herein)
.
Applications of intermated populations: Intermated populations are potentially useful for investigating a wide range of questions that require genome-wide high resolution mapping. The facility of plant genetics is likely to make intermated populations a particularly useful tool in studying the genomes of major crops.
Intermated populations can expedite the integration of genetic and physical maps. From theoretical expecta- tions ( HANSON 1959a,b)
,
a population of 99 individualsderived by intermating for four generations should har- bor about three recombination sites per chromosome in each of their two informative gametes; for a total of
ca. 600 recombination sites along an average chromo- some. Across the five chromosomes of A. thaliana, this represents ca. 3000 recombination sites. Because each individual was used as a parent twice in each generation to derive the intermated population, some recombina- tion sites may be identical by descent-by iterating the binomial probability of gain/loss of recombinant ga- metes over four generations of intermating, we estimate that 2176 of the 3000 recombination sites are unique. Based on an Arabidopsis genome size of 145 Mb (ARU- MUNGANATHAN and EARLE 1991 ) , novel recombination events occur at average spacing of 67 kb. Thus, most Arabidopsis YACs ( c a . 150 kb; GRILL and SOMERVILLE,
1991; WARD and JEN 1990; more recent libraries have larger inserts) might be oriented along the genetic map simply by mapping of their respective ends on the in- termated population. This may help in orienting new YACs along the chromosomes, and closing gaps be- tween existing contigs ( HWANG et al. 1991; SCHMIDT et al. 1992; PUTTEFSULL et al. 1993).
The improved genetic map resolution afforded by intermating has an even greater potential impact on analysis of crop genomes, in which the physical size of a centiMorgan is much larger than in Arabidopsis, e.g., the genomes of A . thaliana, Gossypium hirsutum, Sorghum bicolor, Brassica ohacea, Lycopersicon esculentum, Z. mays
and Solanum tuberosum have 290, 400, 500, 540, 750,
1400, and 2500 kb/cM, respectively ( CHANG et al. 1988; GEBHARDT et al. 1989; ARUMUNGANATHAN and EARLE
1991; LANDRY et al. 1992; TANKSLEY et al. 1992; COE and NEUFFER 1993; CHITTENDEN et al. 1994; REINISCH et al.
1994). In particular, “fine mapping” of quantitative trait loci (QTL) depends upon the level of resolution of pre-existing genetic maps ( PATERSON et al. 1990), which can be improved substantially using intermated populations. In principle, QTL mapping directly in in- termated populations permits one to improve the reso- lution of QTLs at the first stage of mapping-however, the time needed to develop intermated populations may constrain the usefulness of this particular applica- tion.
Comparative mapping of chromosome organization in disparate taxa ( BONIERBALE et al. 1988; HULBERT et al. 1990; TANKSLEY et al. 1992; WHITKUS et al. 1992; A H N
and TANKSLEY 1993; A H N et al. 1993; O’BRIEN et al. 1993;
256 S.-C. Liu et al.
NISCH et al. 1994), can be facilitated by use of in-
termated populations, which better resolve gene order in small chromosomal regions remaining homosequen- tial in distantly related species. Improved map resolu- tion will become increasingly important as comparative mapping efforts reach across greater taxonomic dis- tances, and seek conservation across smaller chromo- some segments.
Finally, intermated populations may help to resolve classical questions in population biology. For example, alternative explanations of heterosis (hybrid vigor) pro- pose close linkage between dominant and recessive al- leles at different loci (“dominance” theory: cf: BRUCE
1910), us. true “heterozygote advantage” at a single locus (“overdominance” theory: cf: EAST 1908; SHULL
191 1 )
.
Similarly, the persistence of phenotypic varia- tion in populations subjected to intense directional se- lection ( cf: ALEXANDER 1988) has been postulated to be a result of new mutations, or “release” of cryptic variation in the form of closely linked “ f ” and “-”alleles ( cf: LANDE 1975). Such questions can be ad- dressed in unprecedented detail, by combining high- density genetic maps of DNA markers with recurrently intermated mapping populations.
The first three authors contributed equally to this work. We thank E. MEYEROWITZ and the Arabidopsis Biological Resources Center ( a t Ohio State University) for DNA clones, K. MANLY for valuable com- ments, Clontech Inc for an Arabidopsis cDNA library, N. FORSTHOEFEI. and L. CHITrENDEN for technical assistance and K. SCHERTL, B. Mc- DONALD, R. WING, G. WANG, V. USTOGI and several anonymous review- ers for valuable comments. Novel DNA probes will be deposited at the Arabidopsis Biological Resources Center. This research was funded by the Texas and Delaware Agricultural Experiment Stations (A.H.P.) ,
and National Science Foundation grant DMB-9108442 (K.A.F.) .
LITERATURE CITED
AHN, S., and S. D. TANKSLEY, 1993 Comparative linkage maps of
rice and maize genomes. Proc. Natl. Acad. Sci. 90: 7980-7984.
A H N , S., J. A. ANDERSON, M. E. SORREI.I.S and S. D. TANKSLEY, 1993 Homoeologous relationships of rice, wheat, and maize chromo- somes. Mol. Gen. Genet. 241: 483-490.
ALEXANDER, D. E., 1988 Breeding special nutritional and industrial types, pp. 869-880 in Corn and Corn Improvement, Ed. 3, No. 18, edited by G. F. SPRAGUE and J. W. DUDLEY. American Society of Agronomy, Inc., Madison.
ARUMUGANATHAN, K., and E. D. EARLE, 1991 Nuclear DNA con- tent of some important plant species. Plant Mol. Biol. Rptr. 9:
BAILEY, D. W., 1981 Recombinant inbred strains and bilineal con- genic strains, pp. 223-239 in The Mouse in Biomedical Research,
Vol. 1, edited by H. L. FOSTER,J. D. SMALI. and J. G. FOX. Aca- demic Press, New York.
BONIERBALE, M. D., R. L. PIAISTED and S. D. TANKSLEY, 1988 RFLP maps based on a common set of clones reveal modes of chromo- somal evolution in potato and tomato. Genetics 120: 1095-1103. BRIM, C. A,, 1966 A modified pedigree method of selection in soy-
beans. Crop Sci. 6: 220.
BRUCE, A. B., 1910 The Mendelian theory of heredity and the aug- mentation of vigor. Science 32: 627-628.
BURR, B., and F. A. BURR, 1991 Recombinant inbreds for molecular mapping in maize: theoretical and practical considerations. Trends Genet. 7: 55-60.
BURR, B., F. A. BURR, K. H. THOMPSON, M. C. ALBERTSON and C. W.
STUBER, 1988 Gene mapping with recombinant inbreds in
maize. Genetics 118: 519-526.
BURR, B., F. A. BURR and E. C. MATZ, 1993 Mapping genes with 208-218.
recombinant inbreds, pp. 249-254 in The Maize Handbook, edited by M. FREELING and V. WALBOT. Springer-Verlag, New York. CHANG, C., J. L. BOWMAN, A. W. DEJOHN, E. S. LANDER and E. M.
MEYEROWITZ, 1988 Restriction fragment length polymorphism
85: 6856-6860.
linkage map for Arabidopsis thaliana. Proc. Nat. Acad. Sci. USA CHITTENDEN, L. M., K. F. SCHERTZ, Y. R. LIN, R. A. WING and A. H. PATERSON, 1994 A detailed RFLP map of sorghum bicolor X S.
propinquum suitable for highdensity mapping suggests ancestral duplication of chromosomes and chromosomal segments. Theor. Appl. Genet. 87: 925-933.
CHURCHII.I., G. A,, J. J. GIOVANNONI and S. D. TANKSLEY, 1993 Pooled-sampling makes high-resolution mapping practical with DNA markers. Proc. Nat. Acad. Sci. USA 90: 16-20.
COE, E. H., and M. G. NEUFFER, 1993 Gene loci and linkage map
of corn (maize) (&a mays L.) ( 2 N = 2 0 ) , pp, 6.157-6.189 in
Genetic Maps: Locus Maps of Complex Genomes, Ed. 6, edited by S. J. O’BRIEN. Cold Spring Harbor Laboratory Press, Cold Spring Harbor, NY.
COHEN, D., I. CHUMAKOV and J. WEISSENBACH, 1993 A first-genera- tion physical map of the human genome. Nature 366: 698-701. COLLINS, F. S., 1992 Positional cloning: Let’s not call it reverse
anymore. Nat. Genet. 1: 3-6.
COULSON, A,, R. WATERSTON, J. KIFF, J. SUISTON and Y. KOHARA, 1988 Genome linking with yeast artificial chromosomes. Nature 335:
EAST, E. M., 1908 Inbreeding in corn. Rep. Ct. Agri. Exp. Sta. 1907:
FATMI, A,, D. B. WAGNER and T. W. PFEIFFER, 1992 Intermating schemes used to synthesize a population are equal in genetic consequences. Crop Sci. 32: 89-94.
FRKDICRICKSEN, L. J., and W. E. KRONSTAD, 1985 A comparison of intermating and selfing following selection for heading date in two diverse winter wheat crosses. Crop Sci. 25: 555-560. GEBHARDT, C., E. RITTER, T. DEBENER, U. SCHACHTSCHABEI., B. WAIK
MEIER et al., 1989 RFLP analysis and linkage mapping in Sola- num tuberosum. Theor. Appl. Genet. 78: 65-75.
GREEN, E., L., 1981 Genetics and probability in animal breeding experiments. Oxford University Press, New York.
GRILL, E. and C. SOMERVILLE, 1991 Construction and characterization of a yeast artificial chromosome library of Arabidopsis which is suit- able for chromosome walking. Mol. Gen. Genet. 226: 484-490. HALDANE, J. B. S., and C. H. WADDINGTON, 1931 Inbreeding and
linkage. Genetics 16: 357-360.
HANSON, W. D., 1959a Theoretical distribution of the initial linkage block lengths intact in the gametes of a population intermated for n generations. Genetics 44: 839-846.
HANSON, W. D., 1959b The breakup of initial linkage blocks under selected mating systems. Genetics 44: 857-868.
HAUGE, B. M., S. M. HANI.EY, S. CARTINHOUR, J. M. CHERRY, H. M.
GOODMAN et al., 1993 An integrated genetic/RFLP map of the
Arabidopsis thaliana genome. Plant J. 3: 745-754.
HUBERT, S. H., T. E. RICHTER, J. D. AXTELL and J. L. BENNETZEN, 1990 Genetic mapping and characterization of sorghum and related crops by means of maize DNA probes. Proc. Natl. Acad. Sci. USA 87: 4251-4255.
HWANG, I., T. KOHCHI, B. M. HAUGE, H. M. GOODMAN, R. SCHMIDT
t t al., 1991 Identification and map position ofYAC clones com- prising one-third of the Arabidopsis genome. Plant J. 1: 367-374. KOWALSKI, S. P., T. H. LAN, K. A. FELDMANN and A. H. PATERSON, 1994
QTL mapping of naturally-occurring variation in flowering time of Arabidopsis thaliana. Mol. Gen. Genet. 245: 548-555.
KRANZ, A. R., and B. KIRCHHEIM, 1987 Genetic resources, pp. 3.2.52-3.2.107 in Arabidopsis. Arabidqsis Information Service, J.
W. Goethe-University Frankfurt, Germany.
KWOLEK, T. F., R. E. ATKINS and 0. S. SMITH, 1986 Comparisons of
agronomic characteristics in CO and C4 of IAP3BR ( M ) random- mating grain sorghum population. Crop Sci. 26: 1127-1131.
LANDE, R., 1975 The maintenance of genetic variability by muta- tion in a quantitative character with linked loci. Genet. Res. 26:
221-235.
LANDER, E. S., P. GREEN, J. A B R A H A M S O N , A. BARLOW, M. J. DALY et
al., 1987 MAPMAKER an interactive computer package for constructing primary genetic linkage maps of experimental and natural populations. Genomics 1: 174-181.
LANDRY, B. S., N. HUBERT, R. CRETE, M. S. CHIANG, S. E. LINCOLN et al., 1YY2 A genetic map for Brassica ohacea based on RFLP 184-186.
markers detected with expressed DNA sequences and mapping
of resistance genes to race 2 of Plasmodiophora brassicae (Woro- n i n )
.
Genome 3 5 409-420.LANGLEY, C. H., E. MONTGOMERY and W. F. QUATTLEBAUM, 1982
Restriction map variation in the Adh region of Drosophila. Proc. Nat. Acad. Sci. USA 79: 5631-5635.
LEIGH BROWN, A. J., 1983 Variation at the 87A heat shock locus in
Drosophila melanogaster. Proc. Nat. Acad. Sci. USA 80: 5350-5354.
LISTER, C. and C. DEAN. 1993 Recombinant inbred lines for m a g ping RFLP and phenotypic markers in Arabidopsis thaliana. Plant J. 4: 745-750.
MACPHERSON, J. N., B. S. WEIR and A. J. LEIGH BROWN, 1990 Exten- sive linkage disequilibrium in the achaete-scute complex of Dre
sophila melanogaster. Genetics 126: 121-129.
MATHER, R, 1936 Types of linkage data and their value. Ann. Eu- genics 7: 251-264.
MILLER, P. A,, and J. 0. RAWLINGS, 1967 Breakup of initial linkage blocks through intermating in a cotton breeding population. Crop Sci. 7: 199-204.
O'BRIEN, S. J., J. E. WOMACK, L. A. LYONS, K. J. MOORE, N. A. JENKINS
et al., 1993 Anchored reference loci for comparative genome mapping in mammals. Nat. Genet. 3 103-112.
ORKIN, S.H., 1986 Reverse genetics in human disease. Cell 47:
PATERSON, A. H., J. W. DEVERNA, B. LANINI and S. D. TANKSLEY, 1990
Fine mapping of quantitative trait loci using selected overlapping recombinant chromosomes, in an interspecies cross of tomato. Genetics 1 2 4 735-742.
PATERSON, A. H., M. E. S o m u s , S. D. TANKSLEY. 1991 DNA mark- ers in crop improvement. Adv. Agron. 46: 39-90.
PUTIERRII.l., J., F. ROBSON, K. LEE and G. COUPLAND, 1993 Chromo- some walking with YAC clones in Arabidopsis: isolation of 1700 kb of contiguous DNA on chromosome 5, including a 300 kb region containing the flowering-time gene CO. Mol. Gen. Genet.
REINISCH, A. J., J. DONG, C. L. BRUBAKER, D. M. STELLY, J. F. WENDEL
et al., 1994 A detailed map of cotton, Gossypium hirsuturn X G.
barbadense: Chromosome organization and evolution in a disomic polyploid genome. Genetics 1 3 8 829-847.
REITER, R. S., J. G. K. WILLIAMS, R A. FELDMANN, J. A. RAFALSKI,
S. V. TINGEY et al., 1992 Global and local genome mapping in
Arabidopsis thaliana by using recombinant inbred lines and ran- dom amplified polymorphic DNAs. Proc. Natl. Acad. Sci. USA
89: 1477-1481.
SCHMIDT, R., G. CNOPS, I. BANCROFT and C. D m , 1992 Construc- tion of an overlapping YAC library of the Arabidopsis thaliana
genome. Aust. J. Plant Physiol. 19: 341-351.
SHULL, G. H., 1911 The genotypes of maize. Amer. Nat. 45: 234- 252.
SORRELLS, M. E., and S. E. FRITZ, 1982 Application of a dominant male-sterile allele to the improvement of self-pollinated crops. Crop Sci. 2 2 1033-1035.
ST. MARTIN, S. R , and N. E. EHOUNOU, 1989 Randomness of in- termating in soybean populations containing male-sterile plants. Crop Sci. 29: 69-71.
845-850.
239: 145-157.
STRICKBERGER, M. W., 1968 Genetics. Macmillan, New York. TANKSIEY, S. D., M. W. GANAL, J. P. PRINCE, M. C . DEVICENTE, M. W.
BONIERBALE et al., 1992 High density molecular linkage maps of the tomato and potato genomes. Genetics 132: 1141-1160.
TAUTZ, D., 1989 Hypervariability of simple sequences as a general source for polymorphic DNA markers. Nucleic Acids Res. 17:
6463-6471.
TAYLOR, B., 1978 Recombinant inbred strains: use in gene mapping, pp. 423-438 in origzm ofrnbred Mice, edited by H. MORSE. Aca- demic Press, New York.
T ~ A G I , A. P., 1987 Correlation studies o n yield and fiber traits in upland cotton ( Gossypium hirsutum L.) . Theor. Appl. Genet. 74:
WANG, G. L., D. J. MACKILL, J. M. BONMAN, S. R. MCCOUCH and R. J.
NELSON, 1993 RFLP mapping of genes conferring complete and partial resistance in a rice cultivar with durable resistance
to blast, pp. 209-215 in Durability of Disease Resistance, edited by T. JACOBS and J. E. PARLEVLIET. Kluwer Academic Publishers, Netherlands.
WARD, E., and G. C . JEN, 1990 Isolation of single-copy-sequence clones from a yeast artificial chromosome library of randomly- sheared Arabidopsis thaliana DNA. Plant Mol. Bid. 1 4 561-568. 280-283.
WEISSENBACH, J., G. GYAPAY, C. DIB, A. VIGNAL, J. MORISSETTE et al.,
1992 A second-generation linkage map of the human genome. Nature 359: 794-801.
WEI.IS, W. C., and K. D. KOFOID, 1986 Selection indices to improve an intermating population of spring wheat. Crop Sci. 26: 1104-
1109.
WHITKUS, R., J. DOEBLEY and M. LEE, 1992 Comparative genome mapping of sorghum and maize. Genetics 132: 1119-1130.
WILKS, S., S., 1938 The large sample distribution of the likelihood ratio for testing composite hypotheses. Ann. Math. Stat. 9 60-62.
WRIGHT, S., 1969 The Theoly of &ne Frequencies, Vol. 2. University of
Chicago Press, Chicago.
Communicating editor: B. S. WEIR
APPENDIX A
If g classes of genotype are expected in the frequen- cies m l , q ,
. . . ,
mg being given in terms of r, the recombination fraction, the mean amount of informa- tion ( i,) is given by the formula( MATHER 1936). In the intermated population, nine
genotype classes can be distinguished by RFLP markers showing codominant segregation, with the AaBb class including the two double heterozygous genotypes AB/
ab and Ab/aB. The frequencies of AABB, aabb, AAbb,
aaBB, AABb, aaBa, AaBB, Aabb, and AaBb are m l ,
m,,
mfi,
m4, %,e
rn,, Q, and my, respectively, whereand
my = frequency (A B/ab )
+
frequency ( Ab/aB) 18
= - [ ( I - 2 r ) ( 1
+
r ) ' + 11'The dm,/ dr term for each genotype class can be derived
as
" dml d m , 1
dr dr 8
- - = - [ ( 1 - 2 r ) ( l - r ) ' + 11
( 1 - 2 r ) ( l - r ) * t 1 - r - 2 ( 1 - r ) ' -
" d m , dm, 1
258 S.-C. Liu et al.
and
The l / m j / ( dm,/dr) term for each genotype class can be derived as
and
2
-
-
1
+
( 1 - 2r)'(1 - r)"The mean amount of information ( ir) is the sum of the term from each genotype class.
,=
1Let a = ( 1 - 2r) and b = ( 1 - r )
'.
Equation (A1 )gives
i,= ( - 2 b - - 1 - r
( 2
+
SrJ2
( 2+
-+)'
+
2a2b41 - a2b4
+
a2b4
1
+
a2b2( 1 - a'b') (1
+
a2b2) b'(
2+ -
1 y r ) '
( 1 - a'b2) ( 1
+
a"')( 1
+
a2b2) ( 2a2b4)(
2+
-1:ry
+
(1 - a'b') ( 1
+
a2b2)( 1
+
a'b') ( a2b4)(
2+
-1 r r ) '
+
( 1 - a'b') ( 1
+
a'b')X (6' - a4b6
+
%'b4+
2a4b6+
a'b4 - a4b6) ( 1 - a4b4)2 ( 1
- r )+
at[
1 - r( b2
+
3a2b4)( 1 - a4b4)
- ( 1 - r ) -*[
2
( 1 - r )+
at] 'b2 (1+
3a'b')-
(1 - a4b4)
.
( A 2 )Because a = ( 1 - 2r) and b = 1 - r ) t, equation
( m )
gives( 1 - r)-'[2(1 - r )
+
t ( 1 - Zr)]'(1 - r)"X [l
+
3 ( 1 - 2r)'(1 - r ) " ]2, =
- ( 1
-
2 4 4 ( 1 - r ) 4 7( 1 - ~ ) ' ~ - ' [ 2 ( 1 - r )
+
t ( 1 - 2r)12 -- X [l