(An ISO 3297: 2007 Certified Organization)
Vol. 3, Issue 4, April 2014
Copyright to IJIRSET www.ijirset.com 10890
Development of Microcontroller Based
Analyzer for the Detection of Chlorine in
Water
Pravin K. Bhadane
Head, Department of Electronics, Nowrosjee Wadia College, Pune, India
Abstract: It is necessary to detect the chemical species present in the contaminated water before its use for the domestic purpose. The aim of this research work was to design, built and test analyzer for the detection of chlorine level in drinking water using photoelectric technique. To implement this technique, light emitting and photo diodes were used as source and detector of light respectively. The detected signal was further conditioned and processed by the trans-impedance amplifier and MSP430F2013 microcontroller respectively. The software has been developed for the functions; adjustment of 100% transmittance for reference, measurement of transmitted light intensity and its conversion into absorbance, detection of maximum response wavelength, calculation of calibration constant from the standard solutions, and finally estimation of unknown concentration. The developed analyzer has successfully tested for the detection of chlorine level in the water. The analyzer is battery operated, hand held and easy to operate.
Keywords: chlorine, LED, photodiode, microcontroller.
I. INTRODUCTION
Disinfected and uncontaminated drinking water is the requirement for healthiness of human and aquatic life [1]. The existence of bacteria and viruses is a main cause for the spread of water-borne infective deceases. Similarly, presence of some organic and inorganic compounds is a major worry due to their toxicity to animal life [2, 3]. The World Health Organization (WHO) has predicted that more than millions of animals die every year due to the diseases caused by contamination of drinking water [4]. The main problems with drinking water are related to faeces and chemical contamination from man-made sources [1]. There is a need of proper treatment of water before its distribution to community.
The disinfection of water is necessary to control the spread of water-borne diseases. Chlorine is one of the principle disinfecting agent employed in various water distribution systems [5]. It has many advantages as a disinfectant, including its efficiency and on site measurement. Another advantage is that chlorine leaves a disinfectant residual that helps in preventing recontamination during storage. The dose rate of chlorine depends on the quality of water. The over dose of chlorine can cause the additional effects. The lack of a chlorine residual in the water may indicate the possibility of post treatment. It is required to measure the chlorine level for the optimization of dose rate. An automatic, handheld and battery operated analyzers are more suitable to measure the chlorine level at multiple places of centralized water distribution system.
Microcontrollers (µC) are used in the automation for the measurement and control sections of analytical instruments [6]. It is a small capacity single chip computational system used for the dedicated applications. The benefits of µC based systems are numerous; low cost, portable, continuous monitoring, less manual operations, etc. A variety of cross- compilers are available for a particular microcontroller, allowing the user to write programs in a universal high level language, such as C and JAVA instead of its native tedious assembly language.
(An ISO 3297: 2007 Certified Organization)
Vol. 3, Issue 4, April 2014
Copyright to IJIRSET www.ijirset.com 10891 Slope, m = =εd
Concentration
(X1,Y1)
(X2,Y2)
A
organized as follows: The method of photoelectric analysis is discussed in section II and system design of electronic circuit is discussed in section III. The system software development is discussed in section IV. The results are discussed in section V. Finally, the conclusions and future scope are discussed in section VI.
II. METHODS
When a blank solution, which does not absorb light, is in the sample holder, the following equation relates the light transmitted to the intensities of the light [7].
T= I = 1, and I0=I………. (1)
Where T is transmittance; I0 and I are incident and transmitted intensities respectively.
When a solution contains a colored species, then it absorbs light IA, i.e., less light is transmitted. Thus, equation 1
becomes,
I0 = I + IA, I = I0 - IA, I < I0 and T < 1
The chemical compounds have a characteristic wavelength of light they absorb. Therefore, the color transmitted depends on the color absorbed. The less light transmitted by a solution, the more concentrated is the solution.
The Beer-Lambert’s Law [8, 9] quantitatively expresses the relationship between the amount of light absorbed and the concentration of the solution. This law uses the following relationship:
A =εcd………. (2)
Where: A = Absorbance, ε is Molar extinction coefficient; units - L mole-1cm-1, c is concentration; units - mole L-1, d = optical path length; unit – cm, ε is constant for a given species in a given solvent at a specific wavelength.
Practical application of the Beer-Lambert’s Law comes in determining the unknown concentration of light-absorbing solutions. The equation 1 can be simplified as:
c = ………. (3)
The path length, d, is constant. Since the value of ε depends on number of parameters, the unknown concentration of a
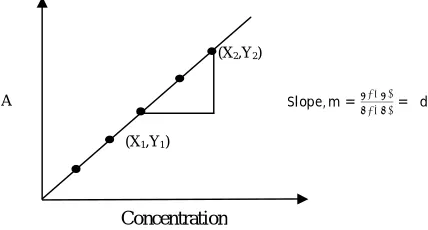
species in solution is obtained by comparing the absorbance of the unknown with the absorbance values of species of known concentrations at the characteristics wavelength, λmax. In practice, a calibration curve of absorbance at λmax
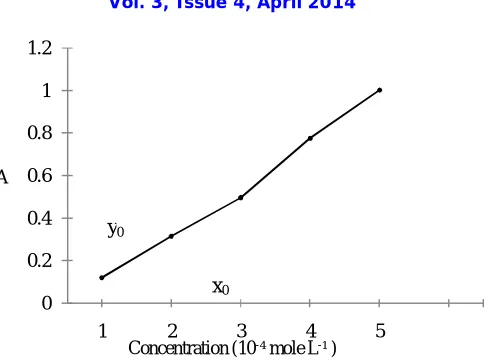
versus the known concentrations of standard solutions is plotted as shown in Figure 1. The equation of curve can be obtained by rewriting eq. 2,
A = (εd) × c + 0.. (4)
Y = mx + b…….. (5)
Comparison of eq. 4 and 5 proves that the curve shown in Figure 1 is linear and passes through the origin. It indicates that, using calibration curve, the unknown concentration of a solution can be determined. In addition, the calibration curve can be used to determine an extinction coefficient by taking ratio of the slope and d.
(An ISO 3297: 2007 Certified Organization)
Vol. 3, Issue 4, April 2014
Copyright to IJIRSET www.ijirset.com 10892
III. SYSTEM DESIGN
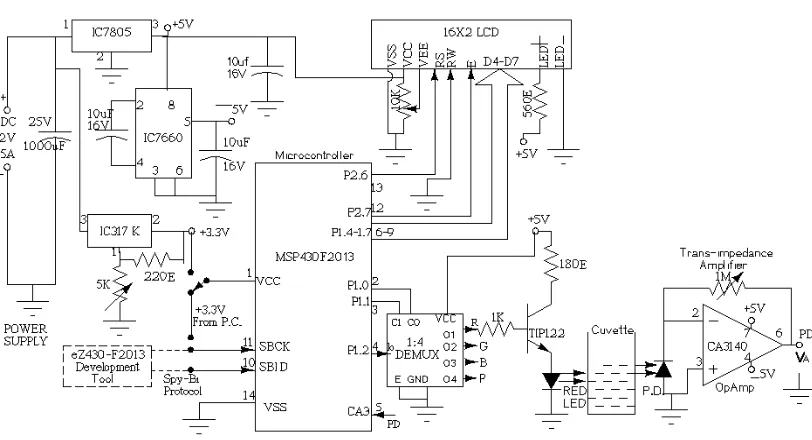
The system is divided into six main parts: power supply, programmable barrier potential, cuvette, signal conditioning, signal convertor and processing unit. The block diagram and the complete circuit diagram of the designed system are shown in Figure 2 and 3 respectively.
Figure 2: Block diagram of microcontroller based photoelectric analyzer.
Figure 3: Circuit diagram of microcontroller based photoelectric analyzer.
A. Power supply unit
A 12V /5 Amp dc SMPS type adaptor is used as electric power supply. Alternatively a battery pack, consisting of six 1.5V dry cells, provides an unregulated voltage of 9 volts to power the circuit. Most of the components in the circuit are designed to operate at a 5 V supply, and an IC 7805- 5 V voltage regulator is used to convert the battery voltage to a stable 5 V supply. The capacitor is connected across the output to eliminate the high frequency noise. An adjustable
LM317- 3.3 V regulator is used to provide a supply voltage for the microcontroller. An IC 7660 is used to convert the +5V to -5V supply.
B. Programmable barrier potential unit
(An ISO 3297: 2007 Certified Organization)
Vol. 3, Issue 4, April 2014
Copyright to IJIRSET www.ijirset.com 10893
which is controlled by the software program. It adjusts the transmittance for blank solution at maximum. Transistor TIP122 is used in emitter follower configuration and it works as constant current source for the LED.
C. Cuvette
It is made of glass and quartz for visible and UV light respectively. The glass should be as thin as possible, so that attenuation of light is minimum. LED is fitted at one side of cuvette and its light is made to shine through the sample placed in cuvette. The transmitted light passed through the sample, struck the opposite side of the cuvette where photodiode is mounted [10].
D. Signal conditioning unit
The incident light with intensity I0 is passed through the sample. Some part of it absorbed by the sample and remaining
with intensity of I is transmitted. As the transmitted light strucks the photodiode, photocurrent Ipd is generated. The
photocurrent is converted into voltage by trans-impedance amplifier. It is a high gain amplifier with very low input bias current. The FET input operational amplifier, CA 3140 is selected to construct the amplifier. The output voltage of amplifier is given by [10],
V =−I × R.
Where Ipdis the photo current in μA, Rf is the feedback resistor.
E. Signal convertor and processing unit
Microcontroller MSP430F2013 is used as signal convertor and processor. It is powerful and easy to program RISC controller. Its main features are low power consumption and on chip 16 bit ADC. The on-chip ADC converts the analog signal VA into digital signal. Microcontroller manipulates the digital signal into absorbance and concentration. F. Signal display unit
It is an alphanumeric 16 x 2 LCD used in the 4 bit mode. The microcontroller has the function of analyzing data and displaying it on the LCD.
IV. SYSTEM SOFTWARE
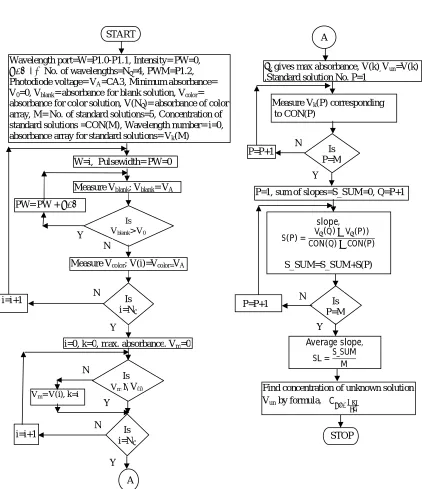
The software has been developed in the C language using the IAR Integrated Development Environment [11]. The compiled code (HEX file) has loaded into Flash memory of microcontroller MSP430F2013 by the burner eZ430F2013 [12]. The flow chart is depicted in Figure 4, which shows the sequence of steps involved in the software development. When the system is activated, it will invoke the microcontroller to reset all hardware devices in a normal mode. The preloaded program is then executed and performs following functions.
1. Adjustment of 100 % transmittance for the blank solution. 2. Conversion of transmittance into absorbance.
3. Detection of maximum response wavelength and corresponding absorbance for unknown species in solution. 4. Calculation of calibration constant from the standard solutions.
(An ISO 3297: 2007 Certified Organization)
Vol. 3, Issue 4, April 2014
Copyright to IJIRSET www.ijirset.com 10894
Fig. 4: Flow chart for the photoelectric analyzer
Wavelength port=W=P1.0-P1.1, Intensity= PW=0,
∆PW=1, No. of wavelengths=Nλ=4, PWM=P1.2,
Photodiode voltage= VA=CA3, Minimum absorbance=
V0=0, Vblank= absorbance for blank solution, Vcolor=
absorbance for color solution, V(Nλ)= absorbance of color
array, M= No. of standard solutions=5, Concentration of standard solutions =CON(M), Wavelength number= i=0, absorbance array for standard solutions= Vk(M)
W=i, Pulsewidth= PW=0 Measure Vblank; Vblank= VA
Is Vblank> V0
?
Measure Vco lor; V(i)=Vcolor=VA
Is i=Nλ
START
i=0, k=0, max. absorbance. Vm=0
Is
Vm ≥ V(i)
PW= PW + ∆PW
Y N
N
N
Y
Vm= V(i), k=i
A i=i+1 Y Is i=Nλ Y i=i+1 N
A
λk gives max absorbance, V(k), Vun=V(k)
,Standard solution No. P=1 Measure Vk(P) corresponding
to CON(P)
P=P+1 Is P=M
P=1, sum of slopes=S_SUM=0, Q=P+1
slope,
S(P) = V (Q)−V (P)) CON(Q)−CON(P)
S_SUM=S_SUM+S(P) Y
N
Is P=M P=P+1 N
Y
Find concentration of unknown solution Vun by formula, C
STOP
Average slope,
(An ISO 3297: 2007 Certified Organization)
Vol. 3, Issue 4, April 2014
Copyright to IJIRSET www.ijirset.com 10895
V. RESULTS AND DISCUSSION
When the system restarts then it resets all the internal registers and external peripheral devices. Then the preloaded program starts the measurement procedure. Initially it adjusts the transmitted intensity for blank solution at 1. After that it finds the λmax for the unknown solution. The values of λ and corresponding absorbance are given in Table I.
Table I: λ Vs absorbance of unknown solution at different wavelengths
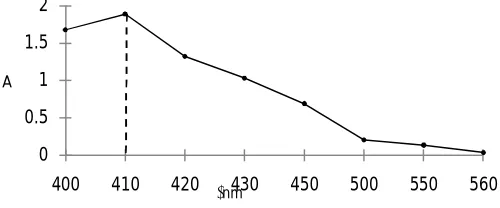
The plot of λ versus absorbance is shown in Figure 5.
Fig 5: Graph of λ versus absorbance (A)
It is revealed from Figure 5, that the maximum response is at 410 nm, which is the wavelength of pink colored light. The amount of chlorine present in the water is determined in terms of iodine [9]. The absorbance of various concentrations of iodine and unknown amount of chlorine in water are shown in Table II. Five different concentrations of I2 solutions were prepared. Using highest concentration solution of I2, λmax was determined and it was found to be
410 nm. At this λmax, absorbance of different known concentration solutions of I2 as well as unknown concentration
solution of Cl2 were measured and depicted in Table II. The graph of concentration verses absorbance is shown in
Figure 6.
Table II. Absorbance for the known concentrations of I2 and unknown Cl2 0
0.5 1 1.5 2
400 410 420 430 450 500 550 560
A
λ/nm
λ/nm Absorbance(A) 400 1.678
410 1.889 420 1.322 430 1.032 450 0.69 500 0.206 550 0.135 560 0.036
ml of 0.005M I2 solution
Volume in ml
Conc. of I2
10-4M
Absorbance at
λmax = 410nM
(An ISO 3297: 2007 Certified Organization)
Vol. 3, Issue 4, April 2014
Copyright to IJIRSET www.ijirset.com 10896
Figure 6: Calibration curve of Conc. Vs Absorbance (A) for finding the concentration of unknown solution.
For a given unknown solution the measured absorbance is 0.337. The concentration of unknown chlorine solution is determined from the calibration curve as shown in Figure 6. The estimated value of unknown concentration from the curve is found to be 2.1 x 10⁻⁴ mole L-1.
VI. CONCLUSIONS
The present work describes photoelectric color analyzer which uses a pair of LED and photodiode to transform the unknown concentration of chlorine in water into analog voltage signal. This signal is further converted into digital signal and manipulated into concentration value of chlorine by the microcontroller unit. The developed device is cheap, portable, and easy to operate. Since it is capable of being operated by small dry batteries, it is suitable for use in remote areas. It has been successfully used for the measurement of concentration of Cl2 in water solution. The device
can be used for the detection of some other similar type of chemical species in water.
Future scope: The analyzer will be modified for the general purpose water analysis by employing more LEDs of different colors. The battery charger circuit will be included in the modified circuit for the use of rechargeable battery.
ACKNOWLEDGMENT
Author is thankful to the Principal, N. Wadia College, Pune, for providing the laboratory facility.
REFERENCES
[1] S. Gundry, J. Wright, and R. Conroy, “A systematic review of the health outcomes related to household water quality in developing countries.” Journal of Water and Health, Vol. 2(1), pp.1-13, 2004.
[2] Y. Song, G. M. Swain, “Total inorganic arsenic detection in real water samples using anodic stripping voltametry and a gold-coated diamond thin-film electrode,” Analytica Chimica Acta, Vol. 593, 7-12, 2007.
[3] O. Ogbonn, W.L. Jimoh, E. F. Awagu and E. I. Bamishaiye, “Determination of some trace elements in water samples within kano metropolis.” Adv. Appl. Sci. Res., Vol. 2 (2), pp.62-68, 2011.
[4] F. Kozisek, Health risks from drinking demineralised water,WHO, Geneva, 2004.
[5] S. B. Somani, N. W. Ingole, “Alternative approach to chlorination for disinfection of drinking water - an overview,” Int. J. of Adv. Eng. Res. and Studies, Vol. 1 (1), 47-50, 2011.
[6] J. H. Davies, MSP430 Microcontroller Basics, Elsevier, 2008.
[7] A. Skoog, D. M. West, F. J. Holler & S. R. Crouch, Fundamentals ofAnalytical Chemistry, 8thEdn, Thomson-Brooks/Cole, 2004.
[8] J. Gordon, S. Harman. “A Graduated Cylinder Colorimeter: An Investigation of Path Length and the Beer-Lambert Law.” J. Chem. Educ. Vol.79 (5), pp.611-612, 2002.
[9] G. R. Chatwal, S. K. Anand, Instrumental Methods of chemical analysis, Himalaya publishing house, 5th
Edn, 2008.
0 0.2 0.4 0.6 0.8 1 1.2
1 2 3 4 5
A
Concentration (10-4mole L-1 )
y0
(An ISO 3297: 2007 Certified Organization)
Vol. 3, Issue 4, April 2014
Copyright to IJIRSET www.ijirset.com 10897
[10] P. K. Bhadane, S. P. Bhangale, M. S. Hira, “Development of microcontroller based inexpensive water analyzer: A photoelectric design approach,” Int. J. of Inn. Res. in Sc., Eng. and Tech., Vol.3 (3), pp.10591-10599, 2014.
[11] “IAR Embedded Workbench version 3+ for MSP430 User’s Guide,” Texas Instruments, 2013. [12] “eZ430-F2013 development tool,” Texas Instruments, 2010