Available Online at www.ijpret.com 663
INTERNATIONAL JOURNAL OF PURE AND
APPLIED RESEARCH IN ENGINEERING
AND TECHNOLOGY
A PATH FOR HORIZING YOUR INNOVATIVE WORK
CLASSIFICATION BASED METHODOLOGY FOR DIABETIC RETINOPATHY
DETECTION
PRIYANKA ASHOK PATRE
Dept. of Electronics and Telecommunication Engineering. Goa College Of Engineering, Farmagudi, Goa-403804
Accepted Date: 15/03/2016; Published Date: 01/05/2016
\
Abstract-Diabetes is a disease in which the blood glucose levels are too high. Diabetes can encourage disorders in the body of patients, if not diagnosed and treated in time. One such disorder caused due to diabetes is related to the retina of human eyes that ways affects the retina known as Diabetic Retinopathy. It damages the retina of the eye leading to vision loss. Thus the objective of this thesis is to detect diabetic retinopathy using image processing based on the analysis of the extraction and classification. Thus diagnosing and detecting the severity of the disease.
Keywords: Microaneurysm, Classification, Segmentation, Retinopathy.
Corresponding Author: MS. PRIYANKA ASHOK PATRE
Access Online On:
www.ijpret.com
How to Cite This Article:
Priyanka Ashok Patre, IJPRET, 2016; Volume 4 (9): 663-670
Available Online at www.ijpret.com 664 INTRODUCTION
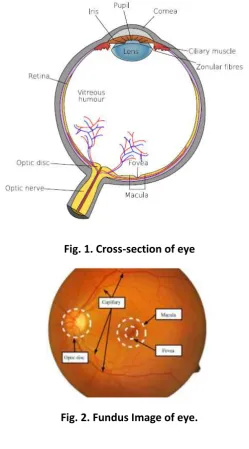
In the optical sciences, the human eye is often related to a camera (1). Light reflected from an object is focused on the retina after passing through the cornea, pupil and lens.
This is comparable to light passing through the camera optics to the film or a sensor. In the retina, the incoming information is received by the photoreceptor cells which detect light. From the retina, the information is further transmitted to the brain, where the sensation of sight is produced via the optic nerve. During the transmission, the information is processed in the retinal layers. A cross-section of the eye is presented below,
Fig. 1. Cross-section of eye
Available Online at www.ijpret.com 665
Diabetic retinopathy (2) is a micro-vascular barrier caused by diabetes which can lead to vision loss. In early stages of diabetic retinopathy typically there are no observable signs but the severity of irregularities in the retina increase during the time (3)(4) .
There are 2 types of Retinopathy:
Non proliferative diabetic retinopathy: In this condition, the capillaries of retina get damaged and microscopic leaks are formed in the vessels. Leakage causes retina to swell, which interferes with normal vision .
• Micro-aneurysms
• Hard exudates
• Soft exudates
• Dot and blot haemorrhages
Proliferative diabetic retinopathy: In this condition, the capillaries of retina are shut down causing new blood vessels to grow in retina.
• Vitreous haemorrhage
• Pre retinal haemorrhage
Subsequently in order to classify the DR types of the fundus images based on Classification(5)(7) image processing techniques(6) are applied to extract the features providing accurate results.
II. PROPOSED SYSTEM
The proposed system highlights on determining the types of DR. These types can be extracted using fundus images of patients and processing it through appropriate image processing techniques. Based on the presence and the amount of DR types in the fundus image the level of DR is determined in patients.
The analysis of the fundus image is done by the following steps:
(i) Pre-processing
(ii) Segmentation
(iii) Feature Extraction
Available Online at www.ijpret.com 666 Fig.3. Block diagram of proposed system.
A. Database
The fundus images required for the analysis are taken from DIARETDB1 database. It consists of 89 color fundus images of which 84 contain at least mild non-proliferative signs (Ma) of the diabetic retinopathy and 5 are considered as normal.
B. Pre-Processing
The block Diagram depicts the Pre-processing of fundus image which includes the following techniques,
Fig.4. Block diagram of pre-processing system.
1) Grey Scale Conversion: Gray scale images are often the result of determining the intensity of light at each pixel in a single band of the electromagnetic spectrum.
2) Filtering: Median filter is the nonlinear filter more used to remove the impulsive noise from an image. It uses a 2-D mask that is applied to each pixel in the input image to center it in a pixel, evaluating the covered pixel brightness. The median value is then determined by placing the brightness in ascending order and selecting the center value. Thus the obtained median value will be the value for that pixel in the output image.
3) Histogram Equalization: Histogram equalization is a method of contrast adjustment using the image's histogram. This method usually increases the global contrast of many images thus allows areas of lower local contrast to gain a higher contrast.
Available Online at www.ijpret.com 667
The aim of image segmentation is to partition an image into a set of areas with uniform and identical attributes
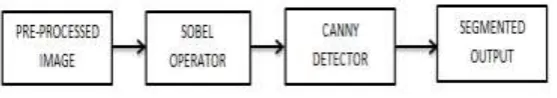
Edge detection is a type of image segmentation techniques which determine the presence of an edge in image to reduce the amount of data to be processed. Edges are determined using various types of Edge detector operators. In this thesis the blood vessels are segmented from the fundus images by applying Sobel operator followed by Canny detector.
Fig. 5. Block diagram of Segmentation system.
1) Sobel Operator:
The sobel operator performs a 2-D spatial gradient measurement on an image. The sobel edge detector uses a pair of 3 x 3 convolution kernels mask to estimate the gradient in x direction (columns) and other for y-direction (rows).The magnitude of the gradient is calculated by using the formula
2) Canny Detector:
The canny detector detects if the gradient magnitude is larger than those of pixels at both its sides in the direction of maximum intensity changes to classify a pixel as an edge.
Gradients at each pixel are determined by applying the Sobel-operator followed by non-maximum suppression which is used to suppress any pixel value that is not considered to be an edge. After suppression, Double Thresholding is carried out wherein edge pixels stronger than the high threshold are marked as strong; edge pixels weaker than the low threshold are suppressed.
D. Feature Extraction:
The feature extraction is a process wherein various features of the segmented image are extracted and given to a classifier.
Available Online at www.ijpret.com 668
The following features of the segmented fundus image are extracted and applied as an input to the classifier;
1) Contrast: Contrast of an image yields a measure of the intensity contrast between a pixel and its neighbor over the image.
2) Energy: Energy relates to the mean squared value of the image measured with respect to the global mean value.
3) Homogeneity: Homogeneity of image gives a value that measures the closeness of the distribution of elements in the matrix to the GLCM diagonal
4). Correlation: The correlation returns a measure of how correlated a pixel is to its neighbor over the image.
Fig.6. Image after Pre-processing of fundus image.
Fig.7. Output after applying segmentation
E. Classification:
Available Online at www.ijpret.com 669
hidden layers. The number of input neurons taken is 4 and output neuron is 2, and the number of hidden unit neuron is chosen as 40.
So for the purpose of training and testing the 89 fundus images were divided into 2 classes.
The most popular approach to finding the optimal number of hidden layers is by trial and error. Rapid execution of the trained network is the main advantage of using this type of Artificial Neural Networks. In most applications, the weights are determined by means of the backpropagation algorithm. Backpropogation is based on examining an error surface as a function of ANN weights using gradient descent for points with least error.
So basically classifier classifies the fundus images into 2 classes; Normal Retinal Images and Images affected by Microaneurysm.
Fig.7. Confusion Plot
Available Online at www.ijpret.com 670 CONCLUSION
In this paper, the neural network classifier is developed as an analytical implementation to aid physician in the classification of normal and Diabetic Retinopathy affected images. Total 4 features namely Contrast, Energy, Correlation and Homogeneity are extracted in order to classify the images accordingly contributing to accurate diagnosis.
REFERENCES:
1. Alireza Osareh, Bita Shadgar, and Richard Markham, A Computational-Intelligence-Based
Approach for Detection of Exudates in Diabetic Retinopathy Images IEEE TRANSACTIONS ON INFORMATION TECHNOLOGY IN BIOMEDICINE, VOL. 13, NO. 4, JULY 2009.
2. Istvan Lazar* and Andras Hajdu , Retinal Microaneurysm Detection Through Local
Rotating Cross-Section Profile Analysis, IEEE TRANSACTIONS ON MEDICAL IMAGING, VOL. 32, NO. 2, FEBRUARY 2013.
3. Meera Walvekar1,Geeta Salunke2,Detection of diabetic retinopathy with feature
extraction using Image Processing, International Journal of Emerging Technology and Advanced Engineering Website: www.ijetae.com (ISSN 2250-2459, ISO 9001:2008 Certified Journal, Volume 5, Issue 1, January 2015.
4. C. I. Sánchez1,2, R. Hornero1,2, M. I. López2, J. Poza1,2 Retinal Image Analysis to Detect
and Quantify Lesions Associated with Diabetic Retinopathy, Proceedings of the 26th Annual International Conference of the IEEE EMBS.
5. Meindert Niemeijer*, Bram van Ginneken, Member, IEEE, Michael J. Cree, Senior
Member, IEEE, Retinopathy Online Challenge: Automatic Detection of Microaneurysms in Digital Color Fundus Photographs IEEE TRANSACTIONS ON MEDICAL IMAGING, VOL. 29, NO. 1, JANUARY 2010.
6. João V. B. Soares*, Jorge J. G. Leandro, Roberto M. Cesar Jr., Herbert F. Jelinek, and
Michael J. Cree, Senior Member, IEEE, Retinal Vessel Segmentation Using the 2-D Gabor Wavelet and Supervised Classification, IEEE TRANSACTIONS ON MEDICAL IMAGING, VOL. 25, NO. 9, SEPTEMBER 2006.
7. Zhenghao Shi1,and Lifeng He School of Computer Science and Engineering, Xi’an