University of South Carolina
Scholar Commons
Theses and Dissertations
2017
The Contextual Impact Of Innovation And
Operational Spillovers On Firm Performance
Cherry Singhal
University of South Carolina
Follow this and additional works at:https://scholarcommons.sc.edu/etd
Part of theBusiness Administration, Management, and Operations Commons
This Open Access Dissertation is brought to you by Scholar Commons. It has been accepted for inclusion in Theses and Dissertations by an authorized administrator of Scholar Commons. For more information, please [email protected].
Recommended Citation
THE
CONTEXTUAL
IMPACT
OF
INNOVATION
AND
OPERATIONAL
SPILLOVERS
ON
FIRM
PERFORMANCE
by
Cherry Singhal
Bachelor of Computer Science and Engineering Uttar Pradesh Technical University, 2006
Master of Business Administration University of South Carolina, 2010
Submitted in Partial Fulfillment of the Requirements
For the Degree of Doctor of Philosophy in
Business Administration
Darla Moore School of Business
University of South Carolina
2017
Accepted by:
Manoj Malhotra, Major Professor
Luv Sharma, Committee Member
Keith Skowronski, Committee Member
Alan Mackelprang, Committee Member
ii
iii
DEDICATION
To my mother Mrs. Amita Singhal and professor Dr. Manoj Malhotra. To all who have
iv
ACKNOWLEDGEMENTS
Many thanks to my mother Amita Singhal and my grandmother Bimla Gupta for sharing
my worries and doubling my happiness, because I owe it all to you. To my brother
Saryou Singhal and my aunt Anita Mittal for always being my cheerleaders.
Besides my family, I would like to express my humble gratitude to my mentors
Dr. Manoj Malhotra and Dr. Alan Mackleprang for their continuous support throughout
my studies. I cannot say enough about the patience they have shown me. Dr. Malhotra
has pulled me out from my darkest moments, and was like family in the absence of my
actual family. Despite his extremely busy schedule, he would always check up on how I
was proceeding. Dr. Mackleprang’s never-ending optimism was another major driving
force, and his one comment, “You are very close” is what got me through every time I hit
a roadblock. It was his time and effort that enabled me to explore the depths of my
dissertation topic. His belief that I am capable of doing good work is what inspires me to
carry on.
I would also like to thank the rest of my dissertation committee: Dr. Keith
Skowronski and Dr. Luv Sharma, for their insightful comments. With a special mention
to Dr. J. Jenson, Dr. S. Ahire, and Dr. C. Queenan for being the helpful and wonderful
faculty that they are. I am also grateful to Scott Ranges for his assistance in all things
administrative. Last but not the least, a special thank you to my friend John Saavedra.
v
ABSTRACT
Extant literature across various research disciplines has investigated the influence of a
firm’s technological innovation on its performance. However, the findings on this
relationship remain inconclusive as it is subject to many strategic and environmental
factors. In this dissertation, the relationship between a firm’s technological innovation
and performance is evaluated. Additionally, this relationship is examined in the presence
of various contextual factors.
In the first study, meta-analysis is utilized to quantitatively aggregate existing
empirical research in this domain. Cultural and institutional aspects of the nation in
which the firm operates are examined for their potential in explaining variability within
the technology innovation-performance relationship. Results indicate that better
performance outcomes are observed when innovation occurs in those nations that have
lower inclination to avoid uncertainty and/or collectivistic attitudes. Counter-intuitively,
performance suffers when innovation occurs in nations with stronger patent protection
framework.
It has been increasingly demonstrated that research and development related
innovation-knowledge spillovers can impact the performance of both the innovative firm
as well as its competitor/s. In the second study, a contribution to the spillover literature is
made by exploring spillovers of operational knowledge, referred to as operational
vi
flexibility are examined. The results suggest that operational spillovers only help firms
that need additional operational knowledge resources. A novel and counterintuitive
finding is that the financial performance of all other firms is negatively impacted by
learning via operational spillovers. These results suggest that operational spillovers
should be sought only in specific circumstances, and otherwise avoided.
In the third and final study, the financial implications of operational spillovers
from the industry leaders and laggards are examined within the context of the
environment in which the firm operates. A firm’s external operating environment largely
determines the degree of uncertainty confronted in its day-to-day operations. Specifically,
munificence, dynamism and complexity are examined as distinct components of
environmental uncertainty. The final study answers how these dimensions of
industry-level environmental uncertainty enable or prohibit the successful exploitation of
vii
TABLE OF CONTENTS
DEDICATION ... iii
ACKNOWLEDGEMENTS ... iv
ABSTRACT ...v
LIST OF TABLES ... ix
LIST OF FIGURES ... xi
CHAPTER 1 Overview...1
1.1: Introduction ...1
1.2: Dissertation Organization ...1
CHAPTER 2 Relationship between Technological Innovation and Firm Performance: A Meta-Analytic Investigation ...4
2.1: Introduction ...4
2.2: Literature Review and Hypothesis Development ...7
2.3: Data and Methodology ...17
2.4: Analysis and Results ...25
2.5: Discussion ...32
2.6: Conclusion ...34
CHAPTER 3 Assessing the Implications of Inventory, Sourcing Lead Time, and Volume Flexibility Spillovers on the Financial Performance of Manufacturing Firms ...37
viii
3.2: Related Literature ...40
3.3: Theoretical Framework ...43
3.4: Hypotheses Development ...44
3.5: Data and Measures ...48
3.6: Analysis and Results ...53
3.7: Discussion ...74
3.8: Conclusion ...79
CHAPTER 4 Examining Contextual Factors of the Relationship between Operational Spillovers and Financial Performance of Manufacturing Firms ...80
4.1: Introduction ...80
4.2: Theoretical Background on Spillovers ...83
4.3: Hypotheses Development ...87
4.4: Data and Measures ...94
4.5: Analysis and Results ...99
4.6: Discussion ...126
4.7: Conclusion ...129
CHAPTER 5 Conclusion ...131
BIBLIOGRAPHY ...135
ix
LIST OF TABLES
Table 2.1 Descriptive Statistics of the Study Sample (N=28) ...22
Table 2.2 Description of the Moderating Variables ...25
Table 2.3 Results of HOMA (Hypothesis 1) ...26
Table 2.4 Results of MARA (Hypothesis 2-5) ...27
Table 2.5 Robustness Test ...31
Table 3.1 Descriptive Statistics ...53
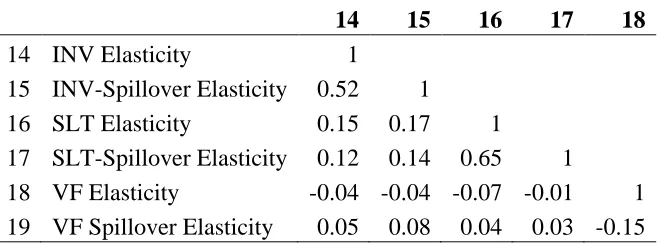
Table 3.2 Correlations Table ...54
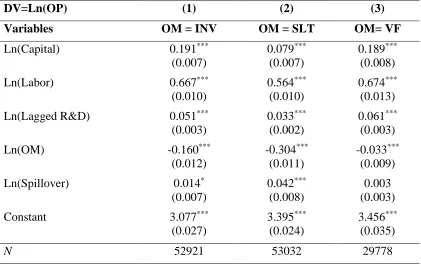
Table 3.3 RCM Results ...56
Table 3.4 Descriptive Statistics for Firm-Specific Elasticities ...58
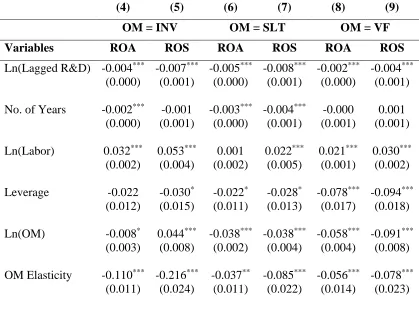
Table 3.5 OLS Regression Results for Hypothesis 2 ...62
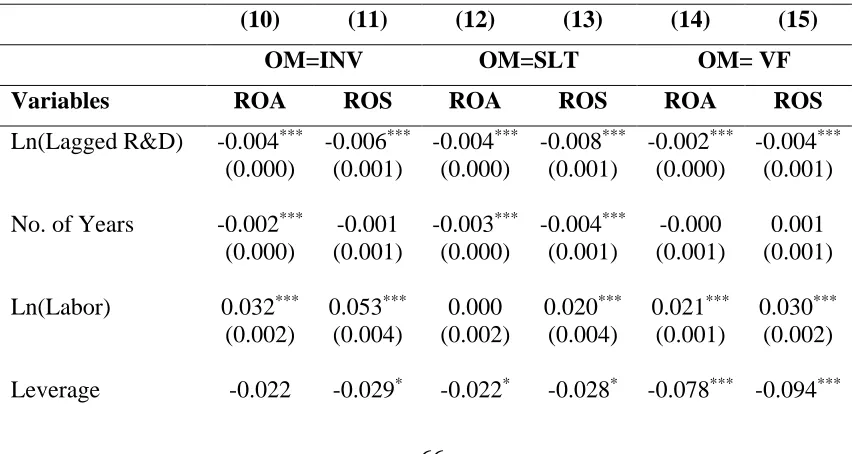
Table 3.6 OLS Regression Results for Hypothesis 3 ...66
Table 3.7 Instrumental Variables Regression Results ...74
Table 4.1 Sample Distribution by Industry ...94
Table 4.2 Sample Distribution by Time in Years ...94
Table 4.3 Descriptive Statistics ...96
Table 4.4 Descriptive Statistics for Environmental Variables ...99
Table 4.5 RCM Results ...100
Table 4.6 Descriptive Statistics for Firm-Specific Elasticities ...101
Table 4.7 Regression Results for Hypothesis 1 ...103
x
Table 4.9 Regression Results for Hypothesis 2, DV = ROA ...113
Table 4.10 Regression Results for Hypothesis 2, DV = ROS ...114
Table 4.11 Wald Test Results for Hypothesis 2 ...116
Table 4.12 Regression Results for Hypothesis 3, DV = ROA ...117
Table 4.13 Regression Results for Hypothesis 3, DV = ROS ...118
Table 4.14 Wald Test Results for Hypothesis 3 ...119
xi
LIST OF FIGURES
Figure 2.1 Proposed Technological Innovation and Firm Performance Model ...18
Figure 3.1 Framework for Operational Spillovers in Manufacturing Firms (Adapted from Jaffe 1998) ...43
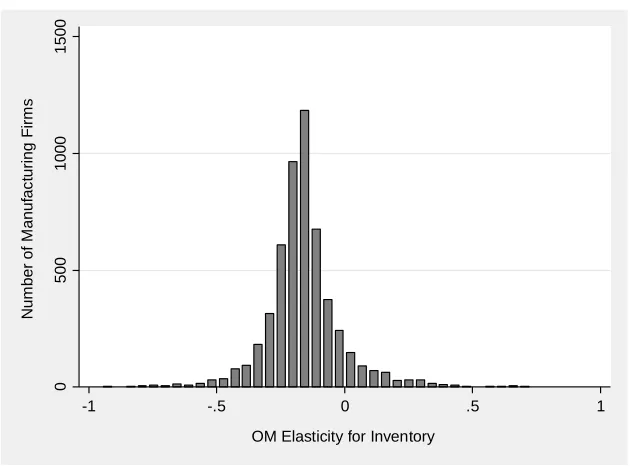
Figure 3.2 Histogram of Firm-Specific OM Elasticities for INV ...58
Figure 3.3 Histogram of Firm-Specific OM Elasticities for SLT ...59
Figure 3.4 Histogram of Firm-Specific OM Elasticities for VF ...59
Figure 3.5 Histogram of Firm-Specific Spillover Elasticities for INV ...60
Figure 3.6 Histogram of Firm-Specific Spillover Elasticities for SLT ...60
Figure 3.7 Histogram of Firm-Specific Spillover Elasticities for VF ...61
Figure 3.8 Interaction Plot: DV=ROA and OM = INV ...68
Figure 3.9 Interaction Plot: DV=ROS and OM = INV ...68
Figure 3.10 Interaction Plot: DV=ROA and OM = SLT ...70
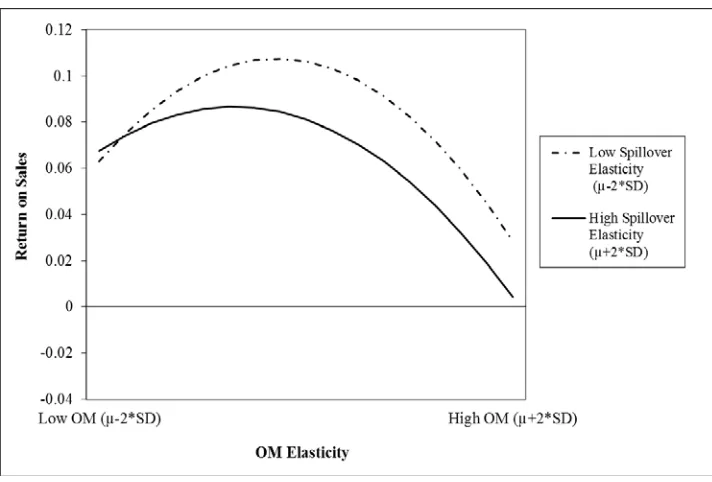
Figure 3.11 Interaction Plot: DV=ROS and OM = SLT ...71
Figure 3.12 Interaction Plot: DV=ROA and OM = VF ...72
Figure 3.13 Interaction Plot: DV=ROS and OM = VF ...72
Figure 4.1 Plot: DV = ROA, OM = INV, and Leader Spillover Elasticity ...106
Figure 4.2 Plot: DV = ROS, OM = INV, and Leader Spillover Elasticity ...106
Figure 4.3 Plot: DV = ROA, OM = INV, and Laggard Spillover Elasticity ...107
Figure 4.4 Plot: DV = ROS, OM = INV, and Laggard Spillover Elasticity ...108
xii
Figure 4.6 Plot: DV = ROS, OM = SLT, and Leader Spillover Elasticity ...110
Figure 4.7 Plot: DV = ROA, OM = SLT, and Laggard Spillover Elasticity ...111
Figure 4.8 Plot: DV = ROS, OM = SLT, and Laggard Spillover Elasticity ...111
Figure 4.9 Plot: OM = INV, Leader Spillover Elasticity, and Low Innovativeness ...121
Figure 4.10 Plot: OM = INV, Leader Spillover Elasticity, and High Innovativeness ...122
Figure 4.11 Plot: OM = SLT, Leader Spillover Elasticity, and High Innovativeness ...123
Figure 4.12 Plot: OM = SLT, Laggard Spillover Elasticity, and High Innovativeness ...123
Figure 4.13 Plot: OM = SLT, Leader Spillover Elasticity, and Low Innovativeness ...124
1
CHAPTER 1
Overview
1.1 Introduction
Technological innovation is a complex and multidimensional construct, that refers to
innovations occurring on the operating side of an organization, for example, introduction
of new/improved products and/or processes. The importance of technological innovation
as a core capability of a firm to sustain competitive advantage is well documented in extant
literature. However, the empirical findings on this relationship remain inconclusive, and
consequently this dissertation focuses on examining ways in which innovation benefits
firms that make those strategic investments, how the ability of a firm to enjoy these benefits
is impacted by the action of other firms to which it is connected, and whether environmental
effects tied to a given industry have a bearing on these relationships. Three inter-related,
yet distinct studies, are structured to fulfill these objectives, and are described next.
1.2 Dissertation Organization
In Chapter 2 of the dissertation, an attempt is made to reconcile the mixed empirical results
on the overarching relationship of technological innovation and firm performance. Thirteen
major journals from the field of Operations Management (OM), Economics, Finance,
Strategy, and Management were searched with the goal of collecting relevant studies that
had empirically examined the said relationship. This inter-disciplinary literature review
2
methodology, the findings on the focal relationship from each of the studies in the sample
were quantitatively compiled and coded. Based on a meta-analysis of 132 effect sizes
obtained from these 28 studies, the overall relationship between a firm’s technological
innovation and performance is shown to be significant and positive. Second, empirical
support for the moderating influence of cross-cultural and institutional differences on the
said relationship is also established. When innovation occurs in those nations that have
lower propensity to avoid uncertainty and/or collectivistic attitudes, better performance
outcomes are observed. In contrast, performance suffers when technological innovation
occurs in nations that have stronger patent protection. The reasons for these expected as
well as counter-intuitive results are discussed.
While Chapter 2 includes both the manufacturing and service sector firms, the
subsequent chapters focus exclusively on the manufacturing sector where the notions of
supply chains and inter-firm connections have been better established. In Chapter 3 of the
dissertation, the context of spillovers is introduced into the evaluation of the focal
relationship. There exists empirical evidence that firm’s performance sensitivity to its
internal innovation activities is also impacted by innovation carried out by its opponent
firm (s) (Cohen et al., 2000; Heeley et al., 2007). Firms tend to exploit the
innovation-knowledge resources that leak out from other innovative firms, and thereby imitate what
its competitors are doing well. Such leakage of innovation-knowledge resources is referred
to as Spillovers (Jaffe, 1998). Exploitation of spillovers brings down the innovation-related
investment costs, as well as reduces the risk of failure because firms only use spillover
knowledge from successful innovators. This expropriation can augment the rival firm’s
3
studies have empirically examined spillovers and their impact on firm performance using
research and development (R&D) as the measure of innovation-knowledge spillovers. This
dissertation for the first time introduces the notion of spillovers as they relate specifically
to operational knowledge. These operational spillovers are characterized in terms of
inventory, sourcing lead time, and volume flexibility. Using the resource-based view
(RBV) of a firm, the impact of operational spillovers on firm performance is evaluated to
empirically show that firms are heterogenous in nature when it comes to benefitting from
operational spillovers. Even more interestingly, operational spillovers financially benefit
only those firms which have undeveloped operational capabilities. All other firms are
paradoxically hurt financially from operational spillovers.
In Chapter 4 of the dissertation, the focal relationship is evaluated in the context of
three industry-level environmental factors. The environment of the industry in which a firm
operates influences a firm’s strategic decisions, as well as its performance, and is broadly
categorized along three dimensions: munificence, dynamism, and complexity (Pagell and
Krause, 2004). Together, these three factors reflect the degree of uncertainty the firm faces
in their operating environment. Given that not all operational capabilities are equally
relevant and valuable under all operating conditions, the aim of this chapter is to identify
the external operating conditions that facilitate the reaping of financial benefits (penalties)
from operational spillovers.
Finally, this dissertation concludes in Chapter 5 with a summary of overarching
4
CHAPTER 2
Relationship Between Technological Innovation and Firm Performance:
A Meta-Analytic Investigation
2.1 Introduction
A firm's initiatives for innovation have been argued by many to be the driving force behind
its success and growth (Greenhalgh and Rogers, 2010). Even during the 2008 financial
crisis, many US companies, while cutting costs in other areas, continued to invest in
research and development (R&D) (Scheck and Glader, 2009). In today’s competitive
market, start-ups can quickly replace incumbent firms if they do not strive to stay ahead of
the innovation curve. In the presence of globalization and technological advancements,
firms from emerging markets are steadily gaining dominance over their developed-country
counterparts simply by innovating (Shaughnessy, 2017). In brief, firms need to
continuously innovate to ensure competitive advantage and maintain their position in the
market (Greenhalgh and Rogers, 2010). However, some scholars argue against the
performance benefits of innovation primarily because of the inherent nature of innovation.
Arguably, performance returns to innovation are diminished because of the (a) associated
high investment costs to innovation, (b) uncertainty of returns to innovation (c) long delays
in reaping those returns, (d) difficulty of effectively measuring those returns, and (e)
perceived risk of failure by management, among others (Hall, 2010; Sood and Tellis, 2009).
On top of that, the inadequacy of the existing measures of innovation further
5
(Zhang et al., 2012). To complicate the said relationship further, innovation does not occur
in a vacuum, and is affected by a host of environmental conditions (both internal as well
as external) (Zhang et al., 2012). Prior literature has attempted to evaluate how the
implementation of innovation is influenced by various factors such as the country of
operation and its culture (Power et al., 2010), environmental turbulence or uncertainty
(Jean et al., 2012), type of structure (mechanistic or organic), industrial network of
operation (Li and Atuahene‐Gima, 2002), supplier involvement (Jean et al., 2012; Song et
al., 2011), organizational size (Li and Atuahene‐Gima, 2002; McDermott and Prajogo,
2012), and organizational structure and processes (Jansen et al., 2006). The evaluation of
certain contextual factors (for example, cross-country differences) can get overwhelming
for traditional-style studies; due to methodological and sample size limitations. On the
other hand, a quantitative aggregation of all prior innovation-related studies using
meta-analysis methodology affords one the possibility to examine the impact of such contextual
factors that would be difficult to examine otherwise. Specifically, in this chapter the
innovation→ performance link is examined under the lens of two such factors- the
institutional and the cultural environment of a nation within which a firm operates.
As mentioned earlier, numerous studies have shown that a firm’s working
environment (both internal and external) can enable or inhibit the performance benefits
from innovation activities (Heugens et al., 2009; Li et al., 2010; Oliver and Holzinger,
2008). First, the institution-based view suggests that firms enjoy greater performance
benefits to innovation activities if they operate in nations with stronger institutional
environments (Heugens et al., 2009). Two characteristics of a strong institutional
6
and market regulation, and (b) the strength of intellectual property rights (Claessens and
Tzioumis, 2006; Pisano, 2006; Varsakelis, 2001). Since innovation is a high-cost activity,
firms that operate in financially well-developed and well-regulated nations can be expected
to perform better. Additionally, firms that operate in nations with a strong legal framework
for protection of intellectual property are better able to monopolize the financial returns on
their innovative products. Second, both practicing managers and academic researchers
have emphasized the importance of cultural elements in influencing innovation (Power et
al., 2010; Steensma et al., 2000). In the context of innovation, the two most commonly
studied cultural elements are degree of individualism and uncertainty avoidance (Shane,
1993) and empirical results have been shown to vary across these two dimensions
(Rosenbusch et al., 2011). Consequently, using multivariate meta-analytical techniques
that have been specifically designed to capture and assess such conflicting relationships,
this chapter focuses on providing some resolution to this ongoing debate, as well as provide
contextual insights about performance sensitivity to innovation efforts. Therefore, this
chapter attempts to answer the following questions:
1. Do technological innovations enhance a firm’s outcomes?
2. Does the relationship between technological innovation and firm performance
differ across nations in terms of the extent of capital market regulatory-type
institutional context and the strength of intellectual property rights in a nation?
3. Does the relationship between technological innovation and firm performance
differ across nations in terms of uncertainty avoidance and degree of individualism?
The rest of the chapter is structured as follows. In section 2.2, the theoretical
7
overview of the meta-analytic methodology and the procedure to select and code studies.
In sections 2.4 and 2.5, the results of this analysis and the implications of the findings are
discussed. Potential limitations, and suggestions for future work are discussed in the
concluding section of the chapter.
2.2 Literature Review and Hypothesis Development
2.2.1 Technological Innovation Construct
Prior research on innovation has categorized it in many ways. One of the most popular
typologies to date has been the distinction between “technological” and “administrative”
type of innovation (Damanpour et al., 2009). Administrative innovations are defined as
“those that occur in the administrative component and the social system of an
organization” while technological innovations, on the other hand, are defined as “those
that occur in the operating component and affect the technical system of an organization”
(Damanpour et al., 2009). Technological innovation is relevant in the context of Operations
Management (OM), since it comprises product innovation and process innovation in both
manufacturing as well as service industries. Product innovations are defined as those
innovations that result in the introduction of a new or significantly improved product.
Process innovations are defined as those innovations that result in the introduction of a new
or significantly improved process. For example, introducing advanced manufacturing
technologies or quality improvement programs can potentially enhance manufacturing
systems (Boyer et al., 1997; McAfee, 2002). Prior literature has argued that different
innovation types vary in their focus and outcomes (Damanpour et al., 2009). Most of the
8
them distinguish between product and process innovations. Hence, given the limitations of
the study sample, this chapter is restricted to the typology level of technological innovation.
The construct of technological innovation is multi-faceted in nature and to capture
it appropriately and adequately, remains an open research area. Thus far, researchers have
employed numerous measures, comprising both perceptual (Jansen et al., 2006) as well as
objective type. The objective measures include, but are not limited to, R&D expenditures
(Ettlie and Pavlou, 2006; Song et al., 2011), R&D intensity (Han et al., 2013), patent counts
(Durand et al., 2008; Zhao, 2009), patent citations (Zhao, 2009), new product introductions
(Girotra et al., 2007), product radicalness (Oke, 2007), innovation-related announcements
(Hendricks and Singhal, 2008), and innovation awards (Zhang et al., 2012). All these
existing measures of technological innovation offer their own set of contributions and
drawbacks (Zhang et al., 2012). For example, the most frequently used measure of
innovation in empirical research is R&D spending. As a financial measure, R&D spending
can assist in the comparison of firms in terms of spending levels as a percentage of firm
sales, and makes the argument that a firm that spends more also innovates more. However,
R&D fails to capture a firm’s internal capabilities to innovate. The R&D-spending measure
incorrectly assumes that firms are homogenous in nature and that any two firms would
perform identically at a given level of R&D. Recent research has shown that firms in fact
differ in their abilities to innovate (Knott, 2008). In addition, innovation is not solely based
on high amounts of R&D investment, but also on the working environment within a firm,
for example, whether employees pursue risky ideas that have the potential of a
breakthrough (Hall, 2010). In brief, innovation has multiple dimensions and no single
9
setting, a meta-analysis of technological innovation can help to get an overall
understanding of its relationship to firm performance.
2.2.2 Technological Innovation and Firm Performance
The relationship between technological innovation and firm performance has been
extensively investigated across disciplines, but the overall results are mixed and
inconclusive (Han et al., 2013; Oke, 2007). Extant research has looked at various reasons
to explain the inconclusive nature of the technological innovation → performance
relationship. Examples of studies that demonstrate a negative relationship are Durand et al.
(2008) that found a firm’s financial performance (measured by return on sales) to be
negatively affected by patent activity of that firm in the biotechnology sector; and
Terwiesch and Loch (1998) that similarly concluded a negative to no impact of innovation
intensity on a firm’s profitability. The researchers on the dark side of this debate have
argued in favor of a negative relationship between technological innovation and firm
performance because of the associated sky-high investment costs, uncertainty of returns
from those investments as well as long delays associated with those returns
(Chandrasekaran and Tellis, 2008; Sood et al., 2009). Zhang et al. (2012) argues that the
market only rewards ‘commercially-successful’ innovations and not just efforts in
innovation like patenting. Then, an added challenge is accurately measuring firm’s
financial returns from innovation investments given the increasing speed of innovation
diffusion across global markets and the existence of diverse patterns of consumer adoption
across products and countries (Chandrasekaran and Tellis, 2008; Sood and Tellis, 2009).
Some scholars have attributed the contradictory nature of these findings to the lack
10
example, Heeley et al. (2007) studied the effect of R&D and patenting on firm’s financial
performance and found opposing results. They posit that R&D investment as an input to
the innovation process is a marker of the level of a firm’s innovation; while patenting
reflects a firm’s innovation output. They empirically showed that higher R&D intensity
lead to an increase in stock returns, but patent count had no effect on stock returns. Given
the drawbacks of the existing measures, Zhang et al. (2012) came up with a new measure
of innovation-innovation awards. They argue that winning an innovation award measures
the overall effectiveness of that innovation which goes beyond merely introducing an
innovative product/process, thereby providing a more accurate picture of its effect on firm
profitability. They do urge for more future research to better understand and resolve the
ongoing debate.
Furthermore, researchers have argued that a firm’s performance measures are
subject to various contextual factors, and empirically investigated how they can influence
the direction of the impact of innovation on firm performance. For example, Jansen et al.
(2006) found that exploratory innovation had a positive impact on a firm’s financial
performance, while exploitative innovation had a negative impact if the operating
environment was dynamic in nature. Thornhill (2006) concluded that innovation positively
impacts performance under the effect of industry dynamism.
The review of innovation literature shows that the majority of the empirical
research favors a positive relationship though. For example, the seminal meta-analysis
paper by Capon et al. (1990) empirically concluded that R&D-intensive firms achieve
higher financial performance. Chaney and Devinney (2006) similarly found positive
11
concluded innovation to be positively related to firm performance. An event study by
Zhang et al. (2012), that was based on a sample of 1141 firms, found innovation-award
winning firms to be financially more successful.
To conclude, extant literature has explored various pathways to explain the
conflicting nature of technological innovation → performance relationship, but given the
associated complexity and richness of this debate, a generalizable conclusion is yet to be
found. A meta-analytic investigation will help to validate and generalize the focal
relationship over the varying empirical settings in different papers, something that can be
overwhelming or out-of-scope for a single traditional-style empirical study. Accurately
assessing the effects of technological innovation on firm-level outcomes may be critical to
empirically proving that markets respond favorably to technological innovation, which in
turn can motivate firms to invest in it. Given the above arguments, the first hypothesis to
test the overall focal relationship is stated as follows, while recognizing that no distinction
is made between the different stages of innovation process in this chapter (Wolfe 1994).
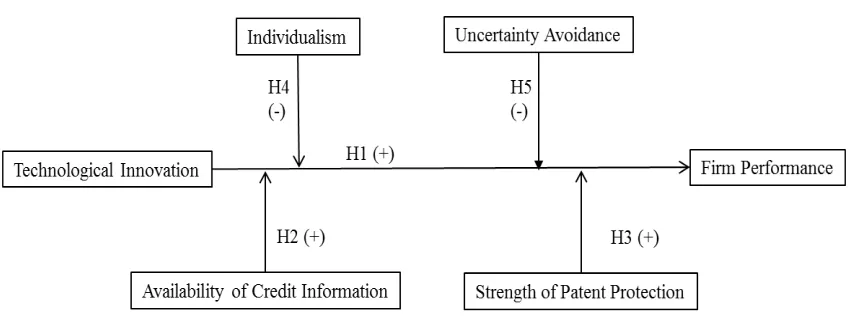
Hypothesis 1. Technological innovations of a firm are positively related to its performance.
2.2.3 Country-Level Moderating Effects
The country-level moderating effects relate to the influence of institutional environment
and the influence of culture. The latter has multiple dimensions, two of which are
specifically addressed in this study.
2.2.3.1 Influence of Institutional Environment
The institution-based view (IBV) says that a firm’s strategies, practices, and outcomes are
12
(Scott, 2013). The term ‘institutional environment’ of a nation represents the rules and
regulations created by different institutional forces like political, legal, economic, and
social systems. Ignoring the institutional environment prevents us from getting a deeper
understanding of the drivers of firm performance in both developed (Oliver and Holzinger,
2008) as well as developing countries (Lau and Bruton, 2008). Heugens et al. (2009) in
their meta-analytic study covering 11 Asian countries and 65 research papers, concluded a
significant role of jurisdictional institutional factors on firm performance. IBV has
re-emerged as a leading strategic perspective in recent research in explaining firm-level
heterogeneity (Li et al., 2010; Mike et al., 2009; Van Essen et al., 2012; Wang et al., 2016).
A study by Li et al. (2010) examined the role of offshore OEM cooperation on local
Chinese suppliers under the influence of ill-developed formal institutions that are found in
China. Another recent study by Wang et al. (2016) examined the role of institutional
environment on buyer-supplier relationships in emerging markets.
In this chapter, it is posited that part of the heterogeneity in the strength of the focal
relationship can be explained by the institutional environment of the nation in which the
firm operates. In the case of innovation, UNESCO’s Institute of Statistics (UIS) in their
(2009) report notes a weak institutional environment characterized by weakness of property
rights and market regulation among others as an impediment to innovation. While the
institutional environment has many dimensions, the focus here is specifically on the level
of financial development and the level of intellectual-property protection of a nation.
Firms in general, and more specifically those that indulge in their own innovation
activities, require funding. It has been empirically shown that firms perform better in
13
of a nation is capital market regulation. Firms use the capital market to raise those
much-needed long-term funds. Availability of such long-term funds can feed a firm’s research
and development and/or patenting costs, in short, innovation activities. An
innovation-related project is typically performed in multiple stages over a considerable amount of time.
A firm’s credit-worthiness is re-visited by the lending parties throughout the different
stages of the project. The government monitors and regulates the capital market to ensure
its efficient functioning. The primary purpose of these regulations is to protect investors
from fraudulent transactions. Various studies have examined how these capital market
regulations impact economic activity in a nation (Barbosa and Faria, 2011; Cressy, 1996).
Well-established capital markets (characterized by the availability of financial credit) have
been shown to positively impact a firm’s innovation (Barbosa and Faria, 2011; Bottazzi
and Da Rin, 2002). In line with Barbosa and Faria (2011), the availability of credit
information (CII) is used as the proxy for capital market regulation. To conclude,
well-regulated capital markets would allow a reliable and timely access to credit. One way to
maintain/improve the access to credit is by increasing the accessibility and quality of
information about a firm’s credit-worthiness. Hence, it can be reasonably expected that the
availability of credit information will moderate the focal relationship, which leads to the
second hypothesis H2.
Hypothesis 2. The stronger the capital market regulation in a nation, the stronger the
relationship between technological innovation and firm performance.
In addition to better access to finance, possessing rights of ownership (e.g. in the
form of patents and trademarks) on the product/s of their innovative activities (referred to
14
(Ginarte and Park, 1997). The primary motivation for a firm behind investing in innovation
is to augment profits and stay ahead of its competitors. The financial returns from an
innovative product are deeply impacted by the ability of the firm to monopolize the sales
of that product in the target market, as well as prevent any imitation of that product by its
competitors (Jaffe, 1986; Nelson and Winter, 1982). Given the current level of
globalization, innovating firms need to protect their inventions from both domestic as well
as global competition (Chen and Puttitanun, 2005). The national governments have thus
created a legal framework to provide protection to intellectual property of innovating firms
with the objective of (a) incentivizing domestic firms to continue to innovate, and (b) attract
multinational firms into investing in their country (Varsakelis, 2001). In order to draw
comparison across nations in terms of the strength of patent protection offered, the patent
protection index (PPI) created by Ginarte and Park (1997) is utilized. This index measures
the level of patent protection in a nation across five dimensions: (1) extent of coverage of
inventions that are considered patentable, (2) membership in international patent treaties,
(3) duration of protection, (4) enforcement mechanisms, and (5) restrictions on patent
rights (Park, 2008). To conclude, since the legal ownership of its intellectual property via
patents enables the innovating firm to prevent imitation of their innovations, monopolize
the market, and maintain their competitive edge, it is hypothesized that firms operating in
nations with a stronger framework of patent protection would experience better
performance-related outcomes from innovation.
Hypothesis 3. The stronger the patent protection in a nation, the stronger the relationship
15
2.2.3.2 Influence of Culture
The influence of national culture on firm performance is well-established in both OM as
well as other disciplines (Kirkman et al., 2006; Power et al., 2010). Cultural values and
practices are engrained (in other words, institutionalized) within citizens of a nation. The
management practices of a firm reflect the cultural mindsets of the country in which the
firm is based. Majority of the work done on cross-cultural comparisons has adopted the
framework of national culture created by Hofstede (Flynn and Saladin, 2006; Power et al.,
2010). He identified six major dimensions of culture, namely power distance, uncertainty
avoidance, individualism vs. collectivism, masculinity vs. femininity, long-term vs.
short-term orientation, and indulgence vs. restraint (Hofstede et al., 2010). He proposed that
national culture defines and influences how a firm’s management and employees adapt to
new practices and ideas, how they solve problems, how they make decision in uncertain
business situations, whether they value team-work over individual accomplishment and
more; and in turn effects firm outcomes. Innovation-related initiatives made by a firm are
not foreign to this influence either. Becheikh et al. (2006) provide a comprehensive review
of innovation-related empirical studies in the manufacturing sector from 1993-2003. They
found that the overall results on the effects of culture on innovation-related firm outcomes
are quite varied with some significant and some insignificant results. Hence, cross-cultural
differences do play a role in whether firms succeed from the introduction of innovations.
Two of the six cultural dimensions proposed by Hofstede fit well in the context of
innovation based on the inherent nature of innovation and the inclination of the extant
empirical research. First, the dimension of Individualism vs. Collectivism (IDV) has been
16
captures the degree of individualism of a country’s citizens, in other words, the degree to
which people put their own interests over that of the community. Highly individualistic
cultures, like the US, value individual merit and accomplishments. Individuals from these
cultures tend to perform better in projects that ensure individual accountability and
recognition compared to projects that require teamwork. People from collectivistic
cultures, on the other hand, place more emphasis on relationship building (personal or
firm-level or team-firm-level) over a single individual’s interests and achievements. Higher the value
on this dimension, more individualistic is the nation’s culture. Power and his colleagues
(2010) assessed the influence of ‘individualism vs. collectivism’ on innovation-related
investment outcomes in Western and Asian economies, and concluded that
innovation-related investments led to better performance (cost, quality, delivery, and flexibility) in
collectivistic (Asian) economies compared to that in individualistic (Western) economies.
Another study by Rosenbusch et al. (2011), that focused on small and medium-sized
manufacturing firms (SMEs), also concluded that firms based in collectivistic cultures
benefitted more from innovation because work on innovation projects was done
collaboratively between employees as well as with customers and suppliers. Moreover,
they argue that firms in collectivistic cultures tend to imitate more than innovate. As fewer
firms strive for innovation in collectivistic cultures, those few firms that do indulge in true
innovative behavior can benefit more from their efforts than firms based in cultures where
innovation is pursued by the bulk of them.
Innovation requires collective brainstorming of ideas and teamwork in facing the
17
among team members. Building on the previous research, it is hypothesized in H4 that the
focal relationship is stronger in more collectivistic cultures.
Hypothesis 4. The lower the degree of individualism in a nation, the stronger the
relationship between technological innovation and firm performance.
Additionally, the Uncertainty Avoidance (UAI) dimension captures the overall
degree of averseness of a country’s citizens to uncertainty and ambiguity. The extent to
which the citizens avoid unknown future situations can negatively influence the
performance outcomes of innovation. Conversely, the extent of acceptance of
new/different ideas, and innovative products/processes, can positively influence
performance outcomes of technological innovation. Higher the value on this dimension,
lower is the degree of discomfort of the nation’s culture with uncertainty. Becheikh et al.
(2006) found that cultures ranking low in UAI were overall more innovative. Given that
innovation is the implementation of new and challenging ideas with uncertain outcomes, it
is posited that firms would perform better if they are based in cultures that do not shy away
from delving in innovative projects that don’t have predictable outcomes. This leads to the
final hypothesis H5.
Hypothesis 5. The lower the degree of uncertainty avoidance in a nation, the stronger the
relationship between technological innovation and firm performance.
Figure 2.1 presents the proposed model, and its hypothesized relationships.
2.3 Data and Methodology
The methodology of Meta-Analysis (MA) is one of the many ways to summarize, interpret,
18
relationship(s) (Lipsey and Wilson, 2001). MA can greatly aid in bringing one closer to the
‘true’ relationship between constructs of interest compared to a single primary study. and
in turn promote theory building (Hunter and Schmidt, 2004; Lipsey and Wilson, 2001). It
becomes a fitting technique for our research because our purpose is to integrate the mixed
findings on technological innovation→ performance link while also testing for cou
ntry-level moderating effects.
Figure 2.1. Proposed Technological Innovation and Firm PerformanceModel
Two different sets of meta-analytic techniques were utilized for the analysis. To
test the first hypothesis H1, the Hedges and Olkin-type meta-analysis technique
(commonly referred to as HOMA) (Hedges et al., 1985) was applied. HOMA computes the
meta-analytic mean effect-size for the focal relationship, its standard deviation, and the
corresponding confidence interval. The HOMA technique allows the use of both the
fixed-effects model and the random-fixed-effects model. Since, the effect-size distribution for the focal
relationship is assumed to be heterogeneous, the random-effects model was chosen instead
of the fixed-effects model. The random-effects HOMA model corrects for both sampling
19
random-effects model is (a) more conservative than fixed-effects model, and (b) favored
over a fixed-effects model in current MA practices (Heugens et al., 2009; Raudenbush et
al., 2002; Van Essen et al., 2012). If the effect-size distributions are homogenous, both
models produce comparable results.
To test for hypotheses H2-H5, Meta-Analytic Regression Analysis, (referred to as
MARA) (Lipsey and Wilson, 2001) was applied. MARA uses a weighted least-squares
(WLS) regression model in which the dependent variable is the observed effect size for the
focal relationship. MARA helps to fill in the gap on the causes of heterogeneity in the
effect-size distribution by testing for two types of moderating effects: (a) methodological
artifacts that cause the observed effect size to differ from the actual effect size, and/or (b)
new/external moderating variables that were not part of any of the studies comprising the
study sample. Both the methodological artifacts and external moderators (CII, PPI, IDV
and UAI) were included to conduct MARA.
Like HOMA, one can choose between a fixed-effects model and a mixed-effects
model to run MARA. A fixed-effects model assumes that all between-study differences
can wholly be attributed to systematic variance (captured by the newly-included
moderators) and subject-level sampling error. A mixed-effects model assumes the same,
but also considers a third random component that is either unmeasured or even
immeasurable. A mixed-effects model has a lower Type-1 error rate, and offers more
conservative results (Geyskens et al., 2009). Again, the mixed-effects model was used for
20
To conduct the entire meta-analysis, starting from study selection to analyzing
coded data, the instructions laid out by Lipsey and Wilson in their book (Lipsey and
Wilson, 2001) were followed, and referred to as the LW procedure for the rest of the paper.
2.3.1 Study Selection
To assess the research model, a sample frame was established by collecting empirical
studies that theorize and measure the focal relationship. This effort included carefully
examining Google scholar, web of science, EBSCO, and JSTOR databases, and filtering
studies using search terms including but not limited to “performance”, “innovation”, “R&D
expenditure”, “patent”, “new product introduction”, “technological innovation”, “product
innovation”, “process innovation”, “innovation award”, “innovation survey.” Thirteen
journals were screened for relevant papers. In addition to Management Science (MS),
Academy of Management Journal (AMJ), Strategic Management Journal (SMJ), Research
Policy (RP), and Journal of Product Innovation Management (JPIM) that comprise the top
five most-cited journals to publish innovation-related research (Crossan, 2010), this journal
list included Journal of Operations Management (JOM), Productions and Operations
Management (POM), Decision Sciences (DS), International Journal of Operations and
Production Management (IJOPM), International Journal of Production Economics (IJPE),
Journal of Business Venturing (JBV), International Journal of Business (IJB), and Journal
of Management Studies (JMS). In addition, Zhang et al. (2012) provide an excellent review
of innovation literature, and we were able to add two more papers to the sample from those
reviewed in their study.
Once the first set of research studies was accumulated, each paper was manually
21
included. Papers that were empirical in nature, and which provided all the information
needed to conduct meta-analysis, were shortlisted. Accordingly, conceptual papers,
qualitative papers, case studies and analytical-modeling papers were not considered. The
reference lists of papers were also screened to look for any other potentially relevant papers
that had not come up in the web search. This process resulted in a final sample of 28 studies.
This sample size is consistent with other published meta-analysis studies in operations
management and other fields (Gerwin and Barrowman, 2002; Mackelprang and Nair, 2010;
Nair, 2006). Appendix A.1 provides a summary of the list of studies.
2.3.2 Coding Procedure
Sufficient time and care was taken in evaluating each study. Both focal variables i.e.
technological innovation, and firm performance, have been conceptualized and
operationalized differently across research disciplines. Measures of performance gathered
from the collected sample comprised of both objective measures (for e.g., market measures
like Tobin’s Q and market share; and accounting measures like ROA and ROS), and
subjective measures (gathered from single-item or multi-item Likert-based survey data).
Similarly, measures of technological innovation also comprised of both objective measures
(secondary sources and/or economic data) and subjective measures (single-item or
multi-item Likert-based). All the different measures of performance and technological innovation
were included regardless of their type. This is in line with the current conventional practices
in meta-analytic studies (Carney et al., 2011; Gerwin and Barrowman, 2002; Hülsheger et
al., 2009; Van Essen et al., 2012). The type of operationalization of all variables
(performance, innovation, and control variables, if any) examined in each of the 28 studies
22
of operationalization used, collected studies also differed in other characteristics. For
example, majority of the studies have examined the focal relationship in the manufacturing
sector and collected cross-sectional data. Only two studies in the sample inspected panel
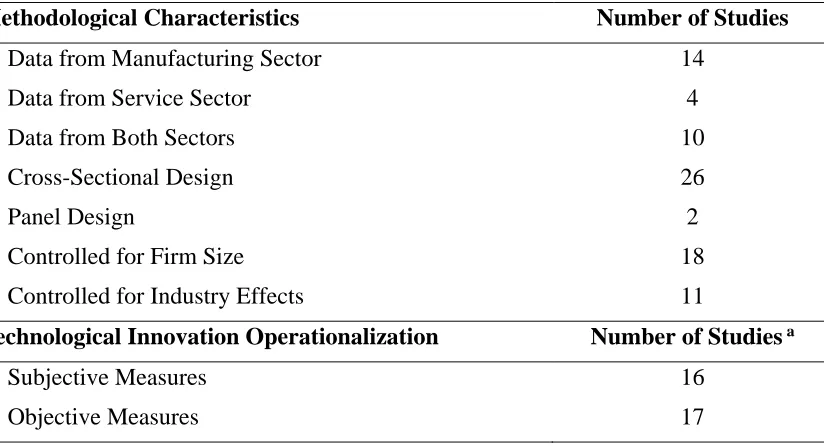
data. The descriptive statistics of the final sample are shown in Table 2.1.
Table 2.1. Descriptive Statistics of the Study Sample (N = 28)
Methodological Characteristics Number of Studies
Data from Manufacturing Sector 14
Data from Service Sector 4
Data from Both Sectors 10
Cross-Sectional Design 26
Panel Design 2
Controlled for Firm Size 18
Controlled for Industry Effects 11
Technological Innovation Operationalization Number of Studies a
Subjective Measures 16
Objective Measures 17
Note. a Some researchers have used more than one type of measure in their study. Hence, the total
number of studies adds up to a number greater than the study sample of 28 papers.
To test for H1, effect sizes between all variables (dependent, independent and
control variables, if any); their significance test values (these can be t-statistics, z-value,
and/or p-value); and sample sizes from each of the 28 studies were coded. The LW
procedure uses a statistically standardized ‘effect size’. In other words, the effect-size
statistic standardizes findings across studies such that they can be directly compared
(Lipsey and Wilson, 2001). If a study contained multiple measurements of the focal
relationship, for e.g. Heeley et al. (2007), all measurements from that study were included
23
used as the effect-size statistic (Carney et al., 2011; Heugens et al., 2009; Van Essen et al.,
2012). Since meta-analysis focuses on both the direction and magnitude of the effects
across studies, and not on statistical significance, both significant and insignificant effect
sizes from each paper in the study sample were included to reduce bias in outcomes (Lipsey
and Wilson, 2001). This approach is also consistent with previous meta-analytic studies
(Carney et al., 2011; Gerwin and Barrowman, 2002; Heugens and Lander, 2009;
Mackelprang and Nair, 2010). The words ‘effect size’ and ‘correlation’ are used
interchangeably hereafter.
Both bivariate (Pearson Product-Moment) correlations and partial correlations were
included as effect sizes (Geyskens et al., 2009; Lipsey and Wilson, 2001; Van Essen et al.,
2012). It must be noted that partial correlation is an unbiased, scale-free, linear estimate of
association that also renders the capability to detect model misspecification and is the more
commonly used effect size. Using partial correlations makes it possible to include studies
with missing effect-size data since it can be directly computed from the regression output.
Not all studies embodied both types of correlations in the study sample. Therefore, to
ensure that each study was represented in the analysis, the data from both types of
correlations was aggregated (Mor Barak et al., 2009). In total, 132 effect sizes were
obtained from the 28 studies in the sample, out of which 87 were partial correlations, and
45 were bivariate correlations.
To control for skewness in the effect-size distribution, all effect sizes were
transformed to a Fisher Z-transform (Hedges et al., 1985) before being used in the analysis.
This transformation ensured that all effect-size values were now relatively closer to a
24
weight, denoted by w (Hedges et al., 1985). The sample size (N) of each study was used to
weight the effect size obtained from that study, so that studies using a larger dataset carry
more weight than those using a smaller dataset.
To test H2-H5, four new moderating variables were proposed in this study, and the
data for them was extracted from independent sources. The first moderator called ‘Credit
Information Index (CII)’ is used as a proxy for capital-market regulation to test H2. The
second moderator called ‘Patent Protection Index (PPI)’ is used as a proxy for strength of
patent protection in a nation and is used to test H3. The third moderator variable, called
‘Individualism vs. Collectivism (IDV)’ measures the degree of individualism in a nation
and is used to test H4. The fourth moderator variable, called ‘Uncertainty Avoidance (UAI)’
measures the degree of discomfort with uncertain situations of a national culture and is
used to test H5. To control for multi-collinearity, all four moderators were orthogonalized
before conducting MARA.
Next, it also needs to be determined if the heterogeneity in the effect-size
distribution is influenced by the design and methodology employed by the studies (Lipsey
and Wilson, 2001). Based on the varying methodological characteristics of the 28 studies,
five methodological moderating variables were created. Two dummy variables were
created to capture if study used only manufacturing-industry data or only service-industry
data, or data from both industries (10=manufacturing industry data, 01=service industry
data). The following characteristics were also included as dummy variables: (1) use of
cross-sectional data or panel data, (2) controlled for firm size or not, and (3) controlled for
industry effects or not. Table 2.2 provides a description of all the moderating variables that
25
Table 2.2. Description of the Moderating Variables
Moderators Description
Credit Information Index (CII)
CII measures rules affecting the scope, accessibility, and quality of credit information available through either public or private credit registries. The index ranges from 0 to 6, with higher values indicating the availability of more credit information. CII scores were obtained from World Bank’s Doing Business database-http://www.doingbusiness.org.
Patent Protection Index (PPI)
PPI measures the strength of patent protection in a nation. It is an unweighted sum of scores along five dimensions: (1) extent of coverage of inventions that are considered patentable, (2) membership in international patent treaties, (3) duration of protection, (4) enforcement mechanisms, and (5) restrictions on patent rights. The index ranges from 0 to 5, with higher values indicating stronger protection. PPI scores were obtained from Ginarte and Park (1997) and Park (2008).
Individualism (IDV)
IDV measures the degree of individualism of a nation. IDV dimension scores were obtained from http://geert-hofstede.com/
Uncertainty Avoidance (UAI)
UAI measures the degree of discomfort with uncertainty and ambiguity. UAI dimension scores were obtained from http://geert-hofstede.com/
Methodological
Variables Description
Manufacturing Industry Data
Dummy variable coded as 1 if study examined only manufacturing industries.
Service Industry Data
Dummy variable coded as 1 if study examined only service industries.
Study Design Dummy variable coded as 1 if study used cross-sectional design.
Firm Size Dummy variable coded as 1 if study controlled for firm size.
Industry Effects Dummy variable coded as 1 if study controlled for industry effects.
2.4 Analysis and Results
The STATA macros provided by Lipsey and Wilson were used for the analysis (Wilson,
26
technological innovation (H1 results) is evaluated, followed by a discussion of the
moderation effects on the focal relationship (H2-H5 results).
2.4.1 Results for Hypothesis 1
HOMA is run to test H1, and the corresponding results shown in Table 2.3 indicate a
positive and significant relationship between technological innovation and firm
performance. So H1 is supported. The mean of the relationship is 0.1 and is statistically
significant with a p-value < 0.001, also the 95% confidence interval does not include zero.
The effect size is in the small-to-medium range (Cohen, 1992), thus implying that
technological innovation tends to positively but moderately influence firm performance.
These findings need to be investigated further to evaluate if the strength of the focal link is
heterogenous. To do so, the Cochran’s (1954) Q test of homogeneity was performed, along
with calculating the I2 index. The Q-test value is 2985.1 and is statistically significant with
a p-value <0.001. The I2 index measures the degree of homogeneity, and a value > 0.75
indicates a high level of heterogeneity. The value of I2 implies that the effect-size
distribution is substantially heterogeneous. Therefore, it is worthwhile to examine next how
much of this observed heterogeneity is accounted for by the moderators.
Table 2.3. Results of HOMA (Hypothesis 1)
Focal Relationship N k Mean ρ S.E. Q test I2
Technological Innovation
to Firm Performance 102,519 132 0.099**** 0.016 2985.1*** 95%
Note. N= total sample size; k= no. of effect sizes; mean ρ=estimate of population correlation; S.E.=
standard error of mean ρ; Q= Cochran’s homogeneity test statistic; I2= scale-free index of
27
2.4.2 Results for Hypotheses 2-5
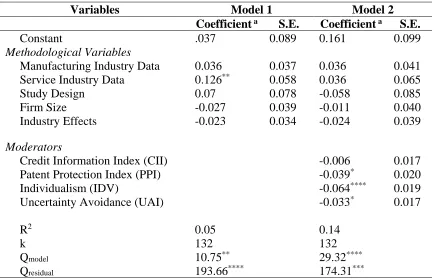
MARA was run to test H2-H5 with two different regression models as shown in Table 2.4.
Model 1 includes only the methodological variables. Model 2 represents the full model that
includes both sets of variables described in Table 2.2. Three statistics indicate the model
fit: (1) the R2 value, (2) the Q
model value, which represents the variance explained by the
regression model, and (3) the Qresidual value, which represents the variance left unexplained
by the model.
Table 2.4. Results of MARA (Hypothesis 2-5)
Variables Model 1 Model 2
Coefficient a S.E. Coefficient a S.E.
Constant .037 0.089 0.161 0.099
Methodological Variables
Manufacturing Industry Data 0.036 0.037 0.036 0.041
Service Industry Data 0.126** 0.058 0.036 0.065
Study Design 0.07 0.078 -0.058 0.085
Firm Size -0.027 0.039 -0.011 0.040
Industry Effects -0.023 0.034 -0.024 0.039
Moderators
Credit Information Index (CII) -0.006 0.017
Patent Protection Index (PPI) -0.039* 0.020
Individualism (IDV) -0.064**** 0.019
Uncertainty Avoidance (UAI) -0.033* 0.017
R2 0.05 0.14
k 132 132
Qmodel 10.75** 29.32****
Qresidual 193.66**** 174.31***
Note. a Unstandardized regression coefficients; k= no. of effect sizes; Q= Cochran’s homogeneity test
statistic; * p-value<0.1, ** p-value<0.05, *** p-value<0.01, **** p-value<0.001
As per Table 2.4, the R2 value increased from Model 1 (0.05) to Model 2 (0.14).
Both models fit the data reasonably well, and the fit improves when moving from one
model to the next. The Qmodel value increased from Model 1 (Q=10.75; p-value<0.05) to
28
the heterogeneity well. The Qresidual value decreased from Model 1 (Q=193.66;
p-value<0.001) to Model 2 (Q=174.31; p-value<0.01) but remains significant. This implies
that even though Model 2 fits reasonably well, the included moderators do not ‘fully’
capture the heterogeneity in the effect-size distribution. Hence, additional moderators need
to be tested to account for the leftover heterogeneity.
Further examination of the MARA results in Table 2.4 reveals that only three out
of four moderators: PPI, IDV, and UAI are statistically significant. First, in looking into
the moderating role of a capital market regulatory-type institutional context, results show
that CII does not drive the focal relationship (p>0.1). Furthermore, CII has a negative
moderating effect, contrary to what was hypothesized. Hence, H2 is not supported. This
was a surprising result. Numerous studies have shown a correlation between financial
development (characterized by well-developed capital market) of a nation and firm
performance for the simple reason that firms need ‘access to finance’ (Claessens and
Tzioumis, 2006). This correlation is even more pertinent to innovative firms since
innovation necessitates high investment costs. A possible explanation for the
counter-intuitive result is that, availability of credit information is not the only factor behind
ensuring that firms in fact do get timely access to finance. So even in the presence of
transparency and availability of information about borrower firms (as reflected by a high
value of CII), a lender might still deny the loan for the following reasons. First, studies
have shown that innovation-related investments are treated differently than regular
investments because of the associated risks and unpredictable returns (Hall, 2010).
Furthermore, most of the innovation investment is spent on intellectual capital (which is
29
uncertainty of returns from the innovation-related investment (Hall, 2010). Recent
literature has shown that access to credit is different for innovative firms vs. that of
non-innovative firms (Bellucci et al., 2014; Hall, 2010). This is further complicated by whether
the firm is a start-up or an incumbent (Bellucci et al., 2014; Hain and Christensen, 2013).
Another possible explanation as to why the results here do not reconcile with extant
research is omitted-variable bias. It is possible that the results reflect the omission of
firm-level characteristics from the model like firm growth over time and/or firm assets, both of
which can influence a lender’s decision in giving out credit. In brief, the intrinsic nature of
innovation coupled with past firm innovation-related outcomes might take precedence over
the availability of credit information when it comes to lending decisions. And the direction
of the relationship is potentially being influenced by these omitted variables.
Second, results indicate that the strength of patent protection (PPI) does
significantly moderate (p-value=0.054) the focal relationship however not as hypothesized.
Hence, H3 is only partially supported. This result runs contrary to the basic assumption
that incentives drive firm actions as well as what numerous previous studies have shown,
that PPI has a positive impact on innovation (Chen and Puttitanun, 2005; Lerner, 2009;
Varsakelis, 2001). A possible explanation for this is that even though patenting provides a
firm ownership over its inventions, it also publicizes a firm’s internal intellectual capital.
A study by Cohen et. al (2000) discussed how competitors can work around the patent until
its expiry, after which they can go ahead and use the patent. This behavior discourages the
innovating firm to patent their inventions. Second, Pisano (2006) has argued that the impact
of patent protection on the ‘rate and direction’ of innovation and its outcomes is more
30
is dependent on the ‘appropriability regime’ in which the firm operates. The
appropriability regime in a nation is a combination of the strength of patent protection as
well as the ease of imitability. Firms may not choose to patent their inventions it they don’t
deem imitation to be a concern. Also, given that the primary motivation of a firm is to
maximize its financial returns from an innovative product, firms today are following an
alternate strategy of intentionally sharing their proprietary knowledge as long as the
receiver does not appropriate it. Additionally, Lerner (2009), also found strengthening of
the patent protection framework to negatively impact innovation. Hence, in the current age
of technological advancements, the legal framework of patent protection is perhaps
becoming more of a deterrent when firms are moving away from patenting their inventions.
In terms of the moderating role of national culture, both IDV and UAI negatively
moderate the influence of technological innovation on firm performance. Hence, both H4
and H5 are fully supported. Result for H4 implies that firms based in highly individualistic
cultures (or higher value of IDV) tend to experience lower performance outcomes from
technological innovation. This result indicates that fostering collaboration and
communication among employee groups as well as giving precedence to the team-level
success instead of to individual freedom and accomplishment can promote better
innovation-related outcomes. Similarly, firms based in nations having a higher value of
UAI also tend to experience lower performance outcomes with technological innovations.
In other words, firms whose employees do not pull back from uncertain and ambiguous
31
2.4.3 Results for Methodological Variables
Results for the effect of methodological variables on the focal relationship is presented in
Table 2.4. Overall, none of the methodological variables were significant. In Model 1, only
‘Service Industry Data’ was positive and statistically significant with a p-value <0.05.
However, it turned insignificant after inclusion of the four main moderating variables.
Finally, the temporal design of the study, controlling for firm size, and controlling for
industry-level effects, also did not impact the focal relationship.
2.4.4 Robustness Test
The objective measures of technological innovation were separated from the subjective
measures, and HOMA was run separately for both categories. This was done to assess if
the overall results were independent of the way technological innovation was
operationalized. Table 2.5 shows the breakdown of these results, which indicate that even
though the direction of the focal relationship remains unaffected by the type of measure
used for technological innovation, the strength of the focal relationship does get affected.
Table 2.5. Robustness Test
Technological Innovation
Operationalization N k Mean ρ S.E. Q test I
2
Subjective Measures 16,508 46 0.195**** 0.008 628.77*** 93%
Objective Measures 86,011 86 0.056**** 0.018 2337.85*** 96%
Note. N= total sample size; k= no. of effect sizes; mean ρ=estimate of population correlation; S.E.=
standard error of mean ρ; Q= Cochran’s homogeneity test statistic; I2= scale-free index of
heterogeneity; * p-value<0.1, ** p-value<0.05, *** p-value<0.01, **** p-value<0.001
The focal relationship is positive and statistically significant (p-value <0.001) for