University of South Carolina
Scholar Commons
Theses and Dissertations
2018
Fundamental Aspects Of A Novel Technology For
Abatement Of Indoor Allergens
Odell Lendor Glenn Jr. University of South Carolina
Follow this and additional works at:https://scholarcommons.sc.edu/etd
Part of theChemical Engineering Commons
This Open Access Dissertation is brought to you by Scholar Commons. It has been accepted for inclusion in Theses and Dissertations by an authorized administrator of Scholar Commons. For more information, please [email protected].
Recommended Citation
FUNDAMENTAL ASPECTS OF A NOVEL TECHNOLOGY FOR ABATEMENT OF INDOOR ALLERGENS
by
Odell Lendor Glenn Jr.
Bachelor of Science
State University of New York at Stony Brook, 1991
Master of Science
New Jersey Institute of Technology, 1993
Master of Science
New Jersey Institute of Technology, 2003
Submitted in Partial Fulfillment of the Requirements
For the Degree of Doctor of Philosophy in
Chemical Engineering
College of Engineering and Computing
University of South Carolina
2018
Accepted by:
Michael A. Matthews, Major Professor
Melissa A. Moss, Committee Member
Sean R. Norman, Committee Member
Sirivatch Shimpalee, Committee Member
Mark J. Uline, Committee Member
ii
iii
DEDICATION
This dissertation is dedicated to allergy sufferers, their families and caregivers. My
iv
ACKNOWLEDGMENTS
“I will instruct thee and teach thee in the way which thou shalt go: I will guide thee
with mine eye.” Psalms 32:8 (KJV)
I am overwhelmingly thankful to my Lord and Savior Jesus Christ for directing my
career path as well as providing me with a measure of faith to keep focused on a path less
taken. Words cannot express how thankful I am to have had the opportunity to embark
upon research as a non-traditional graduate student while at the same time serve as primary
caregiver for two aged parents and provide ministry to parishioners. Thank You for giving
me the grace to persevere and to complete the process. Thank You for providing an
opportunity through research to potentially touch the lives of asthma sufferers. I love what
You do through me. If I had 1000 tongues, I could not thank You enough.
To my loving parents, Odell Lendor Glenn Sr., and Sara Vermae Ables-Glenn, I
love you dearly. Both of you have always encouraged me in every endeavor of my life.
Thank you for understanding my uniqueness and always believing in me. I sincerely thank
you for entrusting me with your care in your latter years. You are both an inspiration and
a joy and are loved dearly.
To my advisor, Dr. Michael A. Matthews, I am especially thankful to you for
allowing me to work in your laboratory and work alongside CarboNix. It has been a
wonderful experience. You have expanded my technical knowledge base in ways
v
mechanics, biochemistry, statistics, Computational Fluid Dynamics (CFD) and
ENDNOTE software which has made me a more versatile educator. As I prepare myself to
teach the next generation of S.T.E.M students, skill sets gathered from research will
simultaneously transfer and I hope to become a much more effective educator. I came into
the department with an educational focus but left with so much more! My passion for
essential oil research has only heightened itself. It has also been a pleasure serving as your
teaching assistant with you for “ECHE 311” for 2 years as well as the many students I have
mentored as a graduate student along the way. I am honored to have met you, your family
as well as the CarboNix team. Thank you for introducing as well as allowing room for me
to network with some of the top researchers in supercritical fluids and engineering
education across the country.
Special thanks to Dr. Milo Koretzky. The one-year graduate experience with you
has literally changed my entire perspective on teaching and learning. Our research meetings
regarding education as well as conceptual exams incorporated in the class will be
implemented into my classroom.
Special thanks to each of my committee members. Dr. Melissa Moss for your
advice on biochemistry, assays and allergenic proteins. Thanks for personally showing up
at my poster session at the AIChE meeting in 2016. It meant a lot. Dr. Mark Uline, I
appreciate your mentorship and concern regarding my progress. It spoke volumes. Dr. Sean
Norman, I enjoyed your graduate level course in Microbiology and your public health
perspective into the research. Dr. Sirivatch Shimpalee, thank you for mentoring me and
affording the opportunity to learn 4 different versions of STAR CCM+. I hope to utilize
vi
advisor on the committee. Your words of encouragement gave me hope. Special thanks to
Diane Gooding (and the cats), for providing your home as a source to gather research data.
A special thanks to Carol Stork for your expertise with analytical chemistry as well as being
a friend in person and through social media. Special thanks to the Mass Spectrometer
Center in the Department of Chemistry and Biochemistry. To Dr. Ed Gatzke, serving along
with you as a Gamecock toastmaster president for two years has been amazing. My
confidence as a public speaker has matured in so many ways. This group has literally
inspired me to write a book on “caregiving”. The radio interviews and the public speaking
opportunities that I now get speaks volumes about our Gamecocks toastmaster club on
campus. I have been inspired beyond words.
To Dr. Johnnie McFadden, I have truly admired your many achievements and
accomplishments. Thank you for selecting me as one of the Carolina Diversity Professors
Program (CDPP) scholars. Each workshop, social event, conference and opportunity to
network provided a springboard upon which to cultivate my career. Thank you for
providing opportunities and funding to complete my degree. It was indeed an honor to
serve as the community outreach representative for the last 2 years of my tenure as a
graduate student.
To. Dr. Wayne Carver, thank you for providing funding from the South Carolina
INBRE grant. Each conference that I attended was well worth the trip. Thank you for
consistently checking up on me to track progress during the journey.
To Dr. Lauren Clark, thank you for providing opportunities for me to serve at local
vii
fellowship recipient. Our lunches during semesters were enlightening. Thank you also for
your friendship.
To Dr. John Weidner, Dr. Jed Lyons, Dr. Jamil Khan and Dr. Mohammad Hailat,
special thanks to each of you all for your guidance, networks, and mentorship towards
becoming an instructor at The University of South Carolina with future aspirations in
engineering education research. Thank you all for providing me the opportunity to teach
undergraduate courses during my last year of graduate school with anticipated employment
afterwards. Special thanks to the entire staff in the department of chemical engineering at
the university and all of your support.
Special thanks to additional funding provided by The National Institute of Health
(NIH), The Alfred P. Sloan Foundation Fellowship and the GEM Fellowship. I am grateful
and honored to have been funded through these national organizations as well as the
SPARC grant from the university. Special thanks also to STAR CCM+ version 9.06.011
for extended licensing service provided by CD-Adapco. Special thanks to Indoor
Biotechnologies, in Charlottesville, Virginia for MARIA analysis.
Last, but certainly not least, special thanks family, friends, churches, non-profit
organizations, social media friends and acquaintances for words of encouragements and/or
viii
ABSTRACT
The overall goal of this research was to develop a novel approach to reduce the
potency of certain asthma triggers, namely, proteins produced by pests or pets in indoor
environments. The broad hypothesis of the research was that naturally occurring essential
oils will demonstrate enhanced denaturing ability. In any indoor environment, allergens are
bound to dry dust particles. In this work, the effectiveness of using dry ice and CO2 with
potential for essential oils on dry allergenic proteins through CFD modeling and ELISA
methods were evaluated.
There are three objectives central to this work. The first objective was to apply
engineering principles through computational fluid dynamic (CFD) modeling on a Coanda
spray nozzle. A Coanda nozzle can be used to produce a high velocity mixture of air,
gaseous CO2, and dry ice particles from a supply of liquid CO2. Such a process is effective
(for instance) for residue-free rapid cooling or precision cleaning. A thermodynamic and
computational fluid dynamics analysis of this flow is presented for the purposes of
optimizing and modeling the process parameters, which includes the temperature of the
liquid CO2 supply, the flow rate, and the pressure, nozzle, and air configurations. The
proposed design will result in a new intervention strategy for asthma sufferers and their
doctors, in the form of a home allergen abatement service. The allergen abatement process
is based on current technology. The abatement uses a concurrent spray nozzle composed
ix
mounted inside a specially-designed vacuum clear head, which instantly collects both the
dislodged particles as well as the CO2 as it sublimes from solid to gas. Upon vacuuming
via the concurrent spray of air and dry ice, higher levels of dust are dislodged over
conventional vacuuming. The research presented in this dissertation employs CFD
simulations that model the spray geometry and process characteristics of a Coanda nozzle.
The CFD model generates microscopic details of the fluid including the velocity, direction,
flow rate, pressure, nozzle diameter and temperature as a function of air and CO2.
The second objective was to determine solubility data over a range of temperature
and density for the most dominant components in three essential oils as a function of
temperature and density in both liquid and supercritical CO2. As a continuation from the
first objective, we employed essential oils within the “dry-clean” process to prevent
re-infestation. We have every reason to believe that essential oils and CO2 are soluble to do
them being nonpolar however, there are some data suggesting that the solubility of the most
abundant component of essential oils in supercritical CO2, there are no known data
available on the solubility of the most abundant component in tea tree oil, cedar wood oil
and hinoki oil at temperature ranges from 25°C to 60°C and density ranges from 0.2 g/mL
to 0.7 g/mL. These oils are each a mixture of several chemical species, which greatly
complicates the measurement of solubility. To address this, gas chromatography/mass
spectrometry were employed to identify the major component on each oil.
The last objective of this work tested an essential oil’s ability to inactivate
allergenic proteins on two well-known indoor allergens, Fel d 1 (cat) and Der f 1 (dust
mite). This research addresses whether essential oils alone are able to deactivate the
x
Mutliplex Array for Indoor Allergens (MARIA) is the primary analytical tool for
xi
TABLE OF CONTENTS
DEDICATION... iii
ACKNOWLEDGMENTS ... iv
ABSTRACT ... viii
LIST OF TABLES ... xvi
LIST OF FIGURES ... xix
LIST OF SYMBOLS ... xxiv
LIST OF ABBREVIATIONS ... xxvii
CHAPTER 1: INTRODUCTION ... 1
1.1 ASTHMA STATISTICS ... 1
1.2 CAUSES OF AN ASTHMA ATTACK ... 2
1.3 ASTHMA PREVENTION ... 3
1.4 ROLE AND STRUCTURE OF ALLERGENIC PROTEINS THAT TRIGGER ASTHMA ... 4
1.5 STRUCTURAL CHARACTERIZATION OF PROTEINS ... 7
1.6 ESSENTIAL OILS... 8
1.7 PATENTS AND OTHER RESEARCH ON ESSENTIAL OILS ... 13
CHAPTER 2: MULTI-PHASE MATHEMATICAL MODELING OF COMPRESSED CO2 EXPANSION THROUGH A COANDA NOZZLE ... 16
2.1 MOTIVATION ... 16
2.2 LITERATURE REVIEW ON CFD MODELING ... 20
2.3 NOVEL TECHNOLOGY ON THE “SPRAY FREEZE PROCESS” ... 23
xii
2.5 CFD MODEL DESCRIPTION ... 27
2.6 NUMERICAL PROCEDURE ... 32
2.7 THE EFFECT OF INLET NOZZLE TEMPERATUE ON 1-X2 ... 35
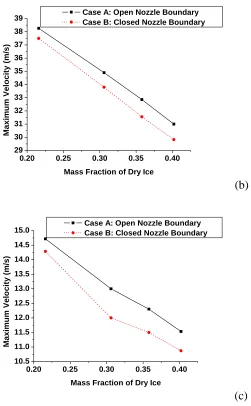
2.8 THE EFFECT OF 1-X2 ON MAXIMUM VELOCITY... 37
2.9 THE EFFECT OF 1-X2 ON DISPERSE ANGLE ... 40
2.10 DRY ICE PARTICLES EXITING THE COANDA NOZZLE AT 1-X2=0.216 AT THE INLET NOZZLE TEMPERATURE AT 30°C ON OPEN AND CLOSED NOZZLE BOUNDARY ... 44
2.11 DRY ICE PARTICLES EXITING THE COANDA NOZZLE AT 1-X2=0.306 AT THE INLET NOZZLE TEMPERATURE AT 20°C ON OPEN AND CLOSED NOZZLE BOUNDARY ... 45
2.12 DRY ICE PARTICLES EXITING THE COANDA NOZZLE AT 1-X2=0.358 AT THE INLET NOZZLE TEMPERATURE AT 10°C ON OPEN AND CLOSED NOZZLE BOUNDARY ... 47
2.13 DRY ICE PARTICLES EXITING THE COANDA NOZZLE AT 1-X2=0.402 AT THE INLET NOZZLE TEMPERATURE AT 0°C ON OPEN AND CLOSED NOZZLE BOUNDARY ... 51
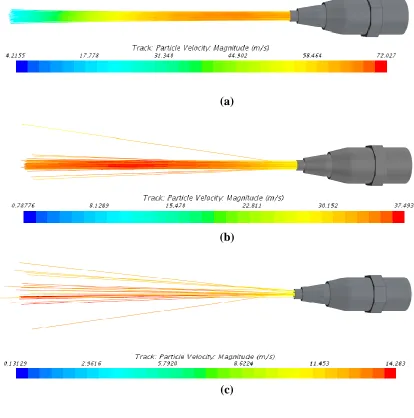
2.14 TRACK PARTICLE VELOCITY AND DISPERSE ANGLE PROFILE FOR a)10μm b)100μm and c)1000μm ... 53
2.15 TEMPERATURE DISTRIBUTION ON CLOSED AND OPEN NOZZLE BOUNDARIES AT 1-X2=0.358 ... 55
2.16 VELOCITY VECTOR AND VELOCITY MAGNITUDE ON THE OVERALL MIXTURES OF CO2 VAPOR AND AIR AT 1-X2=0.358 ... 58
2.17 MASS FRACTION OF AIR AND CO2 ON AN OPEN NOZZLE BOUNDARY ... 59
2.18 MASS FRACTION OF AIR AND CO2 ON A CLOSED NOZZLE BOUNDARY ... 60
2.19 NEW KNOWLEDGE FROM MULTI-PHASE MODELING THROUGH A NON-ADJUSTABLE COANDA NOZZLE ... 61
CHAPTER 3: PHASE EQUILBIRIUM OF MAJOR COMPONENTS OF ESSENTIAL OILS IN LIQUID AND SUPERCRITICAL CARBON DIOXIDE .... 63
xiii
3.2 LITERATURE REVIEW ON SOLUBILITY METHODS ... 64
3.3 GAS CHROMATOGRAM AND MASS SPECTRUM OF TEA TREE OIL………67
3.4 GAS CHROMATOGRAM AND MASS SPECTRUM FOR CEDARWOOD OIL ... 70
3.5 GAS CHROMATOGRAM AND MASS SPECTRUM FOR HINOKI OIL………72
3.6 CRITICAL CONSTANTS AND ACENTRIC FACTOR ... 74
3.7 BINARY INTERACTION PARAMETERS ... 76
3.8 MODIFIED EXTRACTOR DESIGN FOR DYNAMIC SOLUBILITY MEASUREMENT IN CO2 ... 80
3.9 UV-VIS ... 81
3.10 PENG ROBINSON EQUATION OF STATE ... 91
3.11 LIQUID AND SUPERCRITICAL CO2 ... 92
3.12 VALIDATION OF EXPERIMENTAL TECHNIQUE ... 92
3.13 SOLUBILITY OF TERPINEN-4-OL IN SUPERCRITCAL CO2 ... 93
3.14 SOLUBILITY OF α-CEDRENE IN LIQUID AND SUPERCRITCAL CO2 ... 94
3.15 SOLUBILITY OF α-PINENE IN LIQUID AND SUPERCRITCAL CO2………94
3.16 SOLUBILITY OF TERPINEN-4-OL AND PR-EOS ... 96
3.17 SOLUBILITY OF α-CEDRENE AND PR-EOS ... 98
3.18 SOLUBILITY OF α-PINENE AND PR-EOS ... 100
3.19 SOLUBLITY OF MAJOR COMPONENTS IN LIQUID CO2 ... 101
3.20 ESSENTIAL OIL AND MOST ABUNDANT COMPONENT COMPARISON ... 101
xiv
3.22 NEW KNOWLEDGE ON PHASE EQUILIBRIUM OF TERPENIN-4-OL, α-CEDRENE, α-PINENE IN LIQUID AND SUPERCRITICAL CO2 102
CHAPTER 4: DEACTIVATION OF ALLERGENIC PROTEINS WITH
ESSENTIAL OILS... 104
4.1 MOTIVATION ... 104
4.2 LITERATURE REVIEW ... 104
4.3 ENZYME LINKED IMMUNOSORBENT ASSAY TECHNOLOGY .. 107
4.4 EVAPORATION RATE OF ESSENTIAL OILS ... 109
4.5 PROTOCOL FOR TREATING WET DUST SAMPLES WITH ESSENTIAL OILS... 112
4.6 EFFECT OF ESSENTIAL OIL EXPOSURE ON ALLERGENIC PROTEINS ON WET DUST SAMPLES ... 118
4.7 EFFECT OF ESSENTIAL OIL EXPOSURE ON ALLERGENIC PROTIENS ON DRY DUST SAMPLES ... 119
4.8 NEW KNOWLEDGE ON ALLERGENIC PROTEIN DEACTIVATION WITH ESSENTIAL OILS ... 122
REFERENCES ... 123
APPENDIX A: GAS CHROMATOGRAM INSTRUCTIONS ... 128
APPENDIX B: CALIBRATION DATA ... 130
APPENDIX C: Tr1, Pr1, a AND b CONSTANTS AS A FUNCTION OF T AND P IN DETERMINING K12 VALUES FOR TERPINEN-4-OL ... 132
APPENDIX D: Tr1, Pr1, a AND b CONSTANTS AS A FUNCTION OF T AND P IN DETERMINING K12 VALUES FOR α-CEDRENE ... 134
APPENDIX E: Tr1, Pr1, a AND b CONSTANTS AS A FUNCTION OF T AND P IN DETERMINING K12 VALUES FOR α-PINENE ... 136
APPENDIX F: EXPERIMENTAL DATA FOR TERPINEN-4-OL... 138
APPENDIX G: EXPERIMENTAL DATA FOR α-CEDRENE ... 139
APPENDIX H: EXPERIMENTAL DATA FOR α-PINENE ... 140
xv
APPENDIX J: PENG ROBINSON Y2 FOR α-CEDRENE @ K12=0.110 ... 143
APPENDIX K: PENG ROBINSON Y2 FOR α-PINENE @k12 = 0.110 ... 145
APPENDIX L: ISCO-EXTRACTION INSTRUCTIONS ... 147
APPENDIX M: COOL CLEAN TECHNOLOGIES CHILAIRE PROCESS DESCRIPTION ... 149
APPENDIX N: OUTLET VELOCITY AT INLET TEMPERATURE OF 0°C .... 151
APPENDIX O: OUTLET VELOCITY AT INLET TEMPERATURE OF 10°C .. 152
APPENDIX P: OUTLET VELOCITY AT INLET TEMPERATURE OF 20°C ... 153
APPENDIX Q: OUTLET VELOCITY AT INLET TEMPERATURE OF 30°C .. 154
APPENDIX R: EVAPORATION RATE... 155
APPENDIX S: ELISA PROTOCOL FOR FEL D 1 ... 157
APPENDIX T: ELISA PROTOCOL FOR DER P 1 ... 159
APPENDIX U: PLATE READER INSTRUCTIONS ... 162
APPENDIX V: ELISA PLATE READER ABSORBANCE ... 163
APPENDIX W: INDOOR BIOTECHNOLOGIES DUST SAMPLE EXTRACTION PRODCEDURE ... 164
APPENDIX X: MASS SAMPLES IN MG SENT TO INBIO ON DRY DUST SAMPLE SET 1 ... 165
xvi
LIST OF TABLES
Table 1.1: Inhibitory effect of FCEO on the pro-inflammatory cytokine production in
RAW 264.7 cells ………..15
Table 2.1: ΔPmaximum=P1-PCO2sat(T) ... 26
Table 2.2:Operating conditions and parameters ... 33
Table 2.3: Energy balance on adiabatic nozzle at steady state at p1=6237.7 kpa (904.7 psia) ... 36
Table 2.4: Track particle velocity at 10µm on open and closed nozzle boundary ... 39
Table 2.5: Track particle velocity at 100µm on open and closed nozzle boundary ... 39
Table 2.6: Track particle velocity at 1000µm on open and closed nozzle boundary ... 40
Table 2.7: Disperse Angle at 100µm on Open and Closed Nozzle Boundary ... 43
Table 2.8: Disperse Angle at 1000µm on Open and Closed Nozzle Boundary ... 43
Table 3.1: Three most dominant components in tea tree oil ... 68
Table 3.2: α-cedrene Group Contribution ... 75
Table 3.3 PR-EOS Parameters ... 76
Table 3.4: Validation of k12 with d-limonene ... 77
Table 3.5: Binary interaction parameter as a function of temperature and pressure for terpinen-4-ol ... 77
Table 3.6: Binary interaction parameter as a function of temperature and pressure for α-cedrene ... 78
Table 3.7: Binary interaction parameter as a function of temperature and pressure for α-pinene ... 79
xvii
Table 3.10: Calibration data for α-cedrene at 290 nm ... 84
Table 3.11: Calibration data for α-pinene at 290 nm ... 86
Table 3.12: Mean and Standard Deviation Absorbance for terpinen-4-ol ... 88
Table 3.13: Mean and Standard Deviation for α-cedrene ... 89
Table 3.14: Mean and Standard Deviation Absorbance for α-pinene ... 90
Table 3.15: Component solubility at 60°c ... 96
Table 3.16: Solubility of terpinen-4-ol in supercritical CO2 at T= 40°C with PR-EOS ... 97
Table 3.17: Solubility of terpinen-4-ol in supercritical CO2 at T= 50°C with PR-EOS ... 97
Table 3.18: Solubility of terpinen-4-ol in supercritical CO2 at T= 60°C with PR-EOS ... 97
Table 3.19: Solubility of α-cedrene in supercritical CO2 at T= 40°C with PR-EOS ... 99
Table 3.20: Solubility of α-cedrene in supercritical CO2 at T= 50°C with PR-EOS ... 99
Table 3.21: Solubility of α-cedrene in supercritical CO2 at T= 60°C with PR-EOS ... 99
Table 3.22: Solubility of α-pinene in supercritical CO2 at T= 40°C with PR-EOS ... 100
Table 3.23: Solubility of α-pinene in supercritical CO2 at T= 50°C with PR-EOS ... 100
Table 3.24: Solubility of α-pinene in supercritical CO2 at T= 60°C with PR-EOS ... 100
Table 3.25: Experimental and PR prediction of solubility of major components of essential oils in CO2 in liquid CO2 ... 101
Table 3.26: Y2 comparison of essential oil with most abundant component at 50°C and 12.26 MPa ... 102
Table 3.27: Solubility characterization ... 103
Table 4.1: Efficacy of Eucalyptus oil formulations for killing dust mites (20) ... 106
xviii
Table 4.3: Evaporation rate over four days for mineral oil ... 110
Table 4.4: Evaporation rate over four days for tea-tree oil ... 110
Table 4.5: Evaporation rate over four days for cedar wood oil ... 110
Table 4.6: Evaporation rate over four days for hinoki oil ... 111
Table 4.7: Evaporation rate over four days for n-decane ... 111
Table 4.8: Evaporation rate over four days for tea-tree oil ... 111
Table 4.9: Evaporation rate over four days for cedar wood oil ... 112
Table 4.10: Evaporation rate over four days for hinoki oil ... 112
Table 4.11: Standard curve data for wet dust sample ... 114
Table 4.12: Effect of essential oil exposure on Fel d 1 ELISA response (μg of cat allergen / total gram on wet dust sample from plate reader 1 ... 118
Table 4.13: Effect of essential oil exposure on Fel d 1 ELISA response (μg of cat allergen / total gram on wet dust sample from plate reader 2 ... 118
Table 4.14: Effect of essential oil exposure on Fel d 1 ELISA response (μg of cat allergen / total gram on wet dust sample from INDOBIO ... 119
Table 4.15: Effect of essential oil exposure on Fel d 1 ELISA response (ug of cat allergen/total gram of dry sample dust) ... 119
Table 4.16: Statistical significance in reduction of Fel d 1 levels in dry dust for each treatment within subjects ... 120
Table 4.17: Effect of essential oil exposure on Fel d 1 ELISA response (ug of Fel d 1/total gram of dry sample dust) ... 121
Table 4.18: Effect of tea tree oil exposure on Der f 1 ELISA response ( ug of Der f 1/ total gram of dry sample dust) ... 121
Table 4.19: Statistical significance in reduction of Der f1 levels in dry dust for each treatment within subject. ... 122
Table C.1: Design Parameter for 273.15 K... 132
Table C.2: Design Parameter for 283.15 K... 132
xix
Table C.4: Design Parameter for 303.15K... 133
Table E.1:T=298.15 K ... 136
Table E.2: T = 313.15 K ... 136
Table E.3: T = 323.15 K ... 136
Table E.4: T = 333.15 K ... 137
Table R.1: Evaporation rate over four days for mineral oil ... 155
Table R.2: Evaporation rate over four days for tea-tree oil ... 155
Table R.3: Evaporation rate over four days for cedar wood oil... 155
Table R.4: Evaporation rate over four days for hinoki oil ... 156
Table V.1: Plate reader 1 ... 163
xx
LIST OF FIGURES
Figure 1.1: Structural characterization of the cat allergen, Felis domesticus 1 tetramer
(Kaiser et al., 2003) ... 5
Figure 1.2: Structure of Der p 1 allergen. Combination of both alpha helices and β-sheets (Meno et al., 2005) ... 6
Figure 1.3: Structure Characterization of Proteins (Institute, 2013) ... 8
Figure 1.4: A mite-chamber for testing acaricidal (Williamson, Priestley, & Burgess, 2007) ... 14
Figure 2.1:CarboNix truck ... 17
Figure 2.2: Technology for Allergen Abatement ... 18
Figure 2.3: CO2 Phase Diagram with Coanda spray nozzle ... 19
Figure 2.4: Coanda Nozzle and Operating Conditions ... 20
Figure 2.5: Dimensions of non-adjustable Coanda nozzle ... 22
Figure 2.6: Computational Domain and Meshing... 23
Figure 2.7: Closed Nozzle Boundary ... 25
Figure 2.8: Multi-Phase Mathematical Modeling ... 28
Figure 2.9: The effect of T1 on 1-x2 ... 36
Figure 2.10: The Effect of Dry Ice Mass Fraction on Maximum Velocity at Particle Size a) 10µm b) 100µm and c) 1000µm ... 38
Figure 2.11: The Effect of Dry Ice Fraction on Disperse Angle at Particle Size a) 10µm b) 100µm and c) 1000µm ... 42
xxi
Figure 2.13: Dry Ice Fraction = 0.216: Closed Boundary maximum velocity on dry ice particles at a)10µm b)100µm c)1000µm ... 45
Figure 2.14: Dry Ice Fraction = 0.306: Open Boundary maximum velocity on dry ice particles at a)10µm b) 100µm c) 1000µm ... 46
Figure 2.15: Dry Ice Fraction = 0.306: Closed wall maximum velocity on dry ice
particles at a)10µm b) 100µm c) 1000µm ... 47
Figure 2.16: Dry Ice Fraction = 0.358: Open Boundary Maximum Velocity on Dry Ice Particles at a)10µm b)100µm c)1000µm ... 48
Figure 2.17: Dry Ice Fraction = 0.358: Closed boundary Maximum Velocity on Dry Ice Particles at a) 10µm b) 100µm c) 1000µm ... 50
Figure 2.18: Dry Ice Fraction =0.402: Open Boundary Maximum Velocity on Dry Ice Particles at a) 10µm b)100µm c)1000 µm ... 52
Figure 2.19: Dry Ice Fraction =0.402: Closed Boundary Maximum Velocity on Dry Ice Particles at a) 10µm b)100µm c)1000 µm ... 53
Figure 2.20: 10µm Disperse Angle and Particle Track Velocity ... 53
Figure 2.21: 100µm Disperse Angle and Particle Track Velocity ………54
Figure 2.22: 1000µm Disperse Angle and Particle Track Velocity ... 55
Figure 2.23: Dry Ice Fraction = 0.358: Open Nozzle Boundary Temperature Distribution at a) 10µm b) 100µm c) 1000µm Particle Size ... 56
Figure 2.24: Dry Ice Fraction = 0.358: Closed Nozzle Boundary Temperature
Distribution a) 10µm b) 100µm c) 1000µm Particle Size ... 57
Figure 2.25: Dry Ice Fraction=0.358: Open Nozzle Boundary for Velocity Vector and Velocity Magnitude Of Overall Mixtures Between CO2 Vapor And Air at a) 10µm
b) 100µm and c) 1000µm particle size ... 58
Figure 2.26: Dry Ice Fraction=0.358: Closed Nozzle Boundary for Velocity Vector and Velocity Magnitude Of Overall Mixtures Between CO2 Vapor and Air a) 10µm b)
100µm and c) 1000µm particle size ... 59
Figure 2.27: Mass fraction of Air and CO2 vapor on an Open Nozzle Boundary ... 60
Figure 2.28: Mass fraction of Air and CO2 vapor on a Closed Nozzle Boundary ... 61
xxii
Figure 3.2: Stages of solubilization process of essential oil sample in carbon dioxide at constant temperature and pressure (CARDOZO-FILHO et al., 1997) ... 64
Figure 3.3: Predicted solubility of orange essential oil in CO2 according to PR and SRK
equations of state (CARDOZO-FILHO et al., 1997) ... 65
Figure 3.4: Pressure dependence of solubility of pure terpenes α-pinene, 1, 8-cineole and limonene at 40 and 60°C (Francisco & Sivik, 2002) ... 66
Figure 3.5: Pressure dependence of solubility of mixtures of pure terpenes CL, CP, and CPL at 40 and 60ºC.(Francisco & Sivik, 2002) ... 67
Figure 3.6: Gas Chromatogram for Tea Tree Oil ... 68
Figure 3.7: Mass Spectrum for Terpinen-4-ol (Adams, 2007). ... 69
Figure 3.8: Terpinen-4-ol structure (Isman, 2000) ... 69
Figure 3.9: Gas chromatogram for cedar wood oil ... 70
Figure 3.10: Mass Spectrometry for cedar wood oil (Adams, 2007)... 71
Figure 3.11: α-cedrene Structure (Jaoui, Kleindienst, Docherty, Lewandowski, &
Offenberg, 2013) ... 71
Figure 3.12: Mass Chromatogram for Hinoki Oil ... 72
Figure 3.13: Mass Spectrometry for hinoki oil (Adams, 2007). ... 73
Figure 3.14:Structure for α-pinene (Dhar et al., 2014) ... 73
Figure 3.15: Modified Extractor Design for Dynamic Solubility Measurements in CO2 81
Figure 3.16:Calibration of UV-VIS Spectrometry at 290 nm for terpinen-4-ol ... 82
Figure 3.17: Calibration of UV-VIS Spectrometry at 290 nm for α-cedrene ... 84
Figure 3.18: Calibration of UV-VIS Spectrometry at 290 nm for α-pinene ... 86
Figure 3.19: Phase diagram for Carbon Dioxide (White, Burns, & Christensen, 2006). . 92
Figure 3.20: Solubility of terpinen-4-ol in SC-CO2 ... 93
Figure 3.21: Solubility of α-cedrene in SC-CO2 ... 94
xxiii
Figure 3.23: Solubility of terpinen-4-ol with PR-EOS in SC-CO2 ... 96
Figure 3.24: Solubility of α-cedrene with PR-EOS in SC-CO2 ... 98
Figure 3.25: Solubility of α-pinene with PR-EOS in SC-CO2 ... 98
Figure 4.1: Sandwich ELISA steps (Chakravarthy, 2011) ... 107
Figure 4.2: Evaporation rate of essential oils at 30°C with mineral oil as control ... 109
Figure 4.3: Evaporation rate of essential oils at 30°C with n-decane as control ... 113
Figure 4.4: Standard curve for Fel d 1 ... 114
Figure 4.5: Linear regression on plate reader 1 ... 115
xxiv
LIST OF SYMBOLS
Ap Projected area of a particle
C Concentration = 𝑴𝒊 𝑽 =
𝒎𝒇𝒊𝑴
𝑽 = 𝒎𝒇𝒊𝝆
Cam Virtual mass coefficient
CD Standard drag coefficient for spherical particles
C1ϵ 1.44 (k-ɛ model constant)
C2ϵ 1.92 (k-ɛ model constant)
Cµ 0.09 (k-ɛ model constant)
𝒄̅𝒑 mean constant-pressure specific heat at temperature T
𝒄𝒑𝒐 reference specific heat at temperature T
o
Ρ density
ρs density of the solid state
ρv density of the vapor state
D Hydraulic Diameterm
dp Particle Diameterum
Dim Molecular diffusivity
𝛁 Partial derivative of quantity with respect to all directions
𝛁p Pressure gradient in the carrier fluid
xxv E Energy kJ
Fb Resultant of body forces N
Fd Drag Force N
Fg Gravitational Force N
Fh,I Diffusional thermal energy flux N
Fp Pressure gradient forceN
Fvm Virtual mass force N
f Darcy friction factor
g Gravitation acceleration vector m/s2
h thermal enthalpy
ht thermal enthalpy
H1 Enthalpy at the inlet stream kJ/kg
H2 Enthalpy at the outlet stream kJ/kg
𝐇𝟐𝐯𝐚𝐩𝐨𝐫Enthalpy of vapor at the outlet kJ/kg
𝐇𝟐𝐝𝐫𝐲 𝐢𝐜𝐞Enthalpy of dry ice at the outlet kJ/kg
Jj Diffusion heat flux W/m˚C
k turbulent kinetic energy
L Length of tube m
m mixture of CO2 and air gas phase
𝐦̇ Mass flow rate kg/s
M total mass of the mixture
Mi mass of each constituent of the mixture
xxvi mp Mass of particle kg
mfmRatio of the mass of species m to the total mass of the mixture
Mi Inter-phase momentum exchange per unit volume
p Hydrostatic pressure
P1 Initial Pressure MPa
P2 Final Pressure MPa
PsaturationCO2 Saturation Pressure MPa
∆P Pressure drop MPa
Re Reynolds number
Rep Particle Reynolds number
sm Mass source
Sm Rate of mass production or consumption
r Radius of particle m
t times
T temperature
T1 Inlet Temperature K
To Initial Temperature K
Tw Wall temperature K
µ Molecular dynmaic viscosity
𝝁𝒕 Turbulent viscosity
V Velocity gradient 1/s
v Mean flow velocity m/s
xxvii v2 Velocity at the outlet m/s
ʋ kinematic viscosity
x2 Mass fraction of CO2 vapor
1-x2 Mass fraction of dry ice
Vd Droplet velocity
vs Particle slip velocity
xxviii
LIST OF ABBREVIATIONS
CFD………...……...Computational Fluid Dynamics
DERP 1………...Dermatophagoides pteronyssinus 1
ELISA……….Enyzme-Linked Immunosorbent Assay
FELD 1………...………...Felis Domesticus 1
IgE………...………...Immunoglobin
MARIA……….…….Multiplex Array for Indoor Allergens
PR-EOS……….Peng-Robinson Equation of State
RANS……….Reynolds-Averaged Navier-Stokes
RTD………...….…..Residence Time Distribution
SFX………..….Supercritical Fluid Extractor
TDE………...………...Turbulence Energy Dissipation
1
CHAPTER 1: INTRODUCTION
1.1 ASTHMA STATISTICS
Every day in America, 44,000 people experience an asthma attack and 9 die. More
than fifty million Americans suffer from allergies, making this the sixth leading cause of
chronic disease in the United States. The percentage of individuals with asthma in the
United States is currently 8.2% which has been steadily on the rise until a recent leveling
off in the past decade (1). Currently the prevalence of doctor-diagnosed childhood asthma
in the United States is approximately 7% (2). Children living in poor neighborhoods bear
the highest burden of disease and are four times more likely to be hospitalized for asthma
as children who live in wealthy neighborhoods.
Additionally, asthma is a health disparity problem. Asthma is slightly more
prevalent amongst African Americans than Caucasians. African Americans are three times
more likely to die from asthma (3) and African American women have the highest asthma
mortality rate of all groups, more than 2.5 times higher than Caucasian women (3). The
current prevalence of doctor-diagnosed childhood asthma in the United States is estimated
at 7% with African American children having a slightly higher national prevalence of 8%
(4). However, in New York City 17% of children experience asthma like symptoms at some
point in their lives (4). The cost of asthma in 2007 was estimated to reach $19.7 billion
2
The National Survey of Lead and Allergens in Housing, conducted by the National
Institute of Environmental Health Sciences (NIEHS) and the US Department of Housing
and Urban Development revealed that 84% of US homes have detectable levels of mite
allergens, half have levels sufficient to trigger allergic reactions, and a quarter have high
enough allergen levels to trigger asthma attacks (5). The highest levels of mite allergens
are found in bedding and carpets (6).
Asthma can be trigged by numerous factors. Of specific interest for this research is
the inhalation of bioaerosols. Bioaerosols are biological triggers which include allergenic
proteins found in airborne household dust. Bioaerosols first accumulate, and then are
released from indoor reservoirs such as carpets and bedding. Common indoor allergen
generators include dust mites, cockroaches, pets, and pests such as rodents. Data from the
National Survey of Lead and Allergens in Homes (6) show that over 50% of homes have
detectable levels of at least six indoor allergens, and nearly 46% had three allergens at
levels capable of triggering asthma.
1.2 CAUSES OF AN ASTHMA ATTACK
Asthma is a common chronic disorder of the lung airways that involves a complex
interaction of airflow obstruction, bronchial hyper responsiveness and underlying
inflammation. This interaction can be highly variable among and within patients over time
(7). An asthma attack occurs when airways in the lung become swollen and inflamed. The
muscles around the airways contract, causing the bronchial tubes to narrow. During an
asthma attack, individuals cough, wheeze and have trouble breathing. An asthma attack
3
Dust mite allergen, Dermatophagoides pteronyssinus group 1(Der p 1) and cat
allergen Felis domesticus allergen 1 (Fel d1) are two common indoor allergenic proteins.
In some individuals, asthma can be triggered by medications, such as aspirin and other
non-steroid anti-inflammatory drugs. Urbanization has also been associated with an increase in
asthma incidence, however the exact nature of this relationship is unclear (8).
Once the human body detects an allergen as foreign, it initiates a cascade of events
which stimulate several types of immune cells. T cells, activated by antigen presenting
cells, rapidly stimulate B cells. These B cells transform into plasma cells which produce
Immunoglobin (IgE) antibodies specific to the allergen. Finally, the allergenic proteins
invoke an excessive activation of certain white blood cells called mast cells and basophils
by IgE. The IgE antibodies bind to these mast cells. At this point, the allergen has triggered
the immune response cascade (7). This reaction results in an inflammatory response that
can range from uncomfortable to dangerous in humans. Common allergic reactions include
asthma attacks, eczema, hives, hay fever and food allergies.
1.3 ASTHMA PREVENTION
Common methods of allergy prevention include reducing the allergen load in the
home environment. This includes vacuuming, cleaning surfaces, denaturing allergens via
chemical sprays, such as tannic acid, and laundering with hot water detergents. Recent
research evaluated the optimal conditions of mechanical laundry for the removal of house
dust mites. Four washing modes were compared 30°C, 40°C, 60°C and steam water (SW)
with detergent. Allergen removal performance was assayed using an Enzyme-linked
immunosorbent assay (ELISA). The 30°C and 40°C washing modes were only 6.5% and
4
and SW washing modes, nearly all house dust mites were killed. The amounts of Der f 1
remaining after the 30°C, 40°C, 60°C, and steam washing modes were 26.8%, 2.4%, 1.3%,
and 0.6%, respectively (9). As the temperature of the wash mode increased the level of
allergen deactivation increased as well.
1.4 ROLE AND STRUCTURE OF ALLERGENIC PROTEINS THAT TRIGGER ASTHMA
1.4.1 FELIS DOMESTICUS D 1 ALLERGEN
Domestic cats (Felis domesticus) are a popular pet in United Stated homes. 99.9%
of homes have measurable levels of cat allergens, even though only 49.1% of homes have
either a dog or a cat (6). Nevertheless, cat allergens are one of the major triggers of asthma
worldwide. Cat allergens are adhesive so that they stick to clothes and very small particles
of these allergens can become aerosolized. The highest levels of cat allergens are found in
living rooms (10).
The dominant cat allergen, Fel d 1, is produced largely in cat saliva and sebaceous
glands (11). This protein is of an unknown function in the animal, but causes an IgG or IgE
reaction in sensitive humans. A cartoon of the Fel d 1 protein is shown in Figure 1.1. Fel
d 1 is composed of eight α-helices. Fel d 1 is a four subunit tetramer composed of two 18
kDa heterodimers (10), which have a similar three-dimensional structure. A dimer is a
complex of two macromolecules and a hetero-dimer is formed when two dimers bond.. The
Fel d 1 heterodimers are disulfide-linked. The structure of Fel d 1 is remarkably similar to
5
Figure 1.1: Structural characterization of the cat allergen, Felis domesticus 1 tetramer (10)
1.4.2 DERMATOPHAGOIDES PTERONYSSINUS GROUP 1 ALLERGEN
Dermatophagoides pteronyssinus group 1 is a potent allergen derived from dust
mites. Dust mites are ubiquitous in most humid and warm areas and are often found in
bedding or underneath carpeted floors. Exposure to dust mite allergens is a known risk
factor which may trigger an asthma attack (11). Dust mites range in size from 0.3 to 0.4
mm. Dust mites do not bite, allergenic exposure occurs through contact with the allergenic
proteins in the mite feces and corpses (12).
The density and species prevalence of dust mites (13) was determined at various
times over a 5-year-period in 252 homes of dust mite sensitive asthma patients living in
eight geographic areas of the United States (Cincinnati, Ohio; New Orleans, La.; Memphis,
Tenn.; Galveston, Texas; Greenville, N.C.; Delray Beach, Fla.; San Diego and Los
Angeles, Calif.). The most common dust mites found in the homes were Dermatophagoides
farinae (Der f 1), Dermatophagoides pteronyssinus (Der p 1), Euroglyphus maynei (EM),
and Blomia tropicalis. All homes studied contained Dermatophagoides mites, but few
6
were cohabitated by both Der f 1 and Der p 1. In cohabited homes, one species was
predominant and usually made up at least 75% of the total mite population. Prevalence of
species varied between homes within a geographic area. EM occurred in significant
numbers in 35.7% of homes in New Orleans, Memphis, Galveston, Delray Beach, and San
Diego. Blomia tropicalis occurred in the same cities but in low densities. For all dust
samples, only 13 homes of the 252 sampled had 100 or fewer mites/gm dust, which is
considered to be the threshold for sensitivity. Most homes had average mite densities of
500 or more mites/gm dust. The results of the study suggest a significant and widespread
occurrence of both Der f 1 and Der p 1 (13).
The allergen most prevalent in mite feces is Der 1 (Der f 1+Der p 1). This class of
allergens are unstable in heat and denatures easily. The role of Der 1 in mites is thought to
be that of a digestive enzyme, called cysteine protease. Der p 1 (Figure 1.2) has a molecular
weight of 25 kDa. The proteolytic activity of Der p 1 has been proposed to enhance the
capacity of the molecule to sensitize humans (14). Its secondary structure is a combination
of both α-helices and β-sheets.
7
Der 2 (Der f 2 + Der p 2) is an allergen that is prevalent in the corpses of mites. It has a
molecular weight of 14 kDa and is relatively stable in heat. The role of Der f 2 is not known
(12). Most of the studies that have been done in the US report mite allergens results as
belonging to the Der 1 family (Der p 1 + Der f 1), there is not much information to date
comparing the two groups.
1.5 STRUCTURAL CHARACTERIZATION OF PROTEINS
There are four levels of protein structure, as illustrated in Figure 1.3. The primary
structure is a linear sequence of amino acids that is comprised of one polypeptide chain.
The secondary protein structure arises when the amino acids of the polypeptide chain are
linked by hydrogen bonds between the carbonyl oxygen and the amide hydrogen of the
peptide bond.This bonding generates specific structures in the primary chain, α-helices
or β-pleated sheets (15). α-helices are rod-shaped peptide chains coiled to form a helix
structure and β-pleated sheets are two peptide strands aligned in the same direction or
opposite directions stabilized by hydrogen bonds.
Tertiary protein structure is the three-dimensional arrangement of the amino acids
in a polypeptide chain. This structure is usually the active, conformation and is held
together by multiple noncovalent bonds (15). Quaternary structure is an arrangement of
multiple folded protein or coiling protein molecules in a multi-subunit complex. It is the
next level of complexity from the tertiary structure. Quaternary structure is the
combination of two or more chains, to form a complete unit. The interactions between the
chains are not different from those in tertiary structure, but are distinguished only by being
8
Figure 1.3: Structure Characterization of Proteins (15)
1.6 ESSENTIAL OILS
1.6.1 SOURCES AND CHARACTERISTICS
Essential oils are volatile, natural, complex compounds characterized by a strong
odor and formed by aromatic plants as secondary metabolites (16). There are several
methods for extracting essential oils. These may include the use of liquid carbon dioxide,
microwaves, or low or high pressure distillation via boiling water or hot steam (16).
9
viricidal, fungicidal, and medicinal properties. They are used in embalmment, preservation
of foods, and as antimicrobial, analgesic, sedative, anti-inflammatory, spasmolytic and
locally anesthetic remedies (16). In nature, essential oils play a crucial role in the protection
of the plants as anti-bacterial, antivirals, antifungals, insecticides and as protection against
herbivores by reducing their appetite for such plants. They also may attract some insects to
favor the dispersion of pollens and seeds(16).
Essential oils are very complex natural mixtures. They are characterized by two or
three major components at fairly high concentrations (20–70%) while other components
may be present in trace amounts. Generally, the major components are found to reflect the
biophysical and biological features of the essential oils. The main group is composed of
terpenes and terpenoids while secondary components are more aromatic and aliphatic
constituents. All components are characterized by low molecular weight. The components
include two groups of distinct biosynthetic origin (16).
The mechanism of action of essential oils in vivo is still not well characterized (17).
Scientific literature supporting the efficacy of herbal therapies is still incomplete. There are
few well-controlled studies that support the efficacy of herbal therapies in the treatment
and clinical improvement of patients with asthma. Available scientific evidence has not yet
confirmed the validity of essential oil use in the treatment of asthma (18). There is,
however, some evidence that essential oils may act as in an antimicrobial or antioxidant
manner or have a pharmacological effect on various tissue (17). McDonald and Tovey
reported that several essential oils could be emulsified in low concentrations using Tween
to form effective acaricides. However, Tween detergent is not available to the general
10
simple, effective, inexpensive laundry acaricidal wash that simplifies the process using hot
water. This simple formula allows for maintenance of low allergen levels in bedding for
longer than normal laundering alone (20). Combining eucalyptus oil, a widely available
essential oil, with a specific kitchen detergent concentrate can create an inexpensive
acaricidal wash. They also demonstrated the ability of this was to reduce the recovery of
live mites found in blankets by more than 95% during normal machine washing.
1.6.2 TEA TREE OIL
Tea tree oil is the essential oil that is steam distilled from the Australian native
plant, Melaleuca alternifolia (21). Gas chromatography has identified one hundred
twenty-nine components (22). Terpinen-4-ol is responsible for majority of tea tree oil’s
antimicrobial activity (21). Tea tree oil is composed primarily of the following terpene
hydrocarbons, mono-terpenes, sesquiterpenes and their associated alcohols. Terpenes are
volatile, aromatic hydrocarbons that may be considered polymers of isoprene, C5H8. Tea
tree oil has a relative density of 0.885 to 0.906 g/mL is only slightly soluble in water, and
is miscible with nonpolar solvents (23).
Tea tree oil is commonly used in Australia as a topical therapeutic agent (24). The
medicinal uses of tea tree oil relate primarily to its anti-inflammatory and antimicrobial
properties. The use of tea tree oil as a topical antimicrobial agent is supported by a growing
body of clinical data indicating that it is effective in treatment of infections or medical
conditions such as herpes labialis, acne, and tinea, as well as in the clearance of
methicillin-resistant Staphylococcus auereus (24).
In a recent study (21), Tranchida, et al examined the anti-inflammatory properties
11
were used as a model for tissue macrophages. Upon activation with differentiating
molecules, such as LPS, PBMCs will derived towards a macrophage lineage. Upon
differentiation these cells produce many mediators of inflammation including , TNFα and
IL-1β. Other important monocyte/macrophage derived mediators of inflammation include
IL-8, IL-10 and PGE2. These molecules, and others generated in an inflammatory response
cascade, can damage tissue or activate other cells to produce further downstream
pro-inflammatory mediators (21). Tea tree oil was shown to function as an anti-pro-inflammatory
agent that reduced the production of TNFα, IL-1β, IL-8, IL-10 and PGE2 by LPS-activated
monocytes. At concentrations equivalent to 0.125% tea tree oil significantly suppressed
LPS-induced production of TNFα, IL-1β and IL-10 by approximately 50% and PGE2 by
approximately 30% after 40 hours (21).
1.6.3 CEDAR WOOD OIL
The type of cedar wood essential oil used in this study is extracted from the Eastern
red cedar (ERC), also known as the Juniperus virginiana L. Other cedar trees which
produce the essential oil include the Western Juniper (Juniperus occidentalis Hook) and
Ashe Juniper (Juniperus ashei) (25). Juniperus virginiana L. is the most widely distributed
in the Northern Hemisphere and has about 68 species throughout the world. The leaves,
berries, and essential oils from Juniperus species are used for cosmetic and medicinal
purposes. In traditional medicine, the coniferous parts and leaves of Juniperus are utilized
as antihelmintic, diuretic, stimulant, antiseptic, carminative, stomachic, antirheumatic, and
antifungal agents. These derivatives are also used for wound healing. Juniper essential oils
12
One recent study (25) assessed the wound healing and anti-inflammatory potential
of sub extracts of essential oils obtained from the Eastern Red Cedar, Western Juniper and
Ashe Juniper on male Sprague-Dawley rats and Swiss albino mice. A circular wound was
created and left open on the dorsal interscapular region of each animal by excising the skin
with a 5-mm biopsy punch. Test samples, the reference drug, Madecassol, and essential oil
ointments were applied topically, daily, until the wound was completely healed.
Progressive changes in the wound area were monitored by a camera (Fuji, S20Pro) every
other day. The essential oil of J. occidentalis showed the highest activity on the in vivo
biological activity models. Additionally, the oil of J. virginiana was found highly effective
as an anti-inflammatory compound. The experimental data demonstrated that essential oil
of J. occidentalis displayed significant wound-healing and anti-inflammatory activities
(25).
1.6.4 HINOKI OIL
The Chamaecyparis obtusa, or hinoki cypress, is a conifer of the cypress family
(Cupressaceae), and it is rich in a variety of active pharmaceutical ingredients such as
flavonoids and other essential components (26). It is planted widely in western parts of
Japan, (26) and has shown to have both antifungal and insecticide activities (26).
Chamaecyparis obtusa is also native to Northeast Asia. The oil extracted from the leaves
and twigs of C. obtuse have been commercially used as a functional additive in the
production of soap, toothpaste and cosmetics due to its strong fragrance. The essential oil
derived from the C. obtuse leaf has an antimicrobial activity against various fungal
13
1.7 PATENTS AND OTHER RESEARCH ON ESSENTIAL OILS
As a basis for the work proposed in this dissertation, a patent has been published
that supports evidence that cedar wood oil and hinoki oil are of potential value in
deactivating some allergens. Hinoki oil and cedar wood essential oils are used against one
or both of Der p 1 and Der f 1 allergens (27).
Priestley et al, 1998 used three essential oils (tea tree oil, lavender oil and lemon
oil) to study the effect of the oils inducing immobility and mortality on the house dust mite.
The sides and bottom of a 9cm petri dish were covered with 3 layers of masking tape. A 3
mm layer of mite colony/substrate mixture was added to the dish. The mixture included
finely ground desiccated liver and brewer’s yeast as mite food (28). Due to the fact that
dust mites are extremely small and highly mobile, mite food was given to encourage the
mites to be mobile and easy to observe. The dish was then sealed and incubated at 25°C
and 75% relative humidity. To expose the mites to the essential oils, a 3 cm diameter
portion of filter paper was suspended in the center of a short length of plastic tubing. The
filter paper was then saturated with 0.1 mL of one of the three oils at 10% v/v
concentrations in ethanol. All papers were then allowed to dry for 5 minutes (28).
Figure 1.4 shows the chamber used for testing acaricidal activity. Ten dust mites
were removed from the colony and placed on the test papers. At 30 minutes, the mites were
observed for mobility and at 2 hours for mortality with forceps. Each experiment was
replicated three times. Tea tree oil was the most effective acaricide causing 100%
immobility at 30 minutes and 100% mortality at 2 hours. Lavender oil was acaricidial to a
lesser extent, giving 87% immobility at 30 minutes and 87% mortality at 2 hours. Lemon
14
with no essential oil added showed 0% immobility at 30 minutes and 0% mortality at 2
hours (28).
Figure 1.4: A mite-chamber for testing acaricidal (29)
Another recent study (30) investigated the anti-inflammatory effect of fingered
citron essential oil (FCEO) in LPS-stimulated mouse macrophage (RAW 264.7) cells.
Fingered citron oil originates in India and has been used worldwide. Its peel, leaves and
root have been used as folk medicine for the treatment of stomach ache, edema, headache,
rheumatism, infectious hepatitis and arthritis (30). Fingered citron has been reported to
possess anti-oxidant, anti-inflammatory and anti-microbial activities. The RAW 264.7 cells
were cultured in Dulbecco’s modified Eagle’s medium (DMEM) and treated with LPS to
generate a pro-inflammatory status. The cells were incubated in an atmosphere of 5% CO2
at 37°C and were sub cultured every 3 days. FCEO was diluted with DMEM prior to
treatment. The inhibitory effect of FCEO on the production of pro-inflammatory cytokines
(IL-1β, IL-6 and TNF-α) from LPS treated RAW 264.7 cells was determined using a mouse
enzyme-linked immunosorbent assay (ELISA) kit (30). These three cytokines are known
15
reveal that LPS stimulation significantly increases levels of pro-inflammatory cytokines in
the culture media of RAW 264.7 cells. However, cytokine levels were significantly
decreased by pre-treatment of RAW cells with FCEO. The cytokine levels decreased with
increased levels of FCEO treatment (30).
Table 1.1: Inhibitory effect of FCEO on the pro-inflammatory cytokine production in RAW 264.7 cells
Cytokine LPS treated cells with no
FCEO
LPS treated cells with
0.005% FCEO
LPS treated cells with
0.01% FCEO
LPS treated cells with
0.02% FCEO
TNF-α 100% 60% 45% 40%
IL-6 100% 65% 40% 15%
16
CHAPTER 2: MULTI-PHASE MATHEMATICAL MODELING OF COMPRESSED CO2 EXPANSION THROUGH A COANDA NOZZLE
2.1 MOTIVATION
The motivation behind this work is based from aproject provided by a
university-based startup company called “Carbonix” funded by the National Institute of Health (NIH)
through a Small Business Innovation Research (SBIR) grant and founded by advisors, Dr.
Michael Matthews and Mr. Allan Quick. The technology described below removes
particulate matter from textile surfaces in an indoor environment. These particles contain
biological triggers that cause asthma. The technology utilizes a concurrent spray of dry ice
particles with air, produced through a Coanda nozzle.
This technology, known as the “CarboNix Triple Phase Process” comes from
patented research at the University of South Carolina. Carbonix applies its patented
technology for allergy abatement to home owners, office buildings, public housing and
other public spaces. The technology addresses the use of compressed carbon dioxide for
deactivating and removing allergenic proteins that trigger asthma.
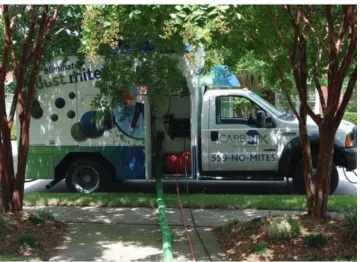
The equipment and materials are incorporated on a CarboNix truck, as shown in
Figure 2.1 that service a home for eradication of allergens from carpets and bedding in
homes. As shown in Figure 2.1, liquid CO2 is supplied at 904.7 psia via the black hose,
17 Figure 2.1:CarboNix truck
A continual flow of compressed carbon dioxide to a Coanda nozzle is used to
produce dry ice and a high velocity gas stream. The cold temperature kills dust mites and
the high velocity gas dislodges particulates that contain the allergens from carpets and beds
in a home. This approach is both clean and dry. Figure 2.1 shows a schematic of the CO2
on board the van which then enters a Coanda nozzle as liquid CO2. The liquid then
thermodynamically exits as a mixture of dry ice and gaseous CO2. Compressed air also
flows through the nozzle providing added velocity via the “Coanda effect”. The Conada
effect is when, similar to the wings of an airplane, the air moves along the contour of the
Coanda nozzle. A jet of air accelerates around the nozzle and then mixes with the CO2. This
18
sublimes in a matter of minutes, producing the very cold temperatures necessary to freeze
the dust mites.
Figure 2.2: Technology for Allergen Abatement
This research project specifically focuses on the Coanda nozzle. A capillary tube
extends through, and just beyond, the tip of the nozzle. Liquid CO2 expands rapidly at the
tip to 1.01 MPa (nominally 1 standard atmosphere pressure (atm)), producing a two-phase
flow of dry ice particles mixed with gaseous CO2. The high velocity air accelerates the
two-phase CO2 stream, producing a cold jet of gas and particles. The two-phase solid/gas
mixture state is a consequence of the thermodynamics of the CO2 phase diagram (31). At
1atm solid and gas can only coexist at the sublimation temperature of -77oC while the liquid
19
Figure 2.3: CO2 Phase Diagram (4) with Coanda spray nozzle
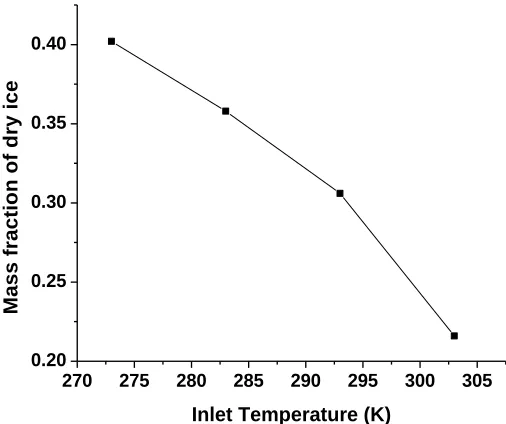
At the outlet state, only solid and gas can exist. The goal is to have the CO2 as cold
as possible so as to form as much dry ice is possible. The first research question pursued
in this work was to query what CO2 supply temperature was needed to produce a given
amount of dry ice from the nozzle. In order to determine the amount of dry ice which could
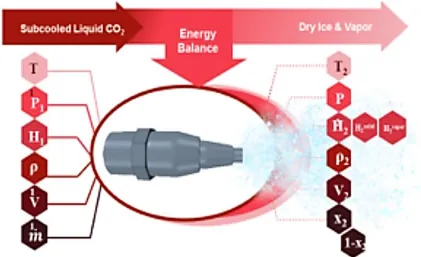
be produced, an energy balance was done on the Coanda nozzle. Shown in Figure 2.4 on
the left are process variables for generating subcooled liquid CO2. Everything for this
experiment was fixed except the inlet temperature, T. A constant mass flow rate of 10 lbm/s
was used in this work. At the outlet, the temperature and pressure are the sublimation state
as shown on the CO2 phase diagram (Figure 2.3), at -78.5 C and 1 atm. 1-x2 represents the
20 Figure 2.4: Coanda Nozzle and Operating Conditions
The mass fraction of dry ice, (1-x2) andthe outlet velocity (v2 ) were determined
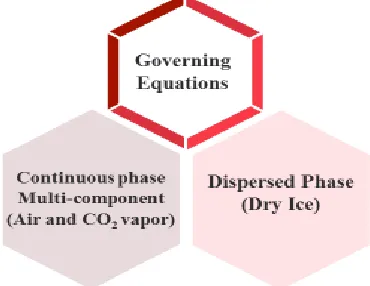
using the energy balance equation. These values were then used as inputs into the
computational fluid dynamics (CFD) simulation which led us to the two other research
questions pursued in this work. An open and closed nozzle boundary were simulated via
CFD. Temperature, pressure, mass fraction of air and CO2 vapor, dry ice particles, and
disperse angle characteristics were observed. In addition, the fluid dynamics of the dry ice
particles in turbulent flow were recorded. The CFD simulations were used as a tool to
improve the overall freeze spray operation for CarboNix.
2.2 LITERATURE REVIEW ON CFD MODELING
Computational Fluid Dynamics (CFD) is a well-known field in fluid science that
21
of fluid flow. The Navies-Stoke equation, mass conservation law and equation of state are
the building blocks of the mathematical models used in CFD simulation (32). The finite
volume method and finite differences scheme are used in the CFD simulation for
transforming differential equations into a set of linear equations. This is done to provide an
improved understanding, both qualitatively and quantitatively, of physical phenomena
present in diverse flow systems. An efficient iterative linear equation solver is used for the
solution (33). Using CFD, a computational model can be built to represent a system or
device being studied. In-built numerical models are employed for the representation of
flow physics and related phenomenon. Boundary conditions at the inlet and outlet are
required for the simulation. The simulations predict flow dynamics and related
phenomenon for the entire computational domain (34).
The objective of this work was to analyze a novel process that utilizes a high
velocity stream of air, produced in a modified Coanda nozzle, to accelerate a flow of dry
ice particles. The modified nozzle creates a stream of dry ice powder that is directed onto
a substrate for the purpose of rapid and dry cooling and cleaning. This “CO2 spray cooling”
process quickly decreases the substrate temperature to -30°C or lower. The dimensions of
the non-adjustable Coanda nozzle is shown in Figure 2.5. One application of such a process
is as a means for achieving precision cleaning without the use of liquid solvents (35).
Another application is to achieve rapid cooling of a substrate, as an alternative to using
22
35.634 m
m
Figure 2.5: Dimensions of non-adjustable Coanda nozzle
A related process, the freeze-drying of liquid water with cold liquid nitrogen, was
conducted by Ananharamakrishman et al [48]. They experimentally studied water droplet
size and axial velocity at various distances below a cone spray pressure nozzle atomizer.
CFD simulations were used to predict temperature profiles at various axial positions below
the nozzle. Axial velocities at particle sizes of 17, 50, 100 and 150µm were measured in
the spray at a chamber temperature of 231.15 K and at a gas inlet temperature at 203 K.
The particle residence time distribution (RTD) was then calculated. CFD simulations were
used as a tool to improve the spray-freeze operation for both a solid-cone spray and
hollow-cone spray process design. A comparison study was done between experimental and
predicted CFD variables on these two designs.
Lee et al. (36) studied the effect of a Coanda nozzle on flow characteristics of an
air amplifier. Various values of Coanda nozzle clearances were considered along with three
diffuser angles and four pressure conditions. Quantitative analysis was performed on each
variable and the optimal configuration of the air amplifier was studied. Lee et al. concluded
that the air amplifier has a 20° diffuser angle, and they subsequently showed that the most
effective nozzle had a 20% higher discharge flow rate than the other models. Additionally,
28 mm
51.13 m
23
this work showed disperse angle and maximum velocity measurements on a spray nozzle
for three sizes of dry ice particles. This analysis showed that a 20º diffuser angle allowed
for the optimal spread on a substrate based on disperse angle, particle size and maximum
velocity.
Compressed air enters the nozzle and is directed through the annular region around
the exterior surface of the nozzle (36). The high velocity jet stream adheres to the curved
exterior surface and entrains additional air from the surroundings, producing a high
volume, high velocity flow downstream of the nozzle, as illustrated in the computational
mesh diagram shown in Figure 2.6. The modification under consideration is an installation
of a supply of liquid CO2, delivered through a capillary tube coaxially within the air supply
tube (35). To date, no articles have been reported in open literature on the CFD modeling
of the spray-freeze non-adjustable Coanda nozzle on an open and closed boundary.
Figure 2.6: Computational Domain and Meshing
2.3 NOVEL TECHNOLOGY ON THE “SPRAY FREEZE PROCESS”
Wherein ordinary vacuuming and steam carpet cleaning are current technologies
used to kill dust mites, dust mites must be exposed at a temperature greater than 60°C for
a reasonable period to ensure death. The negative aspect of steam cleaning is that the items
CO2 outlet
Air outlet Air inlet
24
must remain wet for a significant period after cleaning. Dust mites thrive in damp
environments and this moisture provides the remaining mites a jump-start on re-infestation.
In addition, damp carpets or mattresses provide a compounding issue of mold spore
formation and growth.
The technology behind this work focuses on a non-adjustable Coanda nozzle that
delivers high speed dry ice spray to a carpet surface. The process uses a spray nozzle to
create a spray of dry ice that jets both air and dry ice particles onto a carpet or mattress
containing allergenic protein. The spray quickly drops the surface being treated to -30°C
or lower. The turbulence and extreme temperature transition of the technology (to -30°C)
kills dust mites with a high-suction vacuum to remove the mites, eggs, larva, nymphs and
mite feces from carpets. This equipment simultaneously collects both the dislodged
particles as well as the CO2 as it sublimes from solid to gas. The surfaces return to room
temperature in a matter of minutes, and the surface is then completely dry.
The spray penetrates the carpet, freezing dust mites deep into a carpet or mattress.
A vacuum head then removes the dust, dust mites and other debris dislodged by the
high-speed spray. The dry ice rapidly sublimes, leaving the carpet dry. Wherein most
dry-cleaning companies use perchloroethylene as a solvent, the technology used in this work
is CO2 which is non-toxic and odorless.
The modification under consideration is the installation of a supply of liquid CO2,
delivered through a capillary tube coaxially inside the air supply tube (35). To this date, no
articles have been reported in open literature on the CFD modeling of the spray-freeze