R E S E A R C H
Open Access
Evaluation of network service model based
on network convergence
Jing Zhang
*and Xiaoping Liu
Abstract
Technologies such as Bluetooth, RFID, WiFi, 4G, and the Internet of things are mutually converged with ADSL and fiber to the home network. Users can get information in the forms of word, voice, images, etc. through ubiquitous networks including the fixed telephone, the mobile telephone, the television, the computer, and diversified informational zed terminal equipment. Ubiquity informatization may be the trend of future network development, which is the development direction of the ubiquitous intelligent comprehensive network information society. Its physical representation is the appearance of ubiquitous network or the named universal network. It represents the ubiquitous prosperity that all people, all organizations, and industries can get benefits from the ubiquity informatization. This article studies the internal and external structures of network service model and introduces technology dynamics, demand dynamics, competition, and security as adjustment variables. Then, the evaluation model of network service based on network convergence is proposed and tested. The test results prove the validity of the evaluation model.
Keywords:Evaluation model, Network service, Networks convergence, SEM, Dynamic
1 Introduction
The feature of the world economy has transformed from large-scaled industrial production to new high tech like the information technology, and the industrial convergence mainly promoted by the information technology has become the new growth point of the world economy. Many countries provide support through legislation for the net-work convergence, and a series of policies have been put forward to encourage technological innovation and market competition. After more than a decade’s development, a new convergence competition pattern forms. Convergence of the telecommunication network, the internet and the radio and television network has been basically imple-mented in some countries, which greatly promoted the development of information industry, and played a signifi-cant role in pushing the economic growth and promoting the social progress.
The development of network convergence fits to certain rules. The evolution of network convergence can be divided into four stages: Nicholas Negroponte (1973) [1] described the marginal overlay phenomenon of the com-puter industry, radio and movie industry, and the printing
and publishing industry by using three overlapping circles. He indicated that the overlapping area is the field with the fastest developing speed and the brightest future vision. It is the first stage. In the 1980s, of the second stage, the concept of convergence of computer network, radio and television network, and telecommunication network was proposed. In the 1990s, of the third stage, network conver-gence referred to telecommunication network, radio and television network, and the Internet. With more and more attention being paid on the media prosperity of communi-cation, network convergence refers to the convergence of telecommunication network, the Internet, and media net-work. The popularity of the mobile Internet and the step-ping of the Internet of things from concept phase to implementation phase constantly expand the scope of the network, while continuing to promote the convergence of the network. Network convergence on the physical level refers to the transmission of voice, data, and images on the same network. For users, it means to realize the func-tion of calling, watching TV, surfing the internet, and so on through the same access.
At present, the network convergence in China refers to that of the digital Internet represented by the Internet, the telecommunication network represented by the telephone network including the mobile communication network, * Correspondence:[email protected]
School of Automation, Beijing University of Posts and Telecommunications, Beijing 100876, China
and the radio and television network represented by the cable television network. The networks represent three different industries in the modern information industry, namely, the basic facility in the telecommunication indus-try, the internet indusindus-try, and the cable television industry. The current the network convergence does not mean the physical combination of the telecommunication network, the computer network, and the cable television network, but the application integration in business application. Technically, on the network level, the realization of mutual communication forms a seamless coverage. On the busi-ness level, mutual infiltration and crossing can be practiced. On the application level, the unified IP agreement can be used gradually. On the operation level, mutual competition and cooperation can be developed and crossed towards the same aim of providing diversified, mediatized, and person-alized services. Finally, the industrial management and the policies can be gradually unified.
Traditionally, communication and media are completely different. However, with the development of technology, the boundaries between them are gradually becoming fussy. The communication becomes more important as a media method and the modern communication technology be-comes a base of the new media, so the media prosperity of communication becomes increasingly emphasized.
In recent years, new media represented by the Internet develops fast. New media mainly refers to the media form which appears with the support system of new technolo-gies. In addition to the Internet, it also includes digital magazine, mobile phone SMS, and the touch media. [2]. New media is completely different with the traditional one in form. It submerses the communication studies in the traditional meaning. The American magazineWiredgave a vivid definition of the new media as the transmission from all people to all people.
New media grows extremely fast from its production to its development. According to the definition given by an American transmission scholar that only when the using population of one media reaches the one fifth of the whole population around the country can it be referred to the public media. In America, the usage period of public media that reached the standard including the radio, the television (wireless), and the cable television is, respect-ively, 38, 13, and 10 years, but that of the Internet only takes 5 years. In China, according to the report data of iResearch Consulting, the new media accounted for 35% of the media industry in 2012, in which the proportion growth compared to the same period of the network media including the network game and the network advertisement is 72.5%. The growth speed is far more than that of the traditional media of 13.6%, and the industrial scale of the new media industry expands quickly.
With the gradual deepening of the influence produced by the new media on the mainstream media, the network
convergence can be promoted to a new stage until that of N networks [3]. The network convergence in the next stage may be practiced by taking the production, process-ing, transferrprocess-ing, and storage of information as the core. Through that, all kind of information including the data, video, and message can reach to any consumers through any physical network. Any legitimate information can get through the network easily. Data can be transferred, stored, and processed on the network. The intelligence trend of the network and the toolized degree become much higher; thus, the media prosperity of the communi-cation network can be adequately represented. However, the N network convergence is the extension and develop-ment trend of the network convergence, which can make anyone enjoy any information service through any phys-ical network. It would be the network that enables every-one’s compound roles as the information producer, the propagator, and the consumer to be maximally realized.
From one network convergence to N network conver-gence, it is actually the direction of Ubiquity information development [4]. The ubiquity information refers to the intelligent comprehensive network information society, also the ubiquitous network society. In 1994, Japanese scholar Tadao Umesao proposed the concept of information society [5]. With the development of almost half a century, the information society is developed towards the direction of the ubiquitous intelligent comprehensive network informa-tion society, namely, the U informainforma-tion direcinforma-tion.
Currently, the technologies represented by the Blue-tooth, RFID, WiFi, 4G, and the Internet of things are mutually converged with the ADSL and the FTTH net-works [6]. Users can obtain information in the forms of text, voice, picture, and so on through the ubiquitous networks including the fixed telephone, the mobile tele-phone, the television, the computer, and diversified informational zed terminal equipment. U information direction is the trend of future network development, which is the development direction of the ubiquitous intelligent comprehensive network information society. Its physical representation is the appearance of ubiqui-tous network or the named universal network. It repre-sents the ubiquitous prosperity that all people, all organizations, and industries can get benefits from the U information direction.
ecosystem has been proposed in the background of future 5G services vision [9].
Network convergence is the necessary trend for the development of the global information, with the basic rea-son as the progress of information technology and the pursuing for network scope economy from the network industry. This article studies the evolution of internal and external structures of network service model under the background of network convergence and introduces tech-nology dynamics, demand dynamics, competition, and security as adjustment variables. Then, the evaluation model of network service based on network convergence is proposed and the test is implemented to prove the validity of the evaluation model.
2 Methods and tools
The paper applies the analysis technology of structural equation model (SEM) to test the hypotheses in the re-search. Structural equation model invokes a measurement model that defines latent variables using one or more observed variables and a structural model that imputes re-lationships between latent variables. The model consists of latent variables, measured variables, and a path. Latent variables cannot be directly observed but are rather in-ferred from other variables. Measured variables (manifest variable) can be directly measured and are usually used to explain latent variables [10].
In the analysis process of SEM, the first problem to be judged is the validity of the measurement model, mean-ing whether the observation variables can be measured to define the corresponding latent variables; otherwise, the analyzed result through the SEM method would be invalid. Therefore, the trust and efficiency evaluation problem of the measurement table are involved.
2.1 Reliability test
The measurement model part in the SEM model includes the latent variables and several observable variables used to test the latent variables (shown variables). The internal consistency between the tested items is an index to be measured. To carry out the trust test for the variables is a significant aspect in the evaluation of the SEM model.
To make the reliability test on the variables is an important aspect in the evaluation of the SEM model. Cronbach’s alpha is used often to test to what degree can the observed variables belong to the same group [11]. Therefore, this paper first carried out the reliabil-ity test on the questionnaire, meaning to verify the internal consistency between the tested items to evalu-ate the reliability of the measurement table through adopting the method of Cronbach’s alpha. The coeffi-cients are used as the trust evaluation indexes, and the software of SPSS is used to finish the reliability test of the measurement table.
2.2 Factor analysis
The principle of the factor analysis can be explained as follows. In a research, some unrelated comprehensive indexes may be used to analyze each kind of information in the variables. These comprehensive indexes are called factors. The factor analysis is to describe the relationship between many indexes or elements by several factors, indicating to reflect most information only by several factors. When testing the SEM model, this paper sets up two or more observation variables, which are subordin-ate to a certain potential variable, and then, the trust and efficiency of this kind of variable design is tested.
In this study, potential variables are designed in the SEM model, and each potential variable can be measured by several observable variables. Then, whether these measurement items can really reflex the real features of the measured potential variables requires a factor analysis. The result of the factor analysis on the measurement table can reflect the structural efficiency, while the main evalu-ation indexes include the factor loading and the cumula-tive explaining variance. The factor loading represents the relative degree between the original variable and some certain common factor. The cumulative explaining vari-ance indicates the cumulative effective degree of the com-mon factor to the measurement table or model.
2.3 Descriptive statistics and simple correlation analysis
Structural equation model analysis is based on relative coefficients, and the obvious correlation between variables is required. So, to make the correlation analysis on the variables is the premise of carrying out the SEM analysis.
The descriptive statistical analysis mainly checks the mean and the standard derivation of the collected data. The standard derivation shows the average discrete degree of a group of data around the average. The higher the standard derivation, the higher the difference degree of the variables is. The Pearson correlation coefficients are used in analyzing the correlation degree between each variable, and the values of these correlation coefficients should be between −1 and 1. A positive value shows a positive relationship, while a negative value indicates a negative relationship. The higher the absolute value, the higher degree of correlation it shows [12].
The analyzing tools of this paper include AMOS7.0 and SPSS16.0. AMOS7.0 is a software package that uses the potential variables based on the variance matrix structure to evaluate the structure model. This method tests the mutual relationship between variables (whether the relationship is direct, indirect, or rational or ir-rational) through a multi-level analysis. It applies to the models with potential variables for indicating the mutual relationships and testing the model convergence.
software package is beneficial for analyzing the proposed problems in this paper. First, the structural equation model reflects not only the separate relationship between the elements in the model but also the mutual influence between them. Second, using the software package of AMOS7.0 to make an analysis can give a full play to the multi-route analysis of this method for presenting the fea-tures between variables’ relationship. The clear route of AMOS can help to understand the structural equation model and avoid the interferences brought by measure-ment errors in a better way.
The survey includes two stages. First, we carry out a small-range questionnaire survey in three representative enterprises. Fifty pieces of questionnaires were provided, and 34 pieces were fed back, with the collecting propor-tion of 68%. Second, we conducted a larger and more extensive survey in Beijing, Changsha, and Shanghai, with more than 500 pieces of questionnaire being provided, while 397 pieces have been collected back, taking a pro-portion of 79.4%. Among the collected questionnaires, 350 pieces are valid, and the validity proportion is 88.2%.
3 3. Variable measure and test 3.1 Variable measure
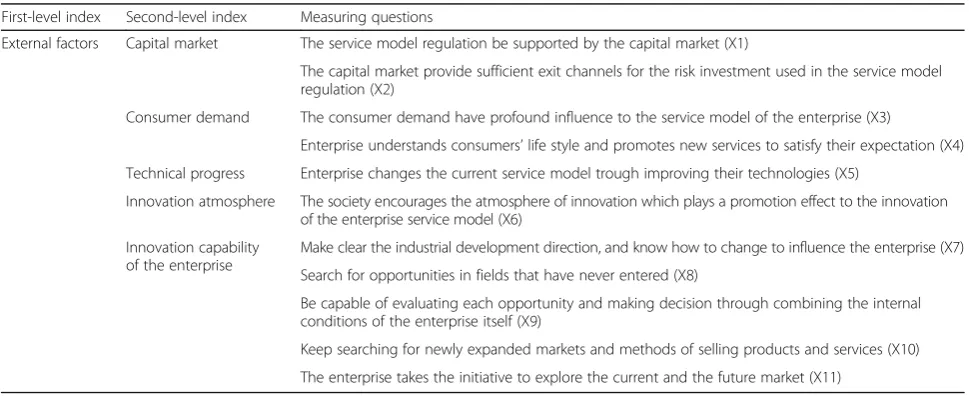
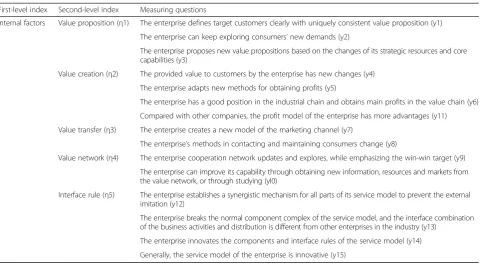
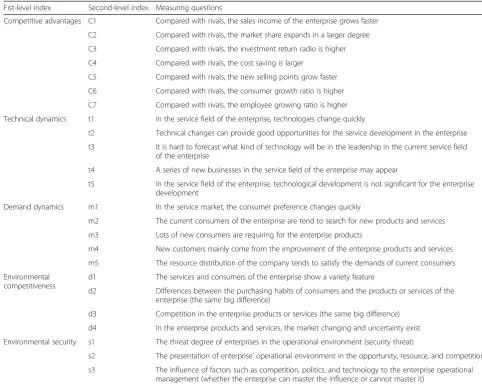
This paper measure the latent variables by using external, internal [13], and adjustment factors [14–17] that influence the selection of network service model under network con-vergence, see Tables1,2, and3.
3.2 Reliability test
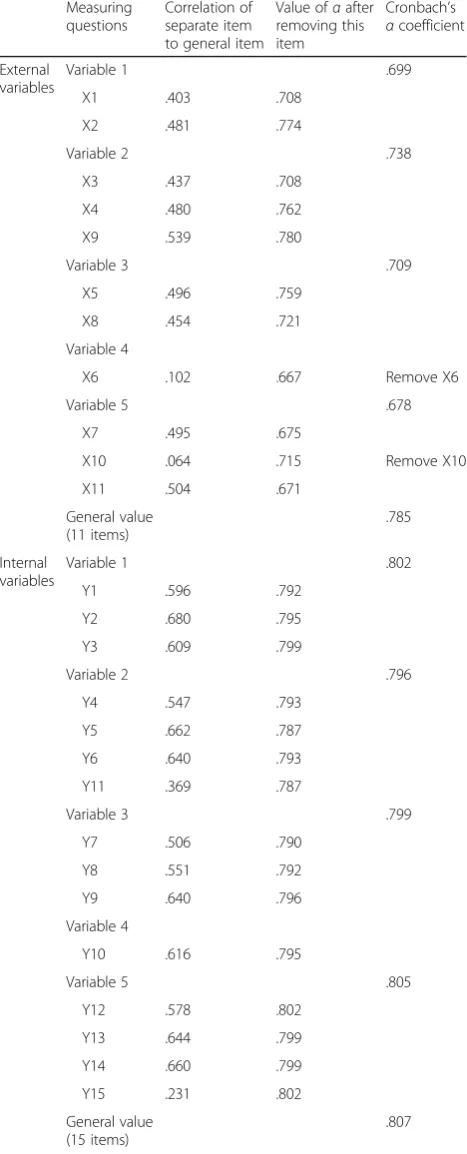
The reliability test result of external elements of the ser-vice model based on network convergence is shown as follows in Table 4. Cronbach’sα coefficient values of the capital market, the consumer demand, the technical
progress, and the enterprise innovation capability are, re-spectively, 0.699, 0.738, 0.709, and 0.678. The total Cron-bach’sαcoefficient is 0.785, showing that the trust degree can basically research or surpass the acceptance level of 0.7 suggested by Nunnally (1994) [18], and there is a high degree of internal consistency of the external factor meas-urement scale. The correlation value of each separate item to the general item should reach 0.4. According to the standard proposed by Tian (2001) [19], an item with a coefficient value of less than 0.4 should be removed. Therefore, X6 and X13 are removed.
The reliability test result of internal variables is shown in Table4. The correlation coefficient of item y6 in the value creation to the overall dimension is 0.369, and that of item y15 in the interface rule is 0.231, which are lower than the standard of 0.4; therefore, the two items are removed. Cronbach’s α coefficient values of the value proposition, the value creation, the value transfer, and the interface rule are, respectively, 0.802, 0.796, 0.799, and 0.805, which surpass the acceptance trust level of 0.7. It indicates the high internal consistency of the internal factor measurement table.
3.3 Validity test
KMO is usually used to evaluate the adaptation of the sam-ple. Before carrying out the factor analysis, the KMO value should be tested. A sound KMO value represents that the collected sample fit to the factor analysis. According to the study by Kaiser [20], if the value of KMO is smaller than 0.5, then the adaptation of the sample is not good and only when the KMO value is larger than 0.6 can the factor ana-lysis be valid.
Table 5 shows the test results of the KMO and the Bartlett sphericity test of the four items that are used to evaluate the external environmental factors in the
Table 1External variables measure of network service model First-level index Second-level index Measuring questions
External factors Capital market The service model regulation be supported by the capital market (X1)
The capital market provide sufficient exit channels for the risk investment used in the service model regulation (X2)
Consumer demand The consumer demand have profound influence to the service model of the enterprise (X3)
Enterprise understands consumers’life style and promotes new services to satisfy their expectation (X4)
Technical progress Enterprise changes the current service model trough improving their technologies (X5)
Innovation atmosphere The society encourages the atmosphere of innovation which plays a promotion effect to the innovation of the enterprise service model (X6)
Innovation capability of the enterprise
Make clear the industrial development direction, and know how to change to influence the enterprise (X7)
Search for opportunities in fields that have never entered (X8)
Be capable of evaluating each opportunity and making decision through combining the internal conditions of the enterprise itself (X9)
Keep searching for newly expanded markets and methods of selling products and services (X10)
service model selection. The KMO value is 0.698, and the accompany probability from the Bartlett sphericity test is 0.000, which is smaller than the obvious level of 0.05, so the test rejects the zero hypothesis of the Bart-lett sphericity test, holding that it fits to the factor analysis.
Table6 shows the factor analysis result of the internal environmental factors in the service model selection. The result of the factor analysis on the nine items shows that they have a significant factor load coefficient on four common factors. It can be seen that the two items of capital market support, three items of the consumer demand, two items of the technical progress, and two items of the industrial development are separately posi-tioned in four different common factors, indicating that the four dimensions are the dimensions of influencing factors in different service model selections. Generally, the four dimensions are mutually independent. The sam-ple date result reflects the independency of the capital support, the consumer demand, the technical progress, and the industrial development well.
The result of the KMO and the Bartlett sphericity test on 15 items of the internal structure shows the value of KMO is 0.666. According to the standard given by the statistic sci-entist Kaiser, when the value is larger than 0.6, it shows the sound adaptation to carry out the factor analysis. The ac-company probability of the Bartlett sphericity test is 0.000, which is smaller than the significance level of 0.05, so the zero hypothesis of the Bartlett sphericity test is rejected, in-dicating that it fits to the factor analysis.
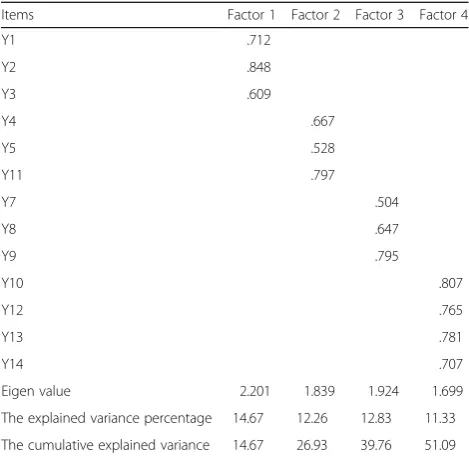
Table7 shows the factor analysis result of the internal structure of the service model selection. The result of the factor analysis on the 15 items shows that they have a significant factor load coefficient on five common factors. It can be seen that the three items of value prop-osition, three items of the interface rule, three items of the value transfer, three items of the value creation, and two items of the value network are separately positioned in five different common factors, indicating that the five dimensions are the different service model dimensions. Generally, the five dimensions are mutually independent. The sample date result reflects the independency of the value proposition, interface rule, value transfer, value creation, and value network well.
4 Results and discussion
The structural equation model includes the measurement model and the structure model. The former describes the relation between the obvious variables and the potential variables, indicating the observable variables of the poten-tial variables [10]. The simple measurement model is the confirmed factor analysis model. The calculation result of the measurement model, which is the load coefficient between the factor and the index, shows the explaining degree of the measurement index to the total variable of the factor. Meanwhile, the statistical significance of the load coefficients is judged, which is also thetvalue.
To judge whether a model can be accepted in the testifying factor analysis, the analysis of the model fitting
Table 2Internal variables measure of network service model First-level index Second-level index Measuring questions
Internal factors Value proposition (η1) The enterprise defines target customers clearly with uniquely consistent value proposition (y1)
The enterprise can keep exploring consumers’new demands (y2)
The enterprise proposes new value propositions based on the changes of its strategic resources and core capabilities (y3)
Value creation (η2) The provided value to customers by the enterprise has new changes (y4)
The enterprise adapts new methods for obtaining profits (y5)
The enterprise has a good position in the industrial chain and obtains main profits in the value chain (y6)
Compared with other companies, the profit model of the enterprise has more advantages (y11)
Value transfer (η3) The enterprise creates a new model of the marketing channel (y7)
The enterprise’s methods in contacting and maintaining consumers change (y8)
Value network (η4) The enterprise cooperation network updates and explores, while emphasizing the win-win target (y9)
The enterprise can improve its capability through obtaining new information, resources and markets from the value network, or through studying (yl0)
Interface rule (η5) The enterprise establishes a synergistic mechanism for all parts of its service model to prevent the external imitation (y12)
The enterprise breaks the normal component complex of the service model, and the interface combination of the business activities and distribution is different from other enterprises in the industry (y13)
The enterprise innovates the components and interface rules of the service model (y14)
should be made for judging the validity of the model. The frequently used fitting indexes include theχ2of the chi-square test and χ2/dftest, root mean square error of approximation (RMSEA), standard root mean square residual (SRMR), Normal Fit Index (NFI), Comparative Fit Index (CFI), GFI, and AGFI.
4.1 Evaluation model of internal factors
According to the proposed concept model and the research hypotheses in the former part of this paper, the AMOS7.0 software is used to represent the structural equation model of the internal factors adopted in the service model selection. It can show clearly the contained variables and the variable structure in this research.
The parameter estimation of the SEM model in this paper adapts the method of maximum likelihood esti-mation, and the model evaluation and revision are car-ried out from the following three aspects. First, use each fitting index to make an overall evaluation of the model. This research mainly checks the degree of
freedom, the chi-square value, the CFI, the NFI, and the RMSEA. Secondly, test the significance of the par-ameter, the meaning and rationality of the evaluation parameters, such as the coefficient of each route, the residual value, and the statistical significance. Thirdly, determine the statistic value of the variable model fitting degree.
Table 8 shows the overall fitting statistic value of the original model. Here, the representatives of the absolute fitting indexes include the chi-square value χ2= 535.232, and the degree of freedomdf= 128, and then the ratio of
χ2
/df= 4.179. The ratio value is between 2.0 and 5.0, indicating that the model is acceptable. The value of RMSEA is 0.098. Steiger (1980) [21] believed that when the value of RMSEA is lower than 0.1, it shows a good fitting degree; when it is lower than 0.05, the fitting degree is better; and when the degree is lower than 0.01, the fitting degree is excellent. The value of CFI and NFI is all more than 0.9, achieving the requirement level of incremental fit. The above indexes all reflect that the
Table 3Environmental adjustment variables measure of network service model Fist-level index Second-level index Measuring questions
Competitive advantages C1 Compared with rivals, the sales income of the enterprise grows faster
C2 Compared with rivals, the market share expands in a larger degree
C3 Compared with rivals, the investment return radio is higher
C4 Compared with rivals, the cost saving is larger
C5 Compared with rivals, the new selling points grow faster
C6 Compared with rivals, the consumer growth ratio is higher
C7 Compared with rivals, the employee growing ratio is higher
Technical dynamics t1 In the service field of the enterprise, technologies change quickly
t2 Technical changes can provide good opportunities for the service development in the enterprise
t3 It is hard to forecast what kind of technology will be in the leadership in the current service field of the enterprise
t4 A series of new businesses in the service field of the enterprise may appear
t5 In the service field of the enterprise, technological development is not significant for the enterprise development
Demand dynamics m1 In the service market, the consumer preference changes quickly
m2 The current consumers of the enterprise are tend to search for new products and services
m3 Lots of new consumers are requiring for the enterprise products
m4 New customers mainly come from the improvement of the enterprise products and services
m5 The resource distribution of the company tends to satisfy the demands of current consumers
Environmental competitiveness
d1 The services and consumers of the enterprise show a variety feature
d2 Differences between the purchasing habits of consumers and the products or services of the enterprise (the same big difference)
d3 Competition in the enterprise products or services (the same big difference)
d4 In the enterprise products and services, the market changing and uncertainty exist
Environmental security s1 The threat degree of enterprises in the operational environment (security threat)
s2 The presentation of enterprise’operational environment in the opportunity, resource, and competition
model of the internal influencing factors in the service model selection has a good fitting degree.
As seen from the data result in Table 9, we get that most indexes have a statistical significance when the fac-tor load coefficient satisfies the condition of p< 0.05, indicating that each index has a high explaining degree to the total variance of the factor, also that the observed variables can finely explain the potential variables. From the route coefficient table, it can be seen that there are two routes that have passed the significance test.
4.2 Evaluation model of external factors
According to the proposed concept model and the research hypotheses in the former part of this paper, the AMOS7.0 software is used to represent the structural equation model of the external factors adopted in the service model selection. It can show clearly the contained variables and the variable structure in this research.
The overall evaluation of the model in this paper also adapts the method of max 1ikelihood estimates and a variety of fitting indexes.
Table10shows the overall fitting statistic value of the external influencing factor model. Here, the representa-tives of the absolute fitting indexes include the chi-square valueχ2= 1699.9, the degree of freedomdf= 350, and then the ratio of χ2/df= 4.86. The ratio value is between 2.0 and 5.0, indicating that the model is accept-able. The value of NFI is 0.832, showing a good fitting
Table 4Results of reliability test Measuring
X6 .102 .667 Remove X6
Variable 5 .678
X7 .495 .675
X10 .064 .715 Remove X10
X11 .504 .671
Table 5KMO sample measurement and the Bartlett sphericity test
Kaiser-Meyer-Olkin sample adequacy .698
Bartlett sphericity test Chi-square value 1185.734
Degrees of freedom 153
Significance probability .000
Table 6Factor analysis result of influencing factors
Items Factor 1 Factor 2 Factor 3 Factor 4
X1 .537
Eigen value 2.105 1.995 1.382 1.358
The explained variance percentage 12.696 12.085 17.679 17.542
The cumulative explained variance 12.696 24.781 42.460 60.002
degree. The comparative fitting index belongs to the third type of comparative fitting indexes, which also uses the expectation value of the chi-square of the theoretical model or the standard model under the non-central chi-square distribution for regulation besides the first type of information. The CFI value is 0.859, reflecting a good fitting degree.
Table11shows the data result of the factor load coeffi-cients and the corresponding C.R. value between each potential variable and the potential variable in the meas-urement model. Use the fixed load method, and the calculation result show that the route coefficients of the three elements of capital support, consumer demand, and technical progress have passed the test with a statis-tical significant under the condition ofp< 0.05.
4.3 Discussion of adjustment variables
Based on the features of the environment faced up by the network enterprises in the network convergence, this paper will select the environmental variables from the
four dimensions such as the technical change, the market change, the environmental competition, and the environmental security. The analysis of this part involves the dependent variable, the independent variable, and the regulation variable. Here, the dependent variable is the competitive advantages (CA) of enterprises, and the independent variables are the value proposition (X1), the value creation (X2), the value transfer (X3), and the interface rule (X4).
Suppose the dependent variable of the enterprise’s competitive advantage (CA) is a linear function of mul-tiple independent variables of X1, X2, ……Xn and the error term, we get the multiple linear regression model as follows:
CA¼β0þβ1 X1þβ2 X2þβ3 X3þβ4 X4þε
Here, CA is the dependent variable; X1, X2, X3, and X4 are the independent variables; andεis a random dis-turbance term.
This part divides the sample into two statuses according to the technical dynamics, the demand dynamics, the en-vironmental competitiveness, and the security. One is with high changing frequency with a measurement value larger than 4, and the other is with low changing frequency with a measurement value smaller than 4. When the measure-ment value equals to 4, it would be neglected. Then, the multiple linear regression analysis on effective samples is carried out, see Tables12,13,14, and15.
As seen from the Table12, we get that in the environ-ment with high changing frequency, the value propos-ition and the competitive advantages of enterprises are negatively related, while being positively related with other elements, and in the environment with low chan-ging frequency, the value proposition and value transfer and the competitive advantages of enterprises are posi-tively related, but being invalid in the significance test
Table 7Factor analysis of internal structure
Items Factor 1 Factor 2 Factor 3 Factor 4
Y1 .712
Y2 .848
Y3 .609
Y4 .667
Y5 .528
Y11 .797
Y7 .504
Y8 .647
Y9 .795
Y10 .807
Y12 .765
Y13 .781
Y14 .707
Eigen value 2.201 1.839 1.924 1.699
The explained variance percentage 14.67 12.26 12.83 11.33
The cumulative explained variance 14.67 26.93 39.76 51.09
Note 1: Adopt the principal component extraction method, and the rotation method uses the Varimax with Kaiser normalization to rotate for 12 times
Note 2: Factor 1 is the value proposition, factor 2 is the value creation, factor 3 is the value transfer, factor 4 is the value network and factor 5 is the interface rule
Table 8Fitting degree of the internal structure model
Degrees of freedom 128
Chi-square value ofχ2 535.232
CFI 0.913
NFI 0.927
RMSEA 0.098
Table 9Evaluation of the internal structure
Indexes Estimate S.E. C.R. P
Competitive advantages←value proposition .069 .096 .713 .476
Competitive advantages←value transfer .888 .237 3.740 ***
Competitive advantages←value creation .050 .159 .316 .752
Competitive advantages←interface rule .327 .157 2.083 .037
***p< 0.001
Table 10Fitting degree of the external structure model
Degrees of freedom 350
Chi-square value ofχ2 1699.9
CFI 0.859
NFI 0.832
(p≤0.05), while the value transfer and the interface rule are negatively related to the CA. Meanwhile, with the technical changing degree changes from a low level to a high level, the relation degree of the service and the enterprise’s competitive advantage increases, indicating that the technologies change faster and the influence of the service model selection to the company’s competitive advantage would be larger.
Therefore, the technological change can influence the relationship between the service model and the competi-tion advantages of enterprises, and in the environment with high technology changing frequency, the service model that has more significant influence to the compe-tition advantages can be confirmed.
As seen from the Table13, we get that in the environ-ment with high changing frequency, the value proposition, value creation, value transfer, and the interface rule posi-tively relate to the competitive advantage of enterprises, but the value proposition and the value creation have not passed the significance test (p≤0.05). In the environment with low changing frequency, the value proposition, value creation, value transfer, and the interface rule positively relate to the competitive advantage of enterprises, while the interface rule negatively relate to the CA. Meanwhile, with the technical changing degree changes from a low level to a high level, the relation degree of the service model and the enterprise’s competitive advantage in-creases, indicating that the market changes faster and the
influence of the service model selection to the company’s competitive advantage would be larger.
Therefore, the market change can influence the rela-tionship between the service model and the competition advantages of enterprises, and in the environment of high market changing, the service model that has more significant influence to the competition advantages can been confirmed.
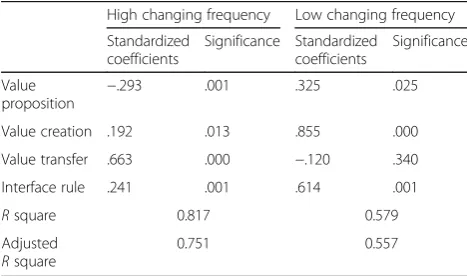
As seen from the Table14, we get that in the environ-ment with high frequency of change, the value proposition negatively relates to the CA, while value creation, value transfer, and the interface rule positively relate to the CA. In the environment with low frequency of change, the value proposition, value creation, and interface rule posi-tively relate to the CA, while the value transfer negaposi-tively relates to the CA, but the value transfer did not pass the significance test (p≤0.05). Meanwhile, with the technical changing degree changes from a low level to a high level, the relation degree of the service model and the enter-prise’s competitive advantage increases, indicating that the fiercer the competition degree, the influence of the service
Table 11Evaluation of the internal structure
Indexes Estimate S.E. C.R. P
Service model selection capital support .274 .089 3.068 .002
Service model selection consumer demand .586 .132 4.433 ***
Service model selection technical progress .531 .149 3.674 ***
Service model selection industrial development .668 .802 .833 .405
***p< 0.001
Table 12Regression model fitting of technical dynamics High changing frequency Low changing frequency
Standardized
Value creation .377 .000 −.806 .000
Value transfer .555 .000 .525 .078
Interface rule .167 .030 −.311 .003
Rsquare 0.891 0.770
Adjusted Rsquare
0.875 0.723
Predictors (constant): value proposition, value creation, value transfer, and interface rule
Dependent variable: CA
Table 13Regression model fitting of demand dynamics High changing frequency Low changing frequency
Standardized
Value creation .126 .121 .104 .039
Value transfer .496 .000 .623 .000
Interface rule .417 .000 −.459 .000
Rsquare 0.828 0.709
Adjusted Rsquare
0.795 0.701
Predictors (constant): value proposition, value creation, value transfer, and interface rule
Dependent variable: CA
Table 14Regression model fitting of competitiveness High changing frequency Low changing frequency
Standardized
Value creation .192 .013 .855 .000
Value transfer .663 .000 −.120 .340
Interface rule .241 .001 .614 .001
Rsquare 0.817 0.579
Adjusted Rsquare
0.751 0.557
Predictors (constant): value proposition, value creation, value transfer, and interface rule
model selection to the company’s competitive advantage would be larger.
Therefore, the environment competition can influence the relationship between the service model and the com-petition advantages of enterprises, and in the environ-ment of high competition degree, the service model has more significant influence to the competition advantages can be confirmed.
As seen from the Table15, we get that no matter what the environmental degree is, the results of the significant test are not ideal. However, in the environment with low environmental security, the service model and the com-petitive advantage of enterprises show a better correl-ation. Therefore, the environment security can influence the relationship between the service model and the com-petition advantages of enterprises, and in the environ-ment of low security, the service model that has more significant influence to the competition advantages can be denied.
5 Conclusions
Therefore, we conclude the following:
(1).The network convergence produces a profound influence to network service model. Network convergence promotes the expansion, extension, and refinement of network service chain and the
innovation of the industrial form. Meanwhile, it makes the network service chain show the diversified subdivision and biological systematic features. Consumer requirements also change in the direction of personalization and diversification. (2).The influence of the external structure to the
network service model is evaluated by the influence they have to the component elements of the service model. The influence of the internal and adjusting structure to the service model is evaluated by their influence on the competitive advantages.
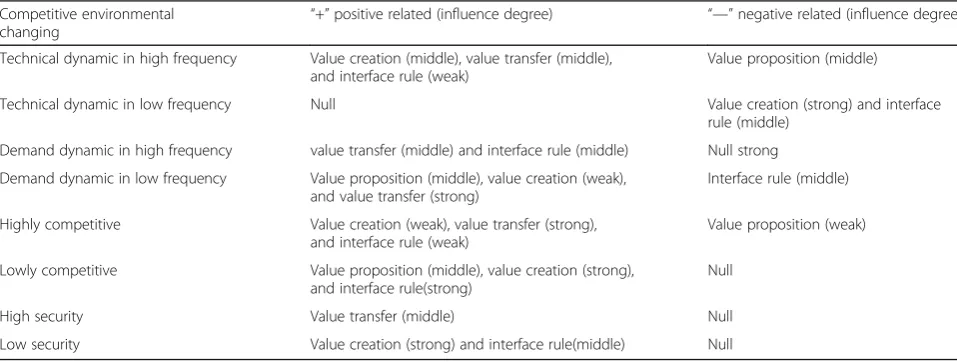
(3).Seen from the regulation variables, when it increases from a low level to a high level in aspects of the technical changing, the market changing, and the environment competition, the correlation degree between the enterprise’s competitive advantage and the service model selection will also increase. In a different environment, different elements of the network service model will have influence of different degrees on the competitive advantages, thus providing basis for deciding the regulation strategies of the service model for enterprises in different environment, see Table16. (4).The network service model under network
convergence has three characteristics, including space multidimensionality, network externalities, and system competitiveness, and the integration
Table 15Regression model fitting of security
High changing frequency Low changing frequency
Standardized coefficients
Significance Standardized coefficients
Significance
Value
proposition −
.021 .862 −.218 .186
Value creation .156 .219 .620 .002
Value transfer .447 .000 .108 .454
Interface rule .113 .307 .478 .019
Rsquare 0.371 0.824
Adjusted Rsquare
0.334 0.780
Predictors (constant): value proposition, value creation, value transfer, and interface rule
Dependent variable: CA
Table 16Influence of adjusting variables to network service model Competitive environmental
changing
“+”positive related (influence degree) “—”negative related (influence degree)
Technical dynamic in high frequency Value creation (middle), value transfer (middle), and interface rule (weak)
Value proposition (middle)
Technical dynamic in low frequency Null Value creation (strong) and interface
rule (middle)
Demand dynamic in high frequency value transfer (middle) and interface rule (middle) Null strong
Demand dynamic in low frequency Value proposition (middle), value creation (weak), and value transfer (strong)
Interface rule (middle)
Highly competitive Value creation (weak), value transfer (strong),
and interface rule (weak)
Value proposition (weak)
Lowly competitive Value proposition (middle), value creation (strong),
and interface rule(strong)
Null
High security Value transfer (middle) Null
Low security Value creation (strong) and interface rule(middle) Null
trend requests network service providers to establish a new service model based on the new environment such as transforming from a single-service model to a bilateral-service model, and develop mesh service model finally. The service model transformation can be realized by diversifying the profit source, transforming the profit center, changing the profit flow, reducing the platform cost, and other specific operating modes.
Abbreviation
4G:The fourth-generation communication system; ADSL: Asymmetric digital subscriber line; AGFI: Adjusted goodness-of-fit index; CFI: Comparative Fit Index; FTTH: Fiber to the home; GFI: Goodness-of-fit index; NFI: Normal Fit Index; RFID: Radio frequency identification; RMSEA: Root mean square error of approximation; SEM: Structural equation modeling; SRMR: Standard root mean square residual
Acknowledgements Not applicable.
Funding Not applicable.
Availability of data and materials Not applicable.
Authors’contributions
Both authors contributed equally to this work. Both authors read and approved the final manuscript.
Competing interests
The authors declare that they have no competing interests.
Publisher’s Note
Springer Nature remains neutral with regard to jurisdictional claims in published maps and institutional affiliations.
Received: 7 December 2017 Accepted: 27 January 2018
References
1. N Negroponte,Recent advances in sketch recognition(National computer conference & exposition, New York, 1973), pp. 663–675
2. W Fruin, Noah, N Montfort, et al.,The new media reader(MIT Press, Cambridge, 2003), pp. 663–677
3. Z Jianqiu, F Binxing,Theory, experience and information security of the three networks convergence(Beijing university of posts and telecommunications publishing house, Beijing, 2010)
4. Z Jianqiu, Z Jing, Industry value chain evolution and service model innovation of three networks convergence. J. Beijing Univ. Posts Telecommun. (Social Sciences Edition).13(6), 19-24 (2011)
5. T Umesao, The age of spiritual industry. Dicenda Cuadernos De Filología Hispánica57(6), 263–265 (1994)
6. J Gubbi, R Buyya, S Marusic, et al., Internet of things (IoT): A vision, architectural elements, and future directions. Future Generation Comput Syst29(7), 1645–1660 (2013)
7. D Lee, J Shin, S Lee, Network management in the era of convergence: focusing on application-based quality assessment of internet access service. Telecommun. Policy39(8), 705–716 (2015)
8. J-i Kani, J Terada, K-I Suzuki, et al., Solutions for future mobile front haul and access-network convergence. J Lightwave Tech35(3), 527–534 (2017) 9. M Ruffini, Multidimensional convergence in future 5G networks. J Lightwave
Tech35(3), 535–549 (2017)
10. RB Kline,Principles and practice of structural equation modeling (Third Ed.)
(Guilford Press, New York, 2011)
11. LJ Cronbach,Essentials of psychological testing(Harper & Row, New York, 1990) 12. TA Brown,Confirmatory factor analysis for applied research(Guilford Press,
New York, 2006)
13. R Amit, C Zott, Value creation in e-business. Strategic Manage J22(6/7), 493–520 (2005)
14. JC Guan, RCM Yam, CK Mok, et al., A study of the relationship between competitiveness and technological innovation capability based on DEA models. Eur. J. Oper. Res.170(3), 971–986 (2006)
15. HE Aldrieh, J Pfeffer, Environments of organizations. Ann Rev Sociol2(1), 79–105 (1976)
16. GG Dess, DW Beard, Dimensions of organizational task environments. Adm Sci Quart29(1), 52–73 (1984)
17. C Moorman, A S miner, The impact of organizational memory on new product performance. J. Mark. Res.34(1), 91–106 (1997)
18. JC Nunnally, IH Bernstein, The theory of measurement error. Psychometric Theory3, 209–247 (1994)
19. TK Tepper, WO Bearden, GL Hunter, Consumer’s need for uniqueness: scale development and validation. J. Consum. Res.28(6), 50–66 (2001) 20. Nalin asanka gamagedaraarachchilage, Steve Love, A game design
framework for avoiding phishing attacks. Comput. Hum. Behav.29(3), 706– 714 (2013)