MALEKAFZALI ARDAKAN, AHOO. A Multi-Zone Electrochromic Window System Integrated with Light Shelf. (Under the direction of Dr. Jianxin Hu.)
by
Ahoo Malekafzali Ardakan
A dissertation submitted to the Graduate Faculty of North Carolina State University
in partial fulfillment of the requirements for the degree of
Doctor of Philosophy
Design
Raleigh, North Carolina
2015
APPROVED BY:
_______________________________ ____________________________________ Dr. Jianxin Hu Dr. Wayne Place
Committee Chair
________________________________ ____________________________________ Dr. Nabil Nassif Dr. Stephen Terry
DEDICATION To my parents: Mehrnoosh Hemmatyar
BIOGRAPHY
ACKNOWLEDGMENTS
First, I would like to express my sincere appreciation to my advisor, Dr. Jianxin Hu for his continuous support and encouragement. Dr. Hu’s broad vision, deep knowledge and wise direction have helped me a lot in my research at NC State towards completion of this dissertation. I am also very grateful to my committee members Dr. Wayne Place, Dr. Nabil Nassif and Dr. Stephan. D. Terry, Prof. Art Rice and Josh Battles for their valuable comments and helps.
I would like to express my gratitude to Marvin Malecha, Dean of the College of Design, and Art Rice, Director of the Ph.D. program, for their financial and professional support to Ph.D students. I would like to thank Sage Electrochromic for supporting this research project and providing the IGU units, sensors and control panel for this research. In particular I would like to acknowledge Josh Battles, Troy Neirby and Dr. Neil Sbar for their input, valuable discussions and accessibility.
I also thank my colleagues and friend for Dr. Ladan Ghobad, Dr. Ghazal Falahi, Mohsen Ghiasi, Nasim Mirian, Ali Shahabi, Sepide Safavizadeh, Reza Amindarbari and Zahra Mirian for many productive discussions about the work and their assistance throughout the data collection phase.
TABLE OF CONTENTS
LIST OF TABLES ... VI LIST OF FIGURES ... VII
INTRODUCTION ...1
1.1 Significance ... 1
1.2 Description of Problem Areas ... 2
1.3 Research Goal ... 3
1.4 Dissertation Overview ... 4
REVIEW OF LITERATURE ...5
2.1 Dynamic Glazing ... 5
Liquid Crystal Switchable Glazing ... 5
Thermochromic Glazing ... 6
Electrochromic Glazing ... 8
2.2 A Literature Review on Electrochromic Glass ... 11
Background ... 12
Energy Performance ... 13
Daylighting Performance ... 16
2.2.3.1 Visual Comfort Assessment by Using Monitored Data ... 16
2.2.3.2 Radiance simulation ... 18
2.2.3.3 Visual Comfort with HDR Observations ... 19
2.2.3.4 Subjective Responses to EC Windows ... 20
Electrochromic Window Configuration ... 21
METHODOLOGY ...23
3.1 Parameter and Variables ... 23
Independent Variables ... 23
3.1.1.1 Glazing System Parameters ... 23
3.1.1.2 Sky and Solar Conditions Single Point in Time Assessment ... 27
3.1.1.3 Climate ... 28
3.1.1.4 Interior daylight zones ... 28
Dependent Variables: ... 29
Daylight Assesment: ... 30
3.1.3.1 Energy Assessment: ... 31
3.2 Research Method ... 31
3.3 Daylighting Quantity assessment ... 32
Daylighting Physical Experiment ... 32
3.3.1.1 Single Point in Time Comparison ... 37
3.3.1.2 Long-Term Monitoring ... 40
3.3.1.3 Daylight Computer Simulation ... 41
3.4 Daylight Quality Assessment ... 51
Daylight Glare ... 52
Daylight Color ... 53
Cooling and Heating Loads Modeling ... 62
Electric Lighting Modeling ... 66
RESEARCH FINDING ...69
4.1 Daylighting Performance ... 69
Point-in-Time Comparison ... 69
4.1.1.1 Single-Zone Electrochromic Window ... 69
4.1.1.2 Multi-Zone Electrochromic Window ... 70
4.1.1.3 Profile Angle Test Results ... 72
4.1.1.4 Human Perception Survey ... 81
4.1.1.5 North-Facing Test Results ... 97
4.1.1.6 Conclusion ... 105
Long-Term Monitoring ... 107
4.1.2.1 Case 1 — Clear Window ... 107
4.1.2.2 Case 2 — Electrochromic Window with the Factory Default Setting 109 4.1.2.3 Case 3 — Electrochromic Window Integrated with Light Shelf .... 110
4.2 Energy Performance ... 112
Cooling and Heating Energy Consumption ... 113
4.2.1.1 Case 1 — Clear Window ... 113
4.2.1.2 Case 2 — Electrochromic Window with Factory Default Settings . 115 4.2.1.3 Case 3 — Electrochromic Window Integrated with Light Shelf .... 118
Electric Lighting Energy Use ... 120
4.2.2.1 Case 1 — Clear Window ... 122
4.2.2.2 Case 2 — Electrochromic Window ... 125
4.2.2.3 Case 3 — Electrochromic Window Integrated with Light Shelf .... 128
Total Energy Consumption ... 131
4.2.3.1 Heating and Cooling Coefficient of Performance ... 133
CONCLUSIONS & RECOMMENDATIONS ...136
5.1 Single-Zone EC Glazing System with Default Factory Settings ... 136
5.2 Single-Zone EC Glazing System with Higher Set Points ... 137
5.3 Multi-Zone EC Window with a Higher Set Point at the Upper Glazing ... 137
5.4 Multi-Zone EC Window Integrated with Light Shelf ... 138
5.5 EC Window Simulation Methods ... 139
5.6 Recommendation for Future Studies ... 139
LIST OF TABLES
Table 1 Background Information ... 82
Table 2: Attitudinal Survey ... 83
Table 3: Test Cases ... 84
Table 4: Room Light Level ... 85
Table 5: Uniformity of Light ... 86
Table 6: Room Color Rendering ... 87
Table 7: Room Glare Sensation ... 88
Table 8: Glare Level ... 89
Table 9: Light Level for Writing and Reading Task ... 90
Table 10: Glare Sensation in Reading and Writing Task ... 91
Table 11: Glare Sensation for Writing and Reading ... 92
Table 12: Light Level for Computer Task ... 93
Table 13: Glare Sensation in Computer Task ... 94
Table 14: Glare Level Computer Task ... 94
Table 15: Color Rendering of View through Window ... 95
Table 16 Light-Shelf Visual Disturbance ... 96
Table 17: Single-Point-in-Time Profile Angle Test Result Summary ... 106
Table 18: Single-Point-in-Time North-Facing Test Result Summary ... 107
Table 19: Monitoring Test Result Summary ... 111
Table 20: Cooling, Heating, Lighting Loads ... 133
Table 21: Cooling, Heating, Lighting Loads ... 133
Table 22: Cooling, Heating and Lighting Energy Consumptions ... 134
LIST OF FIGURES
Figure 2-1 Liquid Crystal Glass Structure ... 6
Figure 2-2 Electrochromic Window ... 9
Figure 2-3 SAGE Thin Film Electrochromic Stack on Glass, TC-transparent, Conductor, CE-counter electrode, IC-ion conductor, EC-Electrochromic ... 10
Figure 2-4 EC Control Strategy ... 11
Figure 2-5 Literature Map ... 12
Figure 2-6 Radiance simulation of a private office ... 18
Figure 2-7 Time lapse luminance images ... 20
Figure 3-1: Single Zone EC window with the Factory Set Point of 3000 Lux ... 24
Figure 3-2: Multi Zone EC Window with Different Set Points in Upper and Lower Zones .. 25
Figure 3-3: Multi Zone EC Window with Different Set Points in Upper and Lower Zones Integrated with a Light-Shelf ... 26
Figure 3-4 Conventional Clear Glass Window without Any Shading Provision ... 27
Figure 3-5 Interior Zone Daylight Sensors ... 29
Figure 3-6 Interior Zone Daylight Sensors Diagram ... 29
Figure 3-7 Test-Cell Rotation ... 32
Figure 3-8 Test-Cell Section ... 33
Figure 3-9 EC Window Switch & Control Panel ... 34
Figure 3-10 EC Window System ... 35
Figure 3-11 Conventional Window System ... 36
Figure 3-12 Solar Altitude & Azimuth ... 38
Figure 3-13 Solar Profile Angle ... 38
Figure 3-14 Data Logger and Interior & Exterior Sensor ... 40
Figure 3-15 EC tint state outside illuminance ... 43
Figure 3-16 DIVA Detailed Dynamic Shading ... 45
Figure 3-22 Questionnaire – Part A and Part B ... 60
Figure 3-23 Questionnaire – Part C ... 61
Figure 3-24 EC State Threshold ... 63
Figure 3-25 Opens Studio Model of test cell ... 64
Figure 3-26 Electrochromic window energy calculation MATLAB script ... 66
Figure 3-27 Electric light control ... 68
Figure 4-1: Point-in-time Test Cases ... 71
Figure 4-2 Point in Time Test for 37 Profile Angle ... 74
Figure 4-3 Point in Time Test for 38 Profile Angle ... 75
Figure 4-4 Point in Time Test for 40 Profile Angle ... 76
Figure 4-5 Point in Time Test for 58 Profile Angle ... 77
Figure 4-6 Point in Time Test for 66 Profile Angle ... 78
Figure 4-7 Point in Time Test for 80 Profile Angle ... 79
Figure 4-8 Point in Time Test for 84 Profile Angle ... 80
Figure 4-9: Test Setting ... 81
Figure 4-10: Testing Types ... 98
Figure 4-11 North Facing Test 1 ... 99
Figure 4-12 North Facing Test 2 ... 100
Figure 4-13 North Facing Test 3 ... 101
Figure 4-14 North Facing Test 4 ... 102
Figure 4-15 North Facing Test 5 ... 103
Figure 4-16 North Facing Test 6 ... 104
Figure 4-17 North Facing Test 7 ... 105
Figure 4-18: Base Case UDI ... 109
Figure 4-19: Electrochromic Window UDI ... 110
Figure 4-20: Electrochromic Window Integrated with Light Shelf UDI ... 111
Figure 4-21: Electrochromic Window Energy Simulation ... 113
Figure 4-22: Hourly Cooling Loads for Case 1 — Clear Window ... 114
Figure 4-26: Hourly Cooling Energy Transfer for EC Window ... 117
Figure 4-27: Hourly Heating Energy Transfer for EC Window ... 117
Figure 4-28 EC window integrated with light shelf ... 118
Figure 4-29: Hourly Cooling Energy Transfer for EC Window and Light Shelf ... 119
Figure 4-30: Hourly Heating Energy Transfer for EC Window and Light Shelf ... 120
Figure 4-31Daylighting Simulation of Electrochromic Window ... 121
Figure 4-32: Electric Lighting Control System ... 122
Figure 4-33: Clear Window Interior Daylight Level ... 123
Figure 4-34: Stepped Light Power Schedule for Case 1 ... 124
Figure 4-35: Annual Hourly Electric Lighting Clear Window ... 125
Figure 4-36: Electrochromic Window Interior Daylight Level ... 126
Figure 4-37: Stepped Light Power Schedule for Case 2 ... 127
Figure 4-38: Annual Hourly Electric Lighting Electrochromic Window ... 128
Figure 4-39: Electrochromic Window Integrated with Light Shelf Interior Daylight Level 129 Figure 4-40: Stepped Light Power Schedule for Case 3 ... 130
INTRODUCTION
As one of the most important building components, windows provide daylight and views for building occupants. The benefits of daylighting include reducing energy consumption for electric lighting and subsequent cooling loads, improving occupant comfort and health, and providing a view to the outside. At the same time, there can be disadvantages associated with admitting too much daylight into a building, such as overheating, glare and lack of privacy (Reinhart, 2013). Balancing daylight admittance into the building requires careful design, because daylight has a dynamic quality —- it changes with time due to the variation of solar angle, as well as sky condition associated with the existence of clouds in the sky. Therefore, in window design, not only daylight sufficiency is crucial, but also minimizing glare and overheating is important.
In addition to windows, shading devices can also provide control over the admittance of daylight and solar heat. In general, windows with dynamic shading applications are more successful in saving energy and in reducing discomfort due to their ability to dynamically control daylight admittance, in comparison to passive shading systems (Piccolo, Pennisi, & Simone, 2009).
1.1 Significance
Recent estimates suggest that windows account for about 40% of total building energy costs (Efficiency, 2009).Due to the increasing trend of using glass on building façades, improving the energy efficiency of windows seems to be more important. Advanced fenestration systems have thus been developed to improve building efficiency, thermal comfort, and cost effectiveness (Hatton et al., 2013). Multi-pane windows, reflective glazing, and low-emissivity (low-e) coatings are all technologies that have improved window and building efficiency. This study focuses on switchable variable-tint electrochromic (EC) windows, which offer the potential to significantly reduce building energy use and peak demand by impacting heating, cooling, and lighting energy consumptions. This new technology has sparked a considerable amount of interest from architects and building owners (E. S. Lee, Selkowitz, et al., 2006).
1.2 Description of Problem Areas
EC windows can be more energy-efficient compared to static conventional window solutions, because they can actively manage daylight and solar heat gains in real time, thus reducing electric lighting and HVAC system energy consumption (E. S. Lee, Selkowitz, et al., 2006). However, EC windows can have the following potential issues:
Daylight quantity issue — In order to reduce the human discomfort caused by solar
sunlight is present. While this strategy maintains the light level within an optimal range for the perimeter zones, it can make the inner zones of the floor dark.
Daylight quality issue — When the sun is visible through the window, EC glazing, even darkened to its lowest level, can still admit a noticeably disturbing glare to users. Other shading devices, such as blinds, may be used under these circumstances. However, the deployment of these shading devices can increase lighting energy use and cut off the view to the outside, since occupants tend to leave shades down long after the period of visual discomfort has passed (Rubin, Collins, & Tibbott, 1978).
1.3 Research Goal
The goal of this research project is to optimize the EC glazing application in buildings to improve visual comfort and energy efficiency. Field tests along with computer simulations have been conducted to assess the new control algorithms and system configurations proposed in the project to improve EC performance. Specifically, the research objectives and tasks are:
• Evaluate the current single-zone EC application and control strategy provided by Sage Glass.
• Propose and evaluate new control algorithms for the single-zone EC application to optimize the indoor daylight distribution from perimeter to inner zones.
• Compare the above single-zone and multi-zone EC systems with conventional wall-based daylighting strategies in terms of daylighting and thermal performances.
1.4 Dissertation Overview
REVIEW OF LITERATURE
2.1 Dynamic Glazing
Switchable windows have been developed by using a variety of processes and materials. Universities and national laboratories are researching new materials and processes to improve these products. Commercial companies throughout the world are also in the business of developing dynamic glazing products. For building applications, conventional glazing only offers fixed transmittance and control of energy passing through it. Given the wide range of illumination conditions, a dynamic glazing with adjustable transmittance potentially offers the best solution (Lampert, 2001). This section includes an overview of various types of switchable glazing products, such as liquid crystal, thermochromic, and electrochromic glazing.
Liquid Crystal Switchable Glazing
One of the drawbacks of liquid crystal glazing is that it does not provide energy filtering. This problem can be solved by inserting silica aerogel granules controlled by an automated and reversible mechanical device between the glass panes that has a low U-value with a high visual transmittance (Reim et al., 2005). However this method prevents transparency. Primary tests have shown that, because aerogel granules leave powder inside the glass cavity, the process is not completely reversible when the granules are removed to raise the U-value or to improve visibility (Reim et al., 2005).
Figure 2-2-1 Liquid Crystal Glass Structure
Thermochromic Glazing
automatically. In this process, neither electrical power nor driving unit is required. Thermochromic glasses are basically laminated glazing (TLG) with a polymeric interlayer doped with complexes of transition metals that change their coordination, and hence the transmission or color of the layer, under the influence of light and heat fluxes. Daylighting regulation in TLG glass happens by color transition in neutral color conversions from light to dark (gray or brown), and in colored ones from rosy or yellow to blue or green (Arutjunjan et al., 2003).
Thermochromic windows have a great advantage in reducing energy consumption due to the fact that they block near infrared solar transmittance (most of the heat from the sun comes in these wavelengths) in the summer and allows it in the winter. It is reported that one can lower an electricity bill by 30% in summer alone and can save energy if these windows are used in automobiles (S. Selkowitz, Lampert, & Granqvist, 1990). In a study by Arutjunjan et al., TLG in combination with low-E glass was studied. Energy modeling of the heat transfer in ventilated façades has shown that TLG can provide a reduction of 15-30% in the building energy consumption during the winter heating season in the climatic conditions of certain regions in Russia. During the summer cooling season, the reduction of solar heat gain reaches 30-40% and it is enough for occupants to stay comfortable without air conditioning (Arutjunjan et al., 2003).
tungsten doping. These coatings can be applied in a process compatible with commercial glass manufacture. The current problems with thermochromic glass products are:
1. Yellow-brownish color in the thermochromic films
2. Large area production which requires the precursor chemistry work on an industrial scale
3. Weathering of the coating in harsh environmental conditions (Parkin & Manning, 2006)
Commercial thermochromic glass has a large potential market in homes, offices, and factories as well as automotive applications (Parkin & Manning, 2006). Thermochromic materials are affordable and have a service life of over a dozen years, which makes it possible to create regulated cover heating for “zero net energy” houses (Arutjunjan et al., 2003).
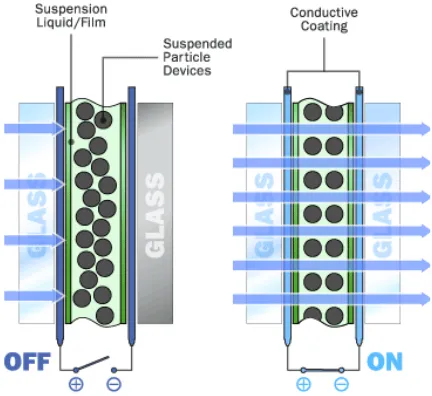
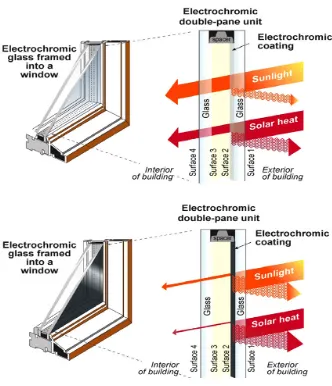
Electrochromic Glazing
Figure 2-2 Electrochromic Window
Figure 2-3 SAGE Thin Film Electrochromic Stack on Glass, TC-transparent, Conductor, CE-counter electrode, IC-ion conductor, EC-Electrochromic
Figure 2-4 EC Control Strategy
2.2 A Literature Review on Electrochromic Glass
Figure 2-5 Literature Map
Background
A three-year field test program was initiated in Lawrence Berkeley National Laboratory in 2002 after the preliminary field test in 1999. This program focused on conducting field trials of emerging EC window prototypes for residential and commercial building applications. In this program, the R&D work supported by the Department of Energy generated many novel EC material concepts, and also established the durability test procedures and verified the EC prototypes’ long-term durability. The newly developed EC coating also improved performance and had lower manufacturing cost compared to older prototypes (E. S. Lee, Selkowitz, et al., 2006).
A U.S. manufacturer, SAGE Electrochromic, began, in the late 1990s, supplying small (0.46 x 0.89 meters, 18 x 35 inches) glazed units with “on-off” switching to a skylight manufacturer (Velux) to test the markets in the U.S., and began producing large-area EC windows and skylights (up to 1.1 x1.5 meters, 42.5 x 60 inches) with on/off switching in early 2006.
Energy Performance
Based on a DOE-2.1 simulation study reported by Lee, Yazdanian & Selkowtiz, the application of EC windows in commercial buildings in most climates could reduce energy use by up to 10-20%, compared to low-E windows with daylighting controls without shading. Peak demand for the same conditions could be reduced by 20-30%. The emerging electrochromic windows with daylighting controls were projected to save approximately 91.5-97.3 x 10¹² Btu in the year 2030, compared to spectrally selective low-E windows with manually controlled interior shades and with no daylighting controls, given that EC window reaches a 40% market penetration level in that year (E. Lee, Yazdanian, & Selkowitz, 2004).
Another simulation study using eQuest concluded that EC windows could save energy up to 45%, compared to single pane static glazing. In this study, an eight-story commercial office building was modeled in three U.S. climate zones, covering a range of environmental exposure conditions from hot and dry (Arizona) to very cold (Minnesota). When EC glass was compared with ASHRAE 90.1 2007 code-compliant glazing, energy savings greater than 20% were calculated for the same building configuration (Sbar et al., 2012).
Compared to a low-E window with the same daylighting control system, the electrochromic window showed annual peak cooling load reductions of 19–26% and lighting energy use savings of 48–67% when controlled for visual comfort (E. S. Lee, Selkowitz, et al., 2006). This study offered data from simulations, laboratory tests, and a 2.5-year field test of prototype large-area electrochromic windows evaluated under outdoor solar and sky conditions.
Daylighting Performance
In general, most of the studies on electrochromic windows have been focused on energy efficiency benefits of these products and there has been less research that represents the enhancements of visual performance of the EC windows. The limited studies dedicated to the daylighting analysis of EC windows included different approaches to investigating daylighting performance.
2.2.3.1 Visual Comfort Assessment by Using Monitored Data
In a study by E. S. Lee et al., an analysis of the monitored data collected from a test bed was conducted to assess the differences in visual comfort for various EC control options. Over a 2.5-year period, illuminance and luminance levels were measured at various points in each test room every minute. Several performance metrics were applied to assess visual comfort and lighting quality: average daily illuminance, average daily luminance ratios, weighted daily average daylight glare index, percentage of time the window luminance exceeded 3000 cd/m2, and probability that the blind would be lowered based on the probabilistic fit derived from the subjective study (E. S. Lee, Selkowitz, et al., 2006).
brightness. Results indicated that, for south-facing windows, enhanced daylight control provided by electrochromic light modulation could be suitable for maintaining acceptable visual comfort conditions in the indoor environment.
2.2.3.2 Radiance simulation
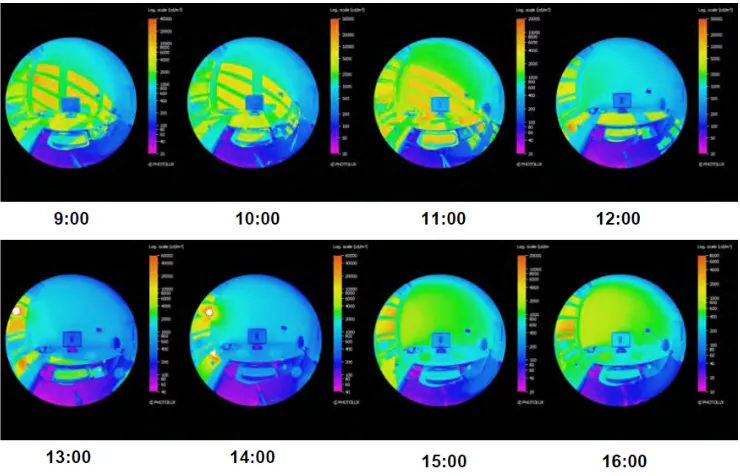
2.2.3.3 Visual Comfort with HDR Observations
The Lawrence Berkeley National Laboratory research team explored new metrics and developed more effective techniques for assessing visual comfort. Figure 2-7 shows the images of a test room captured every 12 minutes over the course of each day during a four-month field test. Bracketed digital photographic images of the same scene were combined to create high dynamic range (HDR) luminance images. Automated image analysis tools were created to extract detailed luminance ratio data, glare source data, and illuminance data. These images, along with additional webcam images taken every six minutes, were used to document and diagnose EC operations in the test rooms (E. S. Lee, Selkowitz, et al., 2006).
This study focused on the question of whether visual comfort requirements could be met in an office space with a large-area EC window that is fully darkened. Under clear skies on equinox or solstices, the EC window at 5% visible light transmittance was tested.
Figure 2-7 Time lapse luminance images
2.2.3.4 Subjective Responses to EC Windows
cloudy 50% of the time, partly cloudy 25% of the time, and clear skies for the remaining 25% of the time. The solar profile angle was around 24º to 44º. Due to the low solar profile angle, this subjective study presented the “worst” case scenario for the EC window and Venetian blinds to control glare (E. S. Lee, Selkowitz, et al., 2006); (Clear, Inkarojrit, & Lee, 2006). The occupants indicated the EC window system was significantly more desirable than the reference window. The preferences were strongly related to perceived reductions of glare, reflections on the computer monitor, and window luminance. Blinds were fully raised during 77–79% of the automated EC-mode sessions versus only 38% of the reference sessions. The EC glazing color and room appearance were considered to be satisfactory. Subjects often faced the EC window to do computer-based tasks despite the complaints regarding glare or brightness. If the reference case had a lower transmittance window, complaints of glare and use of blinds would likely occur less for these winter solar conditions, but energy savings would be lower as well.
Electrochromic Window Configuration
In another study by the Lawrence Berkeley National Laboratory (LBNL), various control strategies as well as multi-zone EC window configurations were studied (E. S. Lee et al., 2006; Tavil & Lee, 2006). Tavil and Lee studied the effect of integrating overhangs with EC, where EC windows were protected by overhangs from the direct sun (E. S. Lee & Tavil, 2007; Tavil & Lee, 2006).
METHODOLOGY
3.1 Parameter and Variables
Independent Variables
Independent variables in this study include:
• Glazing system parameters, representing various EC window control algorithms
and configurations;
• Sky and solar conditions, including overcast sky, blue sky, and blue sky with the
solar component; and
• Climate at the project site
3.1.1.1 Glazing System Parameters
Single-zone EC windows with a single illuminance set point
The first EC window configuration considered is the single zone EC window with 3000 Lux set point, which is the factory default setting. For simulating this condition in the test cell, both upper and lower windows are adjusted to 3000 (Lux) set point (Figure 3-1).
Figure 3-1: Single Zone EC window with the Factory Set Point of 3000 Lux
Multi-zone EC window without static shading devices
A multi-zone EC window is also considered for potential improvement over the single zone configuration. In the multi-zone EC window, the upper and lower windows are set to have different set points, which result in different values of Visible Light Transmittance (VLT) in each of the zones. For example, while the set point of the lower zone remains 3000 lux, the upper zone can be set at 100,000 lux to increase the VLT through the glazing in this zone to admit more daylight for illuminating the inner areas away from the window.
Figure 3-2: Multi Zone EC Window with Different Set Points in Upper and Lower Zones
Multi-zone EC window integrated with interior light shelf
A light shelf is a small area of horizontal reflecting surface (typically 4 – 6 feet deep) mounted just below the upper daylight glazing in the façade. Typically, the designer of the building will have a high degree of control over the placement and optical properties of that reflective surface, which makes it a much better candidate light- reflecting source than the ground plane. Furthermore, this reflecting surface can be placed above eyelevel for the building occupants, thereby avoiding the potentially severe glare effects of intense upward light in the eyes of occupants near the window. There are two functions to a light shelf system: to reflect light deeper into the building, thereby providing more light in the interior, and to block excessive light from entering spaces close to the perimeter wall.
different set points. It is intended to block the direct glare and project daylight deeper into the space to create more uniform daylight distribution.
Figure 3-3: Multi Zone EC Window with Different Set Points in Upper and Lower Zones Integrated with a Light-Shelf
Regular glass without any shading strategies (Base case)
In order to compare the daylighting and energy performances between various EC-based systems and conventional windows, a double pane low-E glazing is installed on the other side of the test cell as a base case. Two black curtains with a 20-foot distance from each window divide the room into two equal spaces. Therefore, for testing one side of the test cell, the farther curtain is deployed and data from the sensors inside the enclosed space are collected (Figure 3-4).
Figure 3-4 Conventional Clear Glass Window without Any Shading Provision
3.1.1.2 Sky and Solar Conditions Single Point in Time Assessment
Overcast sky is the meteorological condition of clouds obscuring all of the sky. The amount of light received from an overcast sky depends on the cloud pattern, geographic location, time, and the density and uniformity of the clouds. In order to verify that a certain sky condition qualifies as overcast, two values need to be measured: global illuminance, which is measured from un-shaded sensor with an unobstructed view of the sky, and diffuse illuminance, which is measured by a shaded sensor at the same time. The ratio of the diffuse-to-global illuminance should exceed 0.90 for a sky condition to be considered overcast (Love & Navvab, 1991).
Blue Sky Only
Blue sky is the sky with less than 30% of cloud coverage. Depending on the cloud movement, the sun may or may not be observed in the sky. To simplify the daylighting
analysis process, the systems are assessed first under the blue sky without the solar component.
Blue Sky with Solar Component
A blue sky with the solar component is the condition when the sky is clear and the sun is not covered by clouds. In this case, the daylight availibility depends on the solar position that is defined by sun altitude and azimuthal angles. Qualifying clear sky with the sun is more complex due to the variation in solar angles.
3.1.1.3 Climate
Climate-based daylighting modeling is the prediction of various luminous quantities using sun and sky conditions that are derived from meteorological datasets. Building location is an important parameter in assessing climate-based EC performance. Raleigh, North Carolina was selected as the primary location for the field-testing phase and the weather file for this location is obtained from the Department of Energy weather file database (TMY weather files).
3.1.1.4 Interior daylight zones
Figure 3-5 Interior Zone Daylight Sensors
Figure 3-6 Interior Zone Daylight Sensors Diagram
Dependent Variables:
Daylight Assesment:
The daylight performance evaluation is based on various daylighting metrics in order to assess daylight quality and quantity:
• Illuminance (lux): the quantity of daylight incident on various points on the task plane.
• Coeffient of Utilization: the ratio of the illuminance on the work plane to the illuminance incident on the vertical glazing. A difficulty in assessing a daylighting system is the variability of light from the sky and sun, which are constantly changing. This makes it critical to use a coefficient to establish the relationship between exterior light level and interior light level, so that even though the exterior lighting conditions change, this coefficient can indicate the ability of the system to deliver daylight into a space.
• Spatial Daylight Autonomy (sDA): the percentage of floor area that exceeds 300 lux for more than 50% of occupied hours. Occupied hours have been defined from 8 a.m. to 6 p.m.
• Annual Sunlight Exposure (ASE): the percent of analysis area that exceeds a specified illuminance level (1000 lux) for more than 250 hours per year.
• UDI: the percentage of the occupied time in a space that the illuminance level on the task surface is between 100 and 2000 lux.
3.1.3.1 Energy Assessment:
The EC window configurations are assessed in terms of energy consumptions for cooling, heating, and lighting. They are also compared with a base case of conventional window system (the regular double pane low-e glazing). Total energy use and Energy Use Intensity (EUI) are reported for each configuration.
3.2 Research Method
Physical experiment is the primary method for assessing daylighting performance. The first phase assessment focuses on the single-point-in-time testing on the EC window configurations and other systems outlined above. The configurations and algorithms are evaluated and optimized based on this preliminary assessment. The second phase assessment focuses on climate-based daylight modeling. The promising systems identified in the first phase are monitored for an extended period of time under real sky conditions in Raleigh, North Carolina. Phase III focuses on thermal analyses for the proposed EC window configurations and control algorithms.
Matlab toolbox provides a control development workflow as well as graphical front-ends for designing advanced control strategies, in which the building simulation is carried out by EnergyPlus while the controllers are implemented in Matlab codes.
3.3 Daylighting Quantity assessment
Daylighting Physical Experiment
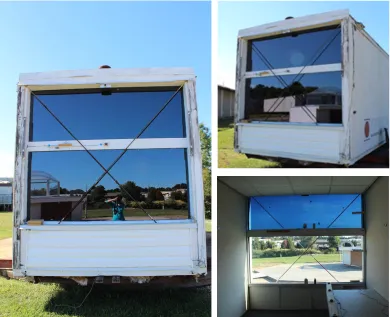
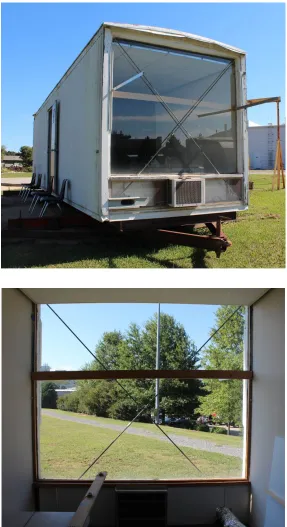
EC window switching operations are dependent on the size of the window, temperature of the device, frequency of commands issued to the EC window, and response time of the EC controller to these commands. While simulation programs provide useful insights into the whole building annual energy use, field tests supplement this information by providing detailed performance information under real sun and sky conditions (E. S. Lee, DiBartolomeo, & Selkowitz, 2006). The first phase of the research therefore is conducted in a near full scale rotatable test cell at the Daylighting Research Lab in North Carolina State University (Figure 3-7).
Figure 3-8 Test-Cell Section
Two pieces of Sage electrochromic glass (upper zone and lower zone) have been installed at one end of the cell. This allows for a multizone configuration with different set points between upper and lower glazing and for a single zone configuration with the same set point for both upper and lower glazing. The EC windows and their interior and exterior sensors are wired to a control panel provided by Sage Glass (Figure 3-9). An ethernet cable connects the control panel to a computer where the control software developed by Sage Glass is installed. Set points are established in the software as a parameter. An override switch is also provided by the manufactuerer for each piece of glass. The switch can overwrite the automatic control mode for an extended period of time (e.g., 2 hours).
Figure 3-10 EC Window System
3.3.1.1 Single Point in Time Comparison
At the EC end of the test cell, different configurations can be swapped in a fairly rapid manner for comparions under the same sky and solar conditions. The rotatable feature of test cell also makes it possible to compare the systems between the two ends and simulate various sky/solar condidtions. For example, at a single point in time, daylighting performance of EC window at one side of the test cell can be assessed against the conventional system mounted at the other end after quickly rotating the test cell, given that the sky condition stays stable during this short period.
In Phase I, the systems will be tested under the following sky and solar conditions: A. Overcast sky:
Data are collected when an overcast day is identified. B. Blue sky without solar component:
To simulate a clear sky without the solar component, a sunny day is selected to run the experiments. The test cell is rotated to face a direction where the sun is not visible through window (e.g., facing north).
C. Blue sky with the solar component:
difficult to simulate a wide open office area under solar angles except for at noon. Therefore, the concept of solar profile angle is adopted as a method to simulate wider spaces (Hu, 2003).
Figure 3-12 Solar Altitude & Azimuth
Solar profile angle is defined as the apparent angle of the sun above the horizon in a plane normal to the building façade. Profile angle translates sun position into a two-dimensional vertical plane (figure 3-13).
Tan(Ω) = Tan(β) / Cos(γ)
Ω =Profile Angle β = Solar Altitude γ = Solar Azimuth Solar Altitude (β)
Different solar positions could provide the same profile angle by this definition. Previous studies (Saraiji & Mistrick, 1993) showed that the system performances under these solar positions, which share the same profile angle, turned out to be consistent. Therefore, the profile angle is a valid parameter to represent solar positions and this theory greatly simplifies the experimental procedures.
Coefficient of utilization (CU) is used as a performace indicator in addition to illuminance values (lux) to assess the daylighting performance in terms of daylight quantity. CU, which reports the ratio of the illuminance on the work plane to the illuminance incident on the vertical glazing, expresses the efficiency of a room and its fenestration as a lighting system. This will eliminate the inconsistencies caused by the slight fluctuation of the outside sky condition during the short period of time when the sytems are being switched.
There are 16 Licor photometer sensors installed at the desk height facing upward with two-foot spacing in the test cell. An exterior sensor is mounted outside on a vertical plane facing the same direction as the window. Two interior sensors are also mounted on vertical planes behind the two pieces EC glass. The Visible light transmittance of each glazing zone can thus be calculated between the exterior and interior sensors. Illuminace values at these sensors were recorded by a Campbell Scientific R1000 data logger.
Figure 3-14 Data Logger and Interior & Exterior Sensor
3.3.1.2 Long-Term Monitoring
The EC systems/algorithms from Phase I are also monitored for an extended period of time (e.g., one month) under real sky conditions. During these long-term experiments, daylighting iluminance values of various interior and exterior sensors are measured at a 30-second interval.
3.3.1.3 Daylight Computer Simulation
There are very few simulation tools that have the capability to model and simulate dynamic shading properties. Among these simulation tools, DOE-2.1, eQuest, BEopt, IECC, and Comfen have been investigated in earlier studies (Hitchcock, Mitchell, Yazdanian, Lee, & Huizenga, 2008).
DIVA, another integrated whole-building simulation tool, has the option to simulate EC window under advanced shading control. Diva is an integrated simulation tool that can be installed as a plug-in on Rhinoceroses. It can perform both daylighting and energy simulations. Diva uses radiance and energy-plus as the daylighting and energy simulation engines respectively (GHOBAD, ARDAKAN, Hu, & Place, 2013). Since DIVA 2.0 Beta version was released, automated switchable (electrochromic) shading was added under “Detailed Advance Shading.” EC shading component of DIVA has the option to define an unlimited number of shading states for EC to be associated with specific glazing materials. By selecting electrochromic as a shading type, DIVA provides five different options for glazing operation, including:
− Manual
− Automated Thermal Control
− Automated Thermal Control with Occupancy
− Automated Glare Control
In this section, the accuracy of the advanced EC shading module of the DIVA simulation tool is investigated. The calibration is performed by comparing the variation of the visible light transmittance in DIVA simulation model and in physical experimental model.
A private office with south-facing EC windows is modelled in the DIVA simulation tool. Different tinted states of EC glass material are modelled in the computer model. The same office space is also modelled and monitored in the test cell equipped with an electrochromic window under the real sky.
Set point adjustment:
In the EC system in real buildings, to dynamically adjust EC window tinting states, a maximum target illuminance level (set point) is set to control the tinting process. If the reading of a redefined daylight sensor exceeds the upper threshold, the EC will tint to the next shading state to maintain the stable daylight level.
However, for simulating EC windows in DIVA, control algorithms need to be developed by defining the minimum and maximum thresholds, which determine the state of the glazing. Since the set point definition in DIVA is different from that defined in the real building application, the minimum and maximum thresholds of each EC state need to be interpreted from the monitored data.
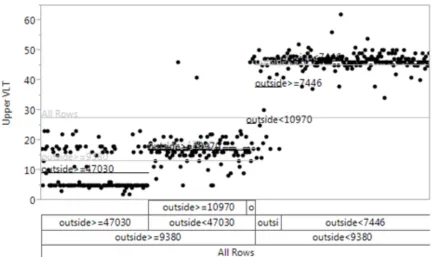
the EC glass, different tint states can be correlated with exterior daylight level incidents on the glazing.
Figure 3-15 EC tint state outside illuminance
Electrochromic Tint states:
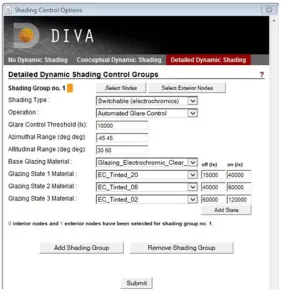
materials in the DIVA material library need to be matched with the states of EC glazing installed in the test cell, which means the electrochromic tinted material with 20%, 6% and 1% visible transmittance must be scripted into the material.rad file to be accessible through DIVA control tab.
tn = ( √ (0.8402528435+0.0072522239(Tn2)) - 0.9166530661)/0.0036261119/Tn ) The definition for Electrochromic glass material with a 63%, 20% and 1% VLT would be:
Figure 3-16 DIVA Detailed Dynamic Shading
Weather data:
reflect the same environmental conditions of the experiments are needed in the calibration process.
NCSU Daylighting Lab has a weather data collection station where two pyrometers are available to collect solar irradiance: one equipped with a shadow band for diffuse solar radiation measurement, the other without shadow band for global solar radiation measurement.
Figure 3-17 NCSU Daylighting Lab Weather Station
For customizing Raleigh weather data, Element, an open source tool, is used. This software has an option to calculate unknown variables based on the measured data. In this case, the normal solar radiation is calculated based on the measured global and diffuse solar radiation values collected from the weather station.
Figure 3-18 Element
DIVA Daylight Model
Discussion and result analysis
For comparing the electrochromic window tinting patterns in DIVA versus experiments, EC tint states are compared at each of the occupied hours. To find the EC window tint states at each time step in the physical experiment, two vertical photometers are installed in the test-cell — one mounted on the exterior window frame, one on the interior frame, with both facing outside. Visible light transmittance values are calculated by dividing the reading from the interior sensor by the reading from the exterior one.
In the DIVA simulation, the EC shading schedule is available from the “detailed dynamic shading” file automatically stored in the result folder after running the climate-based daylighting simulation.
The data collected from the six-week period are then compared with simulation results within the occupied hours. The comparisons are reported for each week separately in Figure 3-19. In each graph, the vertical axis shows the visible light transmittance of the EC window, which is associated with different tint states including: 6%, 20% and 63%. The horizontal axis shows the occupied hours (8 a.m. to 6 p.m.) in seven days of week.
The inconsistency of electrochromic glazing behaviour in physical testing and simulation can be explained with the reasons below:
− Some physical properties of EC material, such as the delay in responding to the controller and sensitivity to temperature, are not considered in computer simulation
− The custom weather data created for this experiment are derived from the global and diffuse radiation measurements collected in the NCSU weather station and incorporated into the Raleigh/Durham TMY weather data. Other parameters of the weather data, such as normal radiation and dew point temperature, are not accurate.
− In the DIVA advanced shading setting page, both interior and exterior sensors are assigned to the same set points associated to each EC state. However, in real experiments, there are large differences between interior and exterior sensor readings.
3.4 Daylight Quality Assessment
the brightness in space can be changed by the retina when there is a moving object in its visual field (Reinhart, 2013).
Light also has a nonvisual effect on the human body. There is a non-visual light receptor in the retina that can affect the alertness, mood, memory and health of people (Heschong & Saxena, 2013). For instance, seasonal differences in light exposure have been associated with common diseases, such as Seasonal Affective Disorder (SAD). Patients with SAD experience periods of depression due to insufficient light exposure during winter months in higher latitudes.
Assessing the daylight quality of a system can be more complex than measuring the quantitative aspect of daylight. There are cases where the daylight levels are in the useful range, but the daylit environment is not visually comfortable for occupants.
Daylight Glare
luminance distribution within the field of view or by high contrast of luminance values between the glare source (e.g., window) and its surroundings.
The visual discomfort caused by glare triggers the fact that the eyes need to rapidly adjust to new light levels. The adaptation to brighter light at any given time requires varying the aperture size of eye pupils. This adaptation is a slow chemical process that involves calibration of the rods and cones, which might take up to 10 minutes. Regaining the maximum sensibility of rods may take up to an hour (Reinhart, 2013).
Daylight Color
Sunlight contains sufficient photons at all wavelengths across the visible spectrum including electromagnetic radiation with 400 nm to 700 nm wavelength. Mixture of various wavelengths that individually generate a unique color sensation, such as red, green, blue, etc., creates a neutral color appearance for sunlight. The differential refraction of light as a function of wavelength creates a continuous band that appears as rainbow color. This reflects the fact that color is more associated with light than the property of objects (Chaudhuri, 2011).
negative impressions such as active, strong, passionate, and warm, but on the other hand aggressive, bloody, raging and intense. Green has been found to have a retiring and relaxing effect. It too has both positive and negative impressions, such as refreshment, quietness, naturalness, and conversely tiredness and guilt (NAz & Epps, 2004).
Colors based on their dominant wavelength can be described in temperature terms, such as "warm" or "cool." Cool colors, such as blue, green, or purple, are generally considered to be restful and quiet, while warm colors, such as red, yellow, and orange, are seen as active and stimulating. Studies by Kwallek et. le & Mahnke suggested that people exposed to red and yellow colors reported higher levels of anxiety than did people exposed to cool blue and green colors (NAz & Epps, 2004).
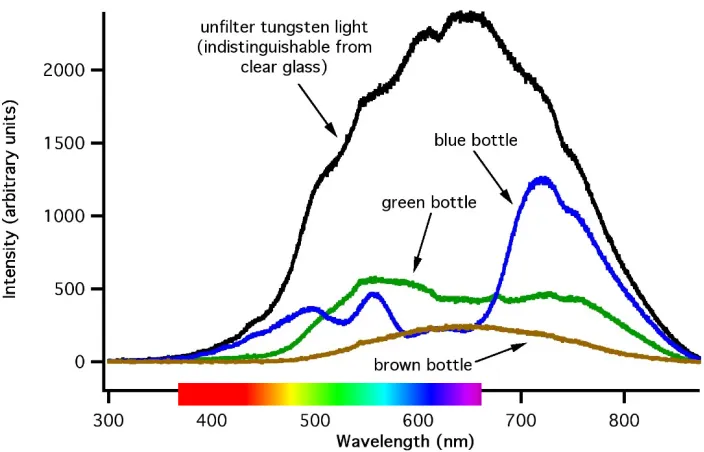
Given the importance of the light color on human visual perception, it’s crucial to consider how window glazing material can affect the transmitted light through a window in terms of intensity and wavelength. Figure 3-8 shows the differences between the wavelengths of light transmitted through the clear glass versus blue and green tinted glass; it’s clearly noticeable that glazing with various tint color filters the natural light differently. Long-term exposure to specific wavelengths of light instead of natural light might have negative psychological effect on humans.
Questionnaire
The color in the tinted states of electrochromic glazing raises the question of whether the color effect of the window will affect occupants’ perception under long-term exposures. In 2006, Clear et al. studied a group of 43 subjects working in a private office with switchable electrochromic windows whose visible transmittance ranged from approximately 3% to 60%. The subjects were asked to respond to a questionnaire on two different control methods for electrochromic windows (Clear et al., 2006).
In the present research, in order to have a qualitative assessment of the EC systems, surveys are conducted to collect human responses by using a questionnaire as the instrument. Groups of participants are invited to the NCSU daylighting lab to participate in the surveys. They are asked to fill out a questionnaire during the sessions in the rotatable test cell where the electrochromic window is installed. The survey consists of three sessions under a clear sky with solar component (Figure 3-21):
- In the first session, the EC window with the single zone configuration is tested under a clear sky facing the sun. Participants will be asked to fill out the questionnaire when both the upper and lower glazing is set to have a 20% visible light transmittance (VLT).
- The second session is similar to the first session except that both the upper and lower glazing is set to have a 6% VLT.
multi-are set to have a 63% and 20% VLT, respectively. Similarly, this configuration is tested under a clear sky with the sun component.
Conducting a survey for the three configurations is beneficial to assess the qualitative performance of the EC window when it is under the clear sky with sunlight incident on the glass. With the Sage Glass factory default set point, the EC window will likely to tint to its lowest states — 6% (or even 1% in some cases). However, the set point can be raised to obtain the state of 20% VLT, which is the case in the first session, as a comparison to the factory default of 6% VLT. The set point can be raised even higher to achieve the state of 63% for the upper glazing in the third session that involves the multi-zone EC window with a light shelf. The goal of this survey is therefore to evaluate human perception toward three EC window configurations and glazing VLTs under clear sky with the sun component, which is the worst-case scenario in terms of glare.
Since different activities have different lighting requirements, participants are asked to fill out the questionnaire while they are:
1. reading and writing 2. working with a computer 3. looking at the window
The questions are grouped into the following categories:
A. General Information: Participants’ age, gender, education, etc.
B. Attitude: The participants’ attitude on lighting characteristics will be addressed in this category — for instance, their attitude toward the view to the outside. The purpose is to see if there are any correlations between their attitude and perception.
C. Perception: Questions in this category are designed to address the perception of the participants of light quality in each of the three sessions. The questions in this section are identical for each session. Various aspects of daylight quality, such as visual comfort, glare, daylight color, etc., are addressed in this part of the questionnaire.
3.5 Energy Assessment
Cooling and Heating Loads Modeling
To analyze cooling and heating loads of various EC window configurations, multiple simulation tools are investigated, such as MLE+, which is a co-simulation environment that involves EnergyPlus as the simulation engine and applies certain control logics in MATLAB. However, the dynamic nature of the EC makes it very challenging to simulate the systems that are constantly changing their parameters (e.g., VLT and SHGC). In order to overcome this challenge, a variation of the co-simulation environment is developed. This method involves using MATLAB scripts to “judge” the tinting state of the EC window at any time step, and using EnergyPlus and DIVA to simulate the static model with that specific tinting state for thermal and lighting performances.
EC State Lower Threshold Upper Threshold
63% VLT 0 Lux 8772 Lux
20% VLT 8772 Lux 27237 Lux
6% VLT 27237 Lux 101449 Lux
1% VLT 101449 Lux _
Figure 3-24 EC State Threshold
DIVA Daylighting Simulation
EnergyPlus Simulation
When the OpenStudio model is exported to EnergyPlus as an IDF file, four meters are added under the output meter with hourly reporting frequency:
− Cooling Energy Transfer
− Heating Energy Transfer
− Interior Light Electricity
− Interior Equipment Electricity
Another adjustment made to the IDF file is to change the glazing material from “template construction” into electrochromic glazing tint states (the process of adding EC tint state materials has been explained in Section 3.7.1.2). The next step is to run simulations with all four states of the EC window in each configuration.
Figure 3-26 Electrochromic window energy calculation MATLAB script
Electric Lighting Modeling
electric light requirements based on daylight analysis. Since the comparison between the EC module in DIVA and the measured data has shown a considerable difference, a method similar to the one used for calculating thermal loads above is developed for finding the annual hourly daylight levels at the three daylit zones. This method also involves using MATLAB scripts to determine the tint state of the EC window and using DIVA for simulating static models with specific tint states.
DIVA daylighting simulations are conducted four times with each of the four EC window tint states. A “for” loop is written to check the outside illuminance at each time step and, based on the EC control algorithm (Figure 3.24), a new file is created that has the illuminance values of the EC state that corresponds to the outside vertical illuminance. The new climate-based daylighting simulation results have 10 columns of illuminance values for 10 daylight sensors in the model. The first number represented the outside illuminance and the rest nice numbers are from interior analysis nodes. The nine interior sensors are then grouped to three daylit zones and average illuminance values are calculated for each daylight zone.
Daylight Level Fraction of electric lighting
0-150 lux 100%
150-300 lux 50%
300 lux-higher 0%
RESEARCH FINDING
4.1 Daylighting Performance
Point-in-Time Comparison
EC glass can switch from a clear to fully darkened state and can be held at two intermediate tinted states. During the switching process, visual and thermal properties of the glass vary and each state of the EC glass has a specific visual light transmittance (VLT) and solar heat gain coefficient (SHGC). At the clear state, EC has a 63% VLT which can drop to 20%, 6% (intermediate states), and 1% at the fully darkened state.
Six window configurations, which are categorized as single-zone and multi-zone systems, are tested under real sky conditions in this phase:
4.1.1.1 Single-Zone Electrochromic Window
• The first single zone system has the VLT of the entire glazing area set at 63%. This case represents the regular static glazing with double pane Low-E glazing and is tested under both profile angle (blue sky with solar component) and north-facing condition (blue sky only) (Test Case 1, Figure 4-1).
• The second single zone system has a 20% VLT for the entire glazing area (Test Case 3, Figure 4-1).
4.1.1.2 Multi-Zone Electrochromic Window
A multi-zone EC window in this study is referred to as the condition where an upper and a lower glazing are installed and controlled separately by different control algorithms, resulting in various VLT values. The systems that fall in this category are as follows:
• The first multi-zone system has a 63% VLT at the upper aperture and 6% at the lower aperture. A six feet (1.8 m) deep light shelf is installed between the upper and lower glazing areas. The light shelf is designed to reflect daylight from the upper zone to the ceiling and redirect to the deeper area in the room to balance the light distribution throughout the space (Test Case 2, Figure 4-1).
• The second multi-zone system has a 63% and a 20% VLT in the upper and lower zones, respectively. This case is designed for north-facing windows, where no light shelf is installed (Test Case 6, Figure 4-1).
Figure 4-1: Point-in-time Test Cases
As shown in Figure 4-1, five of the six systems are tested under profile angles to assess their performance under clear sky with the sun (e.g., facing south). Three systems are tested under blue sky only, which is to simulate their performance if they are installed on north-facing façades or under partly cloudy skies with the sun being blocked by clouds.
lux. The horizontal axis shows the sensor locations by the distance from the window. The gray rectangular area highlights the range of 300 lux to 3000 lux, which is considered as the “comfortable” daylight range. Each window configuration is color-coded in the legend. The data from the profile angle testing conducted in seven different days have been shown. The north-facing tests conducted in seven days are presented in the following pages. Outside illuminations on a vertical plane at the window are also measured at each comparison and reported in the diagrams.
4.1.1.3 Profile Angle Test Results
Figure 4-2 through Figure 4-8 show the results from the profile angle testing conducted for the five systems illustrated in Figure 4-1. The systems are tested under seven profile angles during seven days. The data have revealed that, among the five EC window configurations, Case 2, a combination of light-shelf and EC glass with 63% VLT in upper zone and 6 % VLT in the lower zone, has performed relatively better than others. In this case most of the nodes have daylight levels within the range of 300 – 3000 lux. The light shelf has increased the overall daylight level throughout the space (especially the inner area away from the window) due to the reflecting and redirecting of the light to the back of the room.
Case 5, a single zone configuration with a 6% VLT, performs fairly well in terms of glare control at the perimeter area close to the window. The light levels at this area are mostly maintained under 3000 lux. However, the area at the back of the space is mostly under-lit, especially at the nodes toward the end of the space where the light levels are well below 300 lux. In fact, this case represents the tinted state of the EC window under such sunny skies with the factory default set point. In other words, with the default set point from Sage, the EC glazing will mostly likely be at 6% VLT when sunlight incident on the window under a sunny sky.
Case 3, a single zone system with 20% VLT, is intended to raise the window VLT from 6% to let in more light to increase the light levels at the back side of the space, which is the case as shown in the results. However, the higher VLT creates some potential glare issues at the perimeter zone, even though it is not as severe as in Case 1.
4.1.1.4 Human Perception Survey
Figure 4-9: Test Setting
Background Information
To reinforce the findings concluded in the above experimental testing, a questionnaire survey is conducted to address the light quality aspect for the systems under sunny skies.
Table 1 Background Information
Attitudinal Survey
Table 2: Attitudinal Survey
Participants are then asked to fill out the “Satisfactory” survey to evaluate the three different EC configurations sequentially:
− Multi-zone EC integrated with light shelf with 63% VLT at upper glazing and 20% at lower glazing
− Single zone EC with 20% VLT
− Single zone EC with 6% VLT
For each configuration, the participants are asked to answer the questions at two locations, one close to the window and one far away (Figure 4-9). Therefore, each participant needs to answer to the same set of questions for six times and the data collected from this survey are based on the categorical responses for six test cases (Table 3).
Very Important Important 12.50% 87.50% Very Important Important
44% 56%
Very Important Important
56% 38%
Very Important Important
31% 62%
Very Important Important
19% 68%
Very Important Important
31% 43%
Very Sensitive Sensitive
43% 43%
Very Sensitive Sensitive
31% 37%
Very Low low Moderate Bright Very Bright
0 25% 75% 0
Unimportant 19% Unimportant 12% Unimportant 7% Unimportant 6% Unimportant 0 Unimportant 0 Glare Visual Distraction Preferable light Least Sensitive 32% Least Sensitive 13%
Good computer Monitor good lighting
Presence of window
View to outside
Privacy
Table 3: Test Cases
Location 1 Close to Window Location 2 Far From Window
Multi-zone EC+ Light Shelf
63% VLT & 20% VLT
Case 1 Case 2
Single Zone
20% VLT
Case 3 Case 4
Single Zone
6% VLT
Case 5 Case 6
Overall Lighting Condition
Table 4: Room Light Level
Table 5: Uniformity of Light
Table 6: Room Color Rendering
Table 8: Glare Level
Writing & Reading
Table 9: Light Level for Writing and Reading Task
Table 11: Glare Sensation for Writing and Reading
Computer Task
Table 12: Light Level for Computer Task
Table 13: Glare Sensation in Computer Task
Window View
The last part of the survey evaluates the participants’ perception toward the view to the outside through the window. When they are asked to assess the color rendering of the window view, Case 1 and 2 (EC with light shelf) are found to be most satisfying. Twenty-six percent and 40% of the participants are very unsatisfied with Case 5 and 6, respectively, which is likely due to the low (6%) VLT of the EC window.