Effective Tuberculosis Diagnosing
in Image Processing
Ajmal shan C. K.1, Binoy D. L.2
M.Tech Student, Dept. of CSE, MEA Engg College, Perintalmanna, Kerala,India1
Assistant Professor, Dept. of CSE, MEA Engg College, Perintalmanna, Kerala,India 2
ABSTRACT: Tuberculosis (TB) disease is a main global health threat. An estimated one-third of the world’s population has been exposed to TB, and millions of new infections are occurring every year. Tuberculosis naturally affects the lungs it also affects the other parts of our body. It is spread through air when infectious people cough, sneeze etc. The advent of new powerful hardware and software techniques has triggered attempts to develop computer-aided diagnostic systems for TB detection in support of inexpensive mass screening in developing countries. In this paper the medical background of TB detection in conventional posterior anterior chest X-rays has been described. In the first step the chest x-rays has been given as an input. In the second step, the selected images are segmented using graph cut segmentation method. In the last step a set of features has been extracted and calculated. Lastly, the multi-support vector machine is applied to classify the extracted feature vectors as normal or abnormal lungs. If it is abnormal, provide the name of the most matching TB manifestation of both lungs.
KEYWORDS:Computer Aided Diagnostics, Classification, Segmentation, Support vector machine, X-ray imaging.
I. INTRODUCTION
The world’s second most cause of death from an infectious disease is the TB (Tuberculosis) , after HIV, with a death rate of over 1.2 million people in 2010. TB is an infectious disease caused by the bacillus Mycobacterium tuberculosis, which typically affects the lung parts. It spreads through the air when people with active TB cough, sneeze, or otherwise expel infectious bacteria. TB is most common in Africa and Southeast Asia, where widespread poverty and malnourishment reduce resistance to the disease. Moreover, infections in low immune-compromised HIV/AIDS diseases patients have intensified the problem. The increasing appearance of multi-drug resistant TB has further created an urgent need for a cost effective screening technology to monitor progress during treatment.
cure the TB infection itself, but also to avoid drug incompatibilities. Medical personnel with small background Radiology need to be able to operate the screening system.
Paper is organized as follows. Section II describes related work with this paper. An overview of the proposed system is given in Section III. Section IV presents segmentation process of the lungs. Section V and VI describes feature extraction and classification correspondingly correlated with the diagnosing process by a CXR image. Finally, Section VII presents conclusion.
II. RELATEDWORK
The invention of digital chest radiography and the possibility of digital image processing has given new value to computer aided screening and diagnosis. Still, despite its presence in medical practice, the standard CXR will be a very important imaging tool. In the last 10 years, a lot of important papers have been published on computer-aided diagnosis (CAD) in CXRs. But, there is no confusion that more research needed to meet the practical performance requirements for deployable diagnostic systems. In a recent survey, van Ginneken et al. state that 45 years after the initial work on computer-aided diagnosis in chest radiology, there are still no systems that can accurately read chest radiographs [1]– [3]. Automated nodule detection is becoming one of the more mature applications of decision support/automation for CXR and CT. A lot of studies have been published evaluating the capability of commercially available CAD systems to detect lung nodules [6]–[10]. The result is that CAD systems can successfully assist radiologists in diagnosing lung cancer [20]. However, nodules represent only one of many manifestations of TB in radiographs.
In recent years, due to the complexity of developing fulfil edged CAD systems for X-ray analysis, research has concentrated on developing solutions for specific sub problems [1], [9]. The segmenting of the lung field is a typical task that any CAD system needs to support for a proper evaluation of CXRs. Other segmentations that may be helpful include the segmenting action on of the ribs, heart, and clavicles [2]. For example, van Ginneken et al. compared different techniques for lung segmenting , including active shapes, rule-based methods, pixel classification, and different combinations thereof [4]. Their conclusion was that pixel classification provided very quality performance on their test data. Dawoud presented an iterative segmenting approach that combines intensity information with shape priors trained on the publicly available JSRT database [5]. Depending on the lung segmentation, different feature types and ways to aggregate them have been reported in the literature. For example, van Ginneken et al. subdivide the lung into overlapping regions of different sizes and extract features from each region [6].
To detect abnormal signs of diffuse textural nature they use the moments of responses to a multi scale filter bank. In addition, they use the difference between corresponding regions in the left and right lung fields as features. A separate training set is constructed for each region and final classification is done by voting and a weighted integration. Many of the CAD papers dealing with abnormalities in chest radiographs do so without focusing on any specific disease. Only a few CAD systems specializing in TB detection have been published, such as . For example, Hogeweg et al. combined a texture-based abnormality detection system with a clavicle detection stage to suppress false positive responses [7]. In [8], the same group uses a combination of pixel classifiers and active shape models for clavicle segmentation. Note that the clavicle region is a notoriously difficult region for TB detection because the clavicles can obscure manifestations of TB in the apex of the lung. Freedman et al. showed in a recent study that an automatic suppression of ribs and clavicles in CXRs can significantly increase a radiologist’s performance for nodule detection [10]. A cavity in the upper lung zones is a strong indicator that TB has developed into a highly infectious state [9]. Shen et al. therefore developed a hybrid knowledge-based Bayesian approach to detect cavities in these regions automatically [9]. Xu et al. approached the same problem with a model-based template matching technique, with image enhancement based on the Hessian matrix [5]. Arzhaeva et al. use dissimilarity-based classification to cope with CXRs for which the abnormality is known but the precise location of the disease is unknown. They report classification rates comparable to rates achieved with region classification on CXRs with known disease locations. More information on existing TB screening systems can be found in recent surveys[4].
USA). Currently, these tests are still expensive. Nevertheless, with costs decreasing over time, these systems may become an option for poorer countries. It is also possible, and indeed very promising, to combine these new systems with X-ray based systems. For the time being, however, these systems are out of the scope of this paper.
III.OVERVIEW OF THE SYSTEM
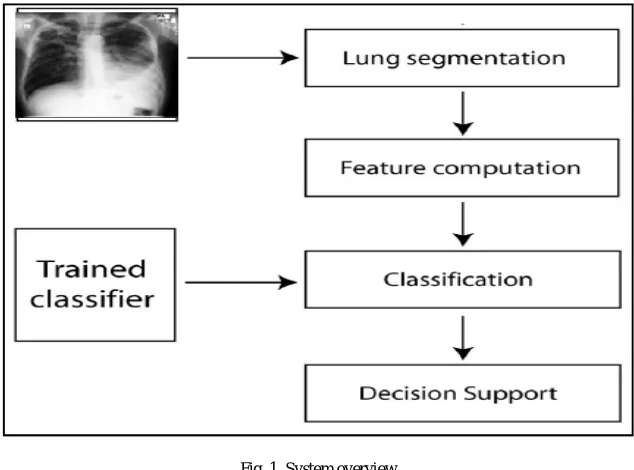
In the proposed system, utilizing appropriate methods for the Tuberculosis detection process. Utilizing the advanced techniques will also improve the performance of the system. For this purpose, first of all taking an DICOM images directly from the hospital databases. This images will have a high resolution, that will make the clear view of the image and also of the lung part. Then the system will segment the lung part from this X-ray image after it connect with a MATLAB interface.
This segmentation is done by the Graph-cut method and then making a comparative study with the lung shapes in the X-rays of the stored database. For this comparison study, the system will extract some features using the MATLAB tools. About 6 different types of features extracting. from the segmented lug part. Then inputting these features in to an classifier. This classifier will make a decision that the who own the X-ray having similarity with the some manifestation of the TB. Here the system using the multi-SVM classifier for this purpose. It has many advantages related to the other existing classifier in efficiency and time consumption. The whole system modules are implemented within the MATLAB environment. The model for the proposed system is as shown in the fig.1:
Fig. 1. System overview
IV.SEGMENTATION
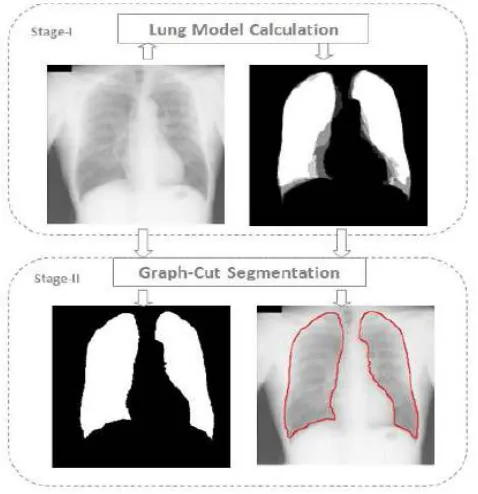
The segmentation process involves the graph cut approach [11] and model the lung boundary detection with an objective function. To manipulate the objective function, define three needs a lung region has to satisfy: (1) the lung region should be consistent with typical CXR intensities expected in a lung region, (2) neighbouring pixels should have consistent labels, and (3) the lung region needs to be similar to the lung model computed.
Mathematically, it can describe the resulting optimization problem as follows : Let
be a binary vector having components correspond to foreground
is the number of pixels. According to the method, the optimal configuration of is given by the minimization of the
following objective function: where , and
represent the region, boundary, and lung model properties of the CXR, respectively. The region term
considers image intensities as follows:
where is the intensity of pixel and is the set of edges representing the cut. and are the intensities of foreground and background regions. learn these intensities on the training masks and represent them using a source
and terminal node . (2) ensures that labels for each pixel are assigned based on the pixel’s similarity to the foreground and background intensities.
The boundary constraints between lung border pixels and are manipulated as follows:
This term uses the sum of the exponential intensity differences of pixels defining the cut. The sum is minimum when the intensity differences are maximum.
Fig. 2. Segmentation process
where is the probability of pixel being part of the lung model. This term describes the probability of pixels labelled as lung belonging to the background, and the probability of pixels labelled as background belonging to the lung, according to the lung model. want to minimize both probabilities. Fig-2 shows proposed scheme to detect the lung boundary. The system consists of two stages: Stage-(I): Lung shape model computation. Top left image indicating original image, top right indicating calculated shape model by taking the average of training masks. Stage-(II): Lung boundary detection with a graph-based algorithm. Bottom left indicating global binary segmentation, bottom right indicating calculated boundary contour.
V. FEATURE EXTRACTION
The first set is a combination of shape, edge, and texture descriptors [6]. For each descriptor, compute a histogram that shows the distribution of the different descriptor values across the lung field. Each histogram bin is a feature, and all features of all descriptors put together form a feature vector that input to the multi-SVM classifier. Through empirical experiments, found that using 32 bins for each histogram gives us good practical results . In particular, use the following shape and texture descriptors .
• Intensity histograms (IH).
• Gradient magnitude histograms (GM).
• Shape descriptor histograms (SD)
Where and are the eigen values of the Hessian matrix, with
• Curvature descriptor histograms (CD)
with , where denotes the pixel intensity
for pixel . The normalization with respect to intensity makes this descriptor independent of image brightness.
• Histogram of oriented gradients (HOG) is a descriptor for gradient orientations weighted according to gradient magnitude. The image is divided into small connected regions, and for each region a histogram of gradient directions or edge orientations for the pixels within the region is computed. The combination of these histograms represents the descriptor. HOG has been successfully used in many detection systems .
VI.CLASSIFICATION
To detect abnormal CXRs with TB, use a multi support vector machine (SVM), which classifies the computed feature vectors into either normal or abnormal. This detection process only execute after training the classifier. Training process takes two major clusters of CXRs, one is for normal CXRs and other is for abnormal CXRs. Fig-3 shows some example CXRs in the normal cluster.
Fig. 3. Examples of normal CXRs used for training
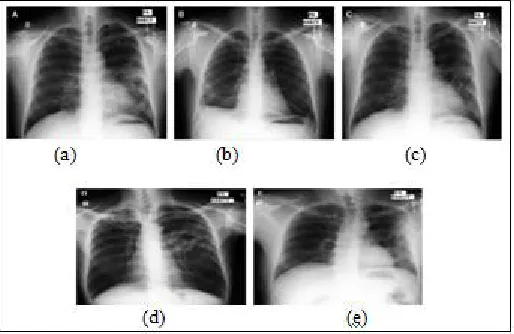
If the lung shape of the processing CXR is abnormal, the multi support vector machine can easily make comparison of the input CXR image with the different manifestation of TB at the same time. Different manifestations of the tuberculosis is shown in fig-4. In this, CXR (a) has a cavitary infiltrate on the left and a subtle infiltrate in the right lower lung. CXR (b) is an example of pleural TB. Note that the blunted right costophrenic angle indicates a moderate effusion. CXR (c) has infiltrates in both lungs. CXR (d) shows irregular infiltrates in the left lung with cavitation and scarring of the right apex. CXR (e) shows peripheral infiltrates in the left lung. An SVM in its original form is a supervised nonprobabilistic classifier that generates hyper planes to separate samples from two different classes in a space with possibly infinite dimension . The unique characteristic of an SVM is that it does so by computing the hyper plane with the largest margin; i.e., the hyper plane with the largest distance to the nearest training data point of any class. Ideally, the feature vectors of abnormal CXRs will have a positive distance to the separating hyper plane, and feature vectors of normal CXRs will have a negative distance. The larger the distance the more confident are in the class label.
VII. CONCLUSION
In this work, presented an automated system that screens CXRs for manifestations of TB. When given a CXR as input, the system first segments the lung region using an optimization method based on Graph-cut segmentation. Then the system compute a set of features as input to the trained multi- SVM classifier, which then classifies the given input image into either normal or abnormal. Abnormality further classified into different manifestations of TB. The seriousness of the TB in the current situation making higher necessity of this project. Finding the most matching TB manifestation of the lung make appropriate medicine application and multiple persons can be checkout by the system fastly and accurately because of it’s digital automatic nature.
REFERENCES
[1] Stefan Jaeger, Alexandros Karargyris, Sema Candemir, Les Folio, Jenifer Siegelman, Fiona Callaghan, Zhiyun Xue, Kannappan Palaniappan, Rahul K. Singh, Sameer Antani, George Thoma, Yi-Xiang Wang, Pu-Xuan Lu, and Clement J. McDonald, “Automatic Tuberculosis Screening Using Chest Radiographs,” IEE Transaction on medical imaging ,vol.33, No.2, Feb.2014
[2] G. Lodwick, “Computer-aided diagnosis in radiology: A research plan,” Invest. Radiol., vol. 1, no. 1, p. 72, 1966.
[3] G. Lodwick, T. Keats, and J. Dorst, “The coding of Roentgen images for computer analysis as applied to lung cancer,” Radiology, vol. 81, no. 2, p. 185, 1963.
[4] S. Sakai, H. Soeda, N. Takahashi, T. Okafuji, T. Yoshitake, H. Yabu- uchi, I. Yoshino, K. Yamamoto, H. Honda, and K. Doi, “Computer- aided nodule detection on digital chest radiography: Validation test on consecutive T1 cases of resectable lung cancer”
[5] J. Shiraishi, H. Abe, F. Li, R. Engelmann, H. MacMahon, and K. Doi, “Computer-aided diagnosis for the detection and classification of lung cancers on chest radiographs: ROC analysis of radiologists’ perfor- mance,” Acad. Radiol., vol. 13, no. 8, pp. 995–1003, 2006.
[6] S. Kakeda, J. Moriya, H. Sato, T. Aoki, H. Watanabe, H. Nakata, N.Oda, S. Katsuragawa, K. Yamamoto, and K. Doi, “Improved detec- tion of lung nodules on chest radiographs using a commercial com- puter-aided diagnosis system,” Am. J. Roentgenol., vol. 182, no. 2, pp. 2004. [7] K. Doi, “Current status and future potential of computer-aided diag- nosis in medical imaging,” Br. J. Radiol., vol. 78, no. 1, pp. 3–19, 2005. [8] B. Van Ginneken, B. ter Haar Romeny, and M. Viergever, “Computer- aided diagnosis in chest radiography: A survey,” IEEE Trans. Med.
Imag., vol. 20, no. 12, pp. 1228–1241, Dec. 2001.
[9] B. Van Ginneken, M. Stegmann, and M. Loog, “Segmentation of anatomical structures in chest radiographs using supervised methods: A comparative study on a public database,” Med. Image Anal., vol.10, no. 1, pp. 19–40, 2006.
[10] B. van Ginneken and B. ter Haar Romeny, “Automatic segmentation of lung fields in chest radiographs,” Med. Phys., vol. 27, no. 10, pp.2445–2455, 2000.