Abstract
SETTLE, DAVID WILLIAM. Thermal Processing of Sour Cream using Continuous Flow Microwave Heating - Feasibility Study. (Under the direction of Dr. Arthur P. Hansen and Dr. Josip Simunovic).
The purpose of this research was to develop a sour cream that could withstand the effect of UHT continuous microwave processing. The major benefit to the manufacturer of the UHT processing would be extended shelf-life, especially in conjunction with aseptic packaging. This would result in less spoilage, thus increased profits. This becomes increasingly important as sour cream increases in popularity and is sold and marketed at greater distances from the point of processing
One major problem with UHT processing of acidic dairy products is that high temperatures cause milk proteins to aggregate, especially at pH’s around the pI (isoelectric point) of casein. Fouling (or burn-on) of the heat-exchanger tube walls is another factor that excludes the use of UHT processing to sterilize sour cream.
The proper formulation of sour cream with the use of stabilizers such as starch and gelatin can also minimize aggregation, reduce syneresis, and increase the viscosity of the final products. The addition of gelatin is often used in sour cream formulations as it increases water binding, whey retention, and adds to mouthfeel, and gives the final product sheen-like appearance.
In order to characterize the performance and functionality of sour cream under continuous flow microwave thermal processing conditions, seven sour cream
commercially accepted limits. Viscosities were dynamically measured with the
Stresstech. Dielectric properties of the sour cream samples were also analyzed. Dielectric measurements were taken at 5° C intervals. Microwave processing was performed using a 5 kw microwave system. Processing was performed at an output power of 3 kilowatts at 915 MHz at flow rate of 4 liters per minute to determine dielectric properties and estimate the need for formulation adjustments.
Thermal Processing of Sour Cream using Continuous Flow
Microwave Heating - Feasibility Study
by
DAVID WILLIAM SETTLE
A Thesis submitted to the Graduate Faculty of North Carolina State University in partial fulfillment of the requirements for the Degree of Master of Science.
FOOD SCIENCE
Raleigh
2006
APPROVED BY:
_________________________ _________________________ Arthur P. Hansen, Ph.D. Josip Simunovic, Ph.D. Chairman of Committee
Biography
Acknowledgements
I owe special thanks to my parents and daughter for their support during this period of my life. My daughter was the person who kept me focused and if not for her my motivation would have dissapeared. Above everone else, she is the one who made the completion of this project possible. I also owe great thanks to Dr. Arthur P. Hansen, Dr. Josip Simunovic, Dr. Pablo Coronel, Sharon Ramsey, and Gary Cartwright for their professional and personal support for me during a very difficult time in my life. I would also like to recognize Dr. Jonathan Allen and Dr. Leon Boyd for their participation on this project as thesis committee members. I also thank Jimmy Buffett, Eric Clapton, Dire Straits, and other musicians that kept me company and in good spirits during those long nights and even longer days. I also need to thank all of the professors that I have had the privilege to be instructed by. Each one has shown interest in the sucessful completion of my research and offered any assistance that might be useful both in school and at a personal level.
Table of Contents
List of Tables ………..………..……..……… vi
List of Figures ………...………..….…….. vii
1: Introduction …………..……….………..……….……. 1
2: Review of Literature 2.1 Fermented Dairy Products ………..……… 2
2.1.1 History of Fermented Dairy Products ………. 2
2.1.2 Dairy Industry Trends ………..……...……… 7
2.1.3 The Sour Cream Economic Market …………..……….. 9
2.2 Methods of Thermal Processing ………….…..………..……… 11
2.2.1 Introduction ………...….………. 11
2.2.2 Thermal Death Time (F) ………..……..……..………….….….. 13
2.2.3 Traditional UHT Processing …………..…….……….… 14
Direct Heating ……….….………..… 14
Indirect Heating ………….….……….…..…… 18
Advantages of UHT …………....………..…. 18
Disadvantages of UHT …….……..………..…..… 19
2.2.4 Microwave Thermal Processing …………...……..………..…. 20
3.2 Materials and Methods ………..….………...……….………. 34
3.3 Results and Discussion ………...…..………...………...…...…..…… 36
4: Experiment 2 - Formulation Determination 4.1 Introduction ………...…………...…..………..………..……… 42
4.2 Materials and Methods ……….……….……….…….… 42
4.3 Results and Discussion ………...………..………....……… 45
5: Experiment 3 - Validation of Formulation 5.1 Introduction ……….……….…..……...………..… 55
5.2 Materials and Methods ………..…..……… 55
5.3 Results and Discussion ……….…..…….………… 56
6: Conclusions ……….………....………..…… 61
7: References ……….……….……….…..… 63
Appendix A: Thermtex® Technical Bullitin ………….….………...…… 68
Appendix B: V1.0 Brookfield Viscometer HB program parameters …….……… 69
List of Tables
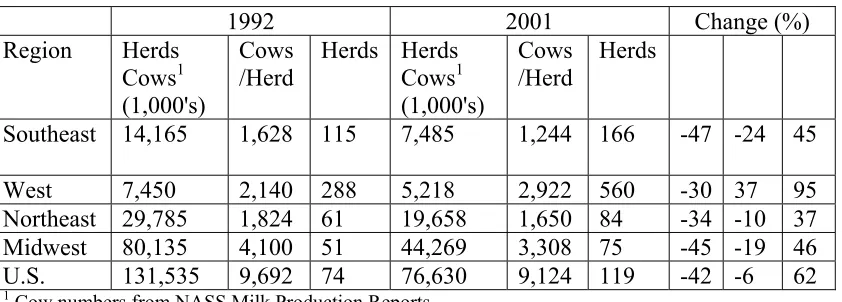
Table 2.1 Regional changes from 1992 to 2001 in herd size and
herd numbers ………... 8 Table 3.1 CommercialBrand Ingredient Lists ………..…. 35 Table 3.2 Power Law Equations for Commercial Sour creams…....……….. 37 Table 3.3 Breakstone®, Kroger Natural®, Kroger Original®, Westover®
yield stress data using HP Brookfield viscometer ……..……..………. 41 Table 4.1 Formulation Matrix. Starch and gelatin by percent total weight ……... 44 Table 4.2 Combinations of modified waxy maize starch and modified
tapioca maltodextrin (10% aqueous solutions) after heating to 82° C , followed by homogination at 10.3 MPa
and cooling to 65° C and gel strength after cooling to 4° C ……...…... 47 Table 4.3 Significant differences between sour cream yield stresses using 1-way
ANOVA statistical analysis ………... 48 Table 4.4 NCSU sour cream sample yield stress data from Brookfield HB ..….... 51 Table 4.5 Power law equations for North Carolina State University
sour cream formulations ……….………..……...….. 51 Table 5.1 Power law modeling equations comparing the final runs,
previous formulation from chapter 4 (Sample 4) and Kroger
List of Figures
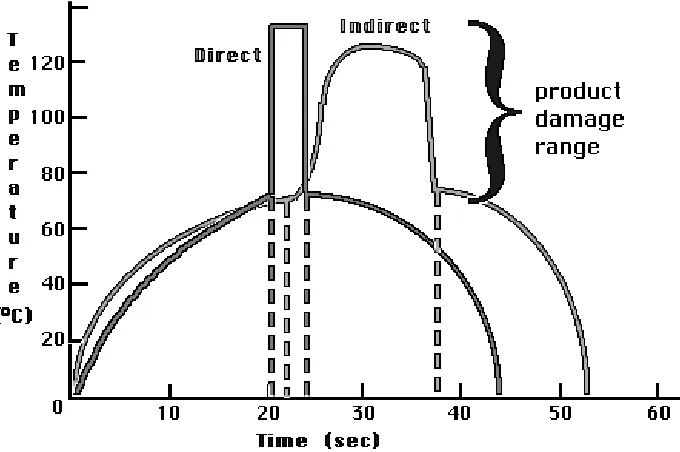
Figure 2.1: U.S. per capita consumption of sour cream from 1954 to 2005 ……... 10 Figure 2.2: Time/temperature curves for Direct and Indirect continuous
sterilization methods and product damage range ….……….……...… 15 Figure 2.3: Diagram of a steam injection valve …………...…..………..………. 16 Figure 2.4: Diagram of a steam infusion chamber ……...…...….…..…...……. 16 Figure 2.5: Schematic diagram of the 5 kw system ……...………. 25 Figure 3.1: Breakstone®, Kroger Natural®, Kroger Original®, Westover®
shear stress vs. shear rate .…..………...………….………... 38 Figure 3.2: Breakstone®, Kroger Natural®, Kroger Original®, Westover®
yield stress using the HP Brookfield YR-1 ……...………..….… 40 Figure 4.1: Thermtex® Amylograph ….….……… 43 Figure 4.2: Time and temperature processing variations …... 46 Figure 4.3: North Carolina State University sour cream formulation
yield stress and commercial brand yield stresses .………...….… 48 Figure 4.4: Shear stress vs. shear rate for NCSU sour cream formulations
and Breakstone® ………..……….………...……… 49 Figure 4.5: Shear stress vs. shear rate for NCSU sour cream formulations and
Kroger original ….……….... 50 Figure 4.6: Effect of temperature on the dielectric constant (e’)
of the seven NCSU formulations ……….. 53 Figure 4.7: Effect of temperature on the dielectric loss factor (e’’)
of the seven NCSU formulations ……….. 54 Figure 5.1: Shear stress vs. shear rate for final NCSU formulations
and Breakstone® ……….……… 58
Figure 5.2: Shear stress vs. shear rate for final NCSU formulations
and Kroger® Original ………..……….… 59 Figure 5.3: Shear stress vs. shear rate for final NCSU formulations and
Introduction
UHT processing of milk hase been a reality for many years, but some dairy prducts such as sour cream have not been sucessfully processed using UHT technology.
One problem problem with UHT processing of acidic dairy products is that high temperatures cause milk proteins to aggregate, especially in products that have pH’s close to the pI (isoelectric point) of casein. The second problem with processing sour cream is that it is more viscous that milk. This may increase the fouling of the system walls resulting in a ‘cooked’ flavor.
Because of these restrictions the procedures for sour cream production and storage have changed little over the past 50 years. Storage of sour cream still relies on refrigeration. Since conventional sour cream is not pasturized after fermentation it contains active cultures and small amounts of bacteria which cause spoilage. This results in a self-life of 2 to 4 weeks.
The use of continuous microwave technology allows UHT processing to be used with minimal fouling of the system walls. The microwave energy is absorbed and converted into heat by the product. Because of this, the ‘hot spot’ is at the center of the flow profile (tube wall radius = 0) while the ‘cold spot’ is the inside of the tube.
Review of Literature
2.1 Fermented Dairy Products
2.1.1 The History of Fermented Dairy Products
The origin of fermented foods and cultured milk products predates recorded history. Most cultured foods start with milk, which people have been drinking since the dawn of agriculture. The first evidence of the domestication of cows occurred in 9,000 BC in Libya, and while there are no written records that prove these ancient people ate yogurt, the probability is high that they consumed cultured milk products of some sort (Wikipedia Encyclopedia, New Dairy Culture-Australia Dairy 2003). India’s Ayurvedic writings, dating back to 6,000 BC, indicate that regular consumption of dairy products led to a long and healthy life. In India, the milk of almost every animal, from camels to yaks, continues to be made into cultured foods, including yogurt and cheese, of which there are more than 700 varieties.
the Mongols held most of the Ch’in Empire and had vanquished Turkistan and Afghanistan. They even penetrated southeastern Europe.
Highly mobile, the Mongols rode small, swift horses that were bred to traverse the vast plains of the Mongolian empire. Every Mongol’s wealth was measured by the number of horses he owned, and each soldier traveled with a large string of them. These hardy horses were what helped make this army invincible. Not only did they carry soldiers into battle, they also provided the rich milk that was fermented and enjoyed by every member of the conquering hordes—from the Great Khan to the lowliest slave. Known as kumiss, this is one of the earliest known fermented milk products. Highly nutritious, kumiss not only sustained the Mongols, it kept them healthy.
for old people, and in the U.S.S.R., it is one of the fermented milks used in the treatment of tuberculosis and other diseases.
In 1908, the health benefits of friendly bacteria first came to the attention of the general public, when Dr. Elie Metchnikoff, a Russian biologist, wrote “The
Prolongation of Life”. Based on the research that earned him one of the world’s top honors, this book stunned the medical and scientific communities. In it, Dr. Metchnikoff recognized that certain white blood cells known as phagocytes ingest and destroy
dangerous bacteria, a fact we now know to be true. Dr. Metchnikoff shared the 1908 Nobel Prize in Physiology and Medicine for identifying the process of phagocytosis, an important function of the immune system.
the happy result of an intestinal tract that maintains a healthy daily supply of the cultured bacteria found in yogurt. It was Dr. Metchnikoff who named the primary yogurt-culturing bacteria Lactobacillus bulgaricus, in honor of the yogurt-loving Bulgarians (Trenev, 1998). Today, yogurt is enjoyed just about everywhere, with the exception of the Chinese, who prefer fermented soy products.
The friendly bacteria used to culture true yogurt are Lactobacillus bulgaricus and Streptococcus thermophilus. When these bacteria are added to milk and allowed to ferment, the resulting culture is a naturally sweet, mildly tangy, smooth, fresh-tasting custard-like treat. And, thanks to the action of the bacteria, true yogurt is almost a “predigested” food. Within an hour after eating yogurt, 90 percent of it is digested. Compare this to a glass of milk, of which only 30 percent is digested in the same amount of time. More importantly, the friendly live bacteria present in true yogurt offer health benefit.
Sour Cream is a light cream (18% milk fat) with Lactobacillus and
Streptococcus lactis bacteria added. Like yogurt, the lactose is used as a food source for the bacterial culture. Lactic acid is a by-product which causes protein gels to form due to a drop in pH. Real sour or cultured cream is the result of natural lactic acid
Sour cream has long been a traditional ingredient in Russian, Eastern European and German cooking, and has gained popularity in the rest of Europe, North America, and other parts of the world in the past 50 years or so. It was traditionally made by letting fresh cream sour naturally. The acids and bacteria present produced a generally consistent flavor and thick texture that went well with both sweet and savory dishes. These days, commercially produced sour cream is made by inoculating pasteurized light cream with bacteria cultures, letting the bacteria grow until the cream is both soured and thick and then refrigerating to stop the process.
Smetana (Czech and Slovenian: smetana, Slovak: smotana, Polish: śmietana, Russian: cmetaha) is an East European variety of sour cream. It is much heavier and sweeter than the West European variety and hard to get in the West. It is used very often in certain East European cuisines.
Another relative of sour cream is crème fraîche, which is also a soured cream. The taste is generally milder than that of sour cream and has a higher fat content. Crème fraîche is a slightly tangy, slightly nutty, and less thick than sour cream. Before the age of pasteurization crème fraîche made itself as the bacteria present in the cream
Buttermilk is another fermented milk product. Originally it was the liquids left after cream was churned into butter. Today, it is made commercially with lowfat milk with Lactobacillus and Streptococcus lactis bacteria added. Stabilizers are often added to buttermilk, usually carrageenan and guar gum, to increase viscosity, mouth-feel, and extend shelf-life by reducing protein aggregation.
2.1.2 Dairy Industry Trends
The year 2000 was challenging for most U.S. dairy producers, who experienced some of the lowest farm milk prices in decades. From July 2000 to July 2001, the number of dairy farms fell by 6,307. This represents 7.6% of dairy farms in business in 1999 and is the second largest percentage loss in 10 years. Losses occurred nationwide and varied substantially by region. The Midwest and Southeast incurred losses of 8.5% and 8.4% respectively, while the Northeast experienced a 6.2% drop. Western farms fell by 3.6%.
Nationwide, 42% of the dairy operations from 1992 are no longer milking cows. Although those involved and their communities were affected, the industry is dynamic and changing. While the U.S. lost almost 55,000 herds since 1992, the country lost only 6% of cows, and milk production has increased from 150.8 billion pounds in 1992 to 167.7 billion pounds in 2000. This current trend indicates a move toward larger herds but fewer farms.
the Northeast. Average Western herd size has nearly doubled in the past decade and is now more that three times greater than the next closest region, the Southeast. The West is also the only region where cow numbers have increased, with a gain of 782,000 cows or 37%. The nation, as a whole, lost 6% of its cows over this time period.
Table 2.1. Regional Changes from 1992 to 2001in Herd size and herd numbers2.
1992 2001 Change (%)
Region Herds Cows1 (1,000's) Cows /Herd Herds Herds Cows1 (1,000's) Cows /Herd Herds
Southeast 14,165 1,628 115 7,485 1,244 166 -47 -24 45 West 7,450 2,140 288 5,218 2,922 560 -30 37 95 Northeast 29,785 1,824 61 19,658 1,650 84 -34 -10 37 Midwest 80,135 4,100 51 44,269 3,308 75 -45 -19 46 U.S. 131,535 9,692 74 76,630 9,124 119 -42 -6 62
1 Cow numbers from NASS Milk Production Reports
2 Surveys in prior years were conducted for the American Farm Bureau Federation. Herd numbers in this report from 1992 through 2000 are from those surveys
While the magnitude of herd and cow numbers differ, the Midwest and
2.1.3 The Sour Cream Economic Market
In 2002, sour cream sales were up 5.4% to 685 million pounds, as compared to 2001. This increase is largely attributed to a growing hispanic community in the U.S. Hispanics are now the largest minority group in America, growing 67.5% between 1990 and 2002. At this rate, by 2012, nearly 1 in 5 people in the US will be hispanic
(Anonymous, 2003). Also, Hispanic foods have gained popularity among non- hispanics. Sour cream consumption is also increasing because, according to the American Dairy Association, snacking and entertaining were the two overall hottest food trends for 2003. Dairy case dips, which use sour cream as the main ingredient, are perfect compliments to these trends (Anonymous, April 2003).
0 0.5 1 1.5 2 2.5 3 3.5 4 4.5
1950 1960 1970 1980 1990 2000 2010
Year Pe r C a pi ta C o ns u m pt io n pe r y e a r o f s o ur c r ea m (p o und s)
Figure 2.1: U.S. per capita consumption of sour cream1
1
2.2 Methods of Thermal Processing
2.2.1 Introduction
While pasteurization effectively eliminates potential pathogenic
microorganisms, it also eliminates the probiotic benefits of cultured dairy products but it is not sufficient to inactivate the thermo-resistant spores in milk. Pasteurization is a method of destroying 95-99% of pathogenic bacteria in milk. This process increases shelf life of refrigerated milk. Combinations of heat and time minimize breakdown of vitamins and proteins.Several methods of Pasteurization exist. Batch pasteurization is performed at 145° F (63° C) for 30 minutes. High temperature short time (HTST) pasteurization is performed for 16 seconds at 161° F (72° C). HTST is currently the most popular method of pasteurization in the Unites States. Flash pasteurization is performed at 212° F (100° C) for 0.01 seconds. Ultra-pasteurization involves processing at 280° F (138° C) for 2 seconds. This provides a longer shelf life. Sterilization occurs at Ultra-high temperature (UHT) processing which is performed at 280° F (138° C) for 2-6 seconds.UHT processed milk is popular worldwide because it is sterile and shelf stable (Anonymous, 2003).
The term “sterilization” or “sterile” refers to the complete elimination of all
microorganisms. The food industry uses the more realistic term “commercial
sterilization”; a product is not necessarily free of all microorganisms, but those that
In retort canning processes it must be ensured that the “cold spot” has reached the desired temperature for the desired time. The “cold spot” is the thermal center of a food item and is the last area of an item to reach the desired temperature. With most canned products, there is a low rate of heat penetration to the thermal center. This leads to over-processing of some portions, and damage to nutritional and sensory
characteristics, especially near the walls of the container. Longer processing times at lower temperatures often alleviates this problem.
Milk can be made commercially sterile by subjecting it to temperatures in excess of 100° C, and packaging it in air-tight containers. The milk may be packaged either before or after sterilization. The basis of ultra-high temperature (UHT) is the
2.2.2 Thermal Death Time (F)
In order to calculate appropriate time/temperature processes, thermal death time calculations are used. Thermal death time (F) is the total time required to accomplish a stated reduction in a population of vegetative cells or spores. F can be expressed as a multiple of D values (where D is the value for Clostridium Botulinum), as long as the
survival curve is 1st order. The thermal death time (TDT) or F-value is calculated using the following equation:
dt 10 F t 0 z T ) t ( T 0 0
∫
− =The subscript "0" is used to denote that the sterilization value has been
normalized to a reference microorganism at a reference temperature (T0). This method
was proposed initially by Bigelow and others (1920) and has been used as a
conservative approach to processing. The reference temperature used is 121.1 °C and the reference z value is that of Clostridium Botulinum (10 °C) at given reference
temperature.
In food science literature for thermal processes, F is expressed with a subscript denoting the process temperature and a superscript denoting the z value for the
organism being considered (Singh and Heldman, 2001). The z value is dependent on temperature, but the changes within a reasonable range of temperatures are small, and it can be considered constant. For sterilization processes, the reference temperature is 121.1 °C (250 °F), and the reference microorganism has a z value of Clostridium
resistance (z). The common reference thermal time is for Clostridium Botulinum and is
expressed asexpressed as F10121 or just F0, as stated above. 2.2.3 UHT Processing
Direct heating systems
method has the advantages of instantaneous heating and rapid cooling, no localized overheating or burn-on, it is suitable for low and higher viscosity products.
Indirect heating systems
In this method the heating medium and product are not in direct contact, but separated by equipment contact surfaces. Several types of heat exchangers are applicable and they include plate, tubular, scraped surface, and double-cone configurations.
Plate Heat Exchangers aresimilar to that used in HTST but operating pressures are limited by gaskets which results in lower liquid velocities. Low flow rates can lead to uneven heating and burn-on because of overexposure of the product to the plates and lack of turbulent flow rate which would result in more even heat distribution. This method is economical in floor space, easily inspected, and allows for potential energy conservation and regeneration. Products processed with this method should have low viscosities.
Tubular Heat Exchangers are available in several types which include shell and tube, shell and coil, double tube, and triple tube. All of these tubular heat exchangers have fewer seals involved than with plates. This allows for higher pressures, thus higher flow rates and higher temperatures. The heating is more uniform but difficult to inspect.
mean long holding sections which are impractical. This may lead to damaged solids and over processing of sauce (Singh, 2001).
Double-cone Heat Exchangers are suitable for large particulates because they involve separation of solids from the liquids and combine indirect heating in a double cone (batch) with direct heating of the liquid portion (may also be a scraped surface if the product is too viscous). The solid pieces are fed into a double-cone, rotated slowly on the horizontal axis with steam injection and heated surfaces. There is no burn-on because they are the same temperature. The liquid is directly heated with steam separately, and then added to the solids after pre-cooling. The double cone acts as a blender and coats solids. The product is then discharged to an aseptic filler by overpressure with sterile air. This method is useful for soups, stews, carrots, and vegetables. (www.dairyconsultant.co.uk/pages/UHT_process.htm,
www.foodsci.uoguelph.ca)
Advantages of UHT
Disadvantages of UHT
Complex equipment and processing plant design are needed to maintain sterile atmosphere between processing and packaging. This results in more highly skilled operators and larger payroll costs. Sterility must be maintained through aseptic packaging. Particle size can be a limiting factor. With larger particulates there is a danger of overcooking of surfaces and need to transport material, both of which limit particle size. There is also a lack of equipment for particulate sterilization, due especially to settling of solids and thus over processing.
Special heating and cooling requirements are also needed. The heating of a liquid food using UHT processing may require finite time for the product temperature to increase from the initial temperature to the holding tube temperature. Due to
regulations, the lethality associated with the area under the lethal curve may not be considered. Only when the heating and cooling are instantaneous will the lethality of the process be equal to the lethality accumulated during the holding time. (Singh, Heldman, 2001.,www.dairyconsultant.co.uk/pages/UHT_process.htm, www.foodsci.uoguelph.ca)
2.2.4 Microwave Thermal Processing
Introduction
Microwaves are a form of electromagnetic wave. The most familiar kind of electromagnetic wave is visible light. It takes energy to produce light and microwaves. A typical microwave oven needs several hundred watts of energy to make microwave energy powerful enough to heat a food product.
Like light, microwaves travel very fast, about 186,000 miles (300,000 kilometers) per second in air. In addition, both light and microwaves get weaker the further they travel from their source, and both can be focused into narrow beams by lenses (such as a magnifying lens) or concave mirrors called reflectors. This is because of the biggest difference between microwaves and light waves: their wavelengths. Light waves and microwaves are both electromagnetic waves and, therefore, part of the electromagnetic spectrum. The electromagnetic spectrum is the range of all
electromagnetic waves. It includes everything from radio waves to microwaves, infrared and ultraviolet rays, and gamma rays.
One of the most common non-military uses of microwaves is, of course, the microwave oven. Like many of today’s great inventions, the microwave oven was a by-product of another technology. It was during a radar-related research project around 1946 that Dr. Percy Spencer was testing a new vacuum tube called a magnetron when he discovered that food placed near the magnetron increased in temperature The logical scientific conclusion was that temperature increases were all attributable to exposure to low-density microwave energy. Dr. Spencer then fashioned a metal box with an opening into which he fed microwave power. The energy entering the box was unable to escape, thereby creating a higher density electromagnetic field. When food was placed in the box and microwave energy fed in, the temperature of the food rose very rapidly. Dr. Spencer had invented what was to revolutionize cooking, and formed the basis of a multimillion dollar industry, the microwave oven. (Patent # 2,495,429).
(http://smecc.org/microwave_oven.htm)
Doctor Spencer continued at Raytheon as a senior consultant until he died at the age of 76. At the time of his death, Dr. Spencer held 150 patents and was considered one of the world’s leading experts in the field of microwave energy, despite his lack of a high school education.
½ feet tall, weighing over 750 pounds, and costing about $5000 each. The magnetron tube had to be water-cooled, so plumbing installations were also required. In 1947, Raytheon demonstrated the world’s first microwave oven and called it a “Radarange,” the winning name in an employee contest. Housed in refrigerator-sized cabinets, the first microwave ovens cost between $2,000 and $3,000. Between 1952-55, Tappan introduced the first home model priced at $1295. In 1965 Raytheon acquired Amana Refrigeration. Two years later, the first countertop, domestic oven was introduced. It was a 100-volt microwave oven, which cost just under $500 and was smaller, safer and more reliable than previous models.
Technological advances and further developments led to a microwave oven that was priced for the consumer kitchen. However, there were many myths and fears
dishwasher, reaching nearly 60%, or about 52 million U.S. households. America’s cooking habits were being drastically changed by the time and energy-saving
convenience of the microwave oven. Once considered a luxury, the microwave oven had developed into a practical necessity for a fast-paced world. An expanding market has produced a style to suit every taste; a size, shape, and color to fit any kitchen, and a price to please almost every pocketbook. Options and features, such as the addition of convection heat, probe and sensor cooking, meet the needs of virtually every cooking, heating or drying application. Today, the magic of microwave cooking has radiated around the globe, becoming an international phenomenon.
The microwave oven had reached a new level of acceptance, particularly with regard to certain industrial applications. By having a microwave oven available,
restaurants and vending companies could now keep products refrigerator-fresh up to the point of service, then heat to order. This results in fresher food, less waste, and money saved(Anonymous, 2006; Cowen, 1997).
As the food industry began to recognize the potential and versatility of the microwave oven, its usefulness was put to new tests. Industries began using microwaves to dry potato chips and roast coffee beans and peanuts. Meats could be defrosted,
precooked and tempered. Even the shucking of oysters was made easier by microwaves. Other industries found the diverse applications of microwave heating quite
oven has become a necessity in the commercial market and the possibilities seem endless.
Figure 2.5 shows a schematic diagram of the 5 kw system. The system consists of a microwave generator which contains the Magnetron. The Magnetron converts electrical energy to microwaves which are transmitted into the wave guide. The microwaves travel through the wave guide into the reactor. The waves reflect off the reactor walls. The waves are focused so that they converge at the center of the reactor where the product transport tube is located. The microwaves are converted into heat by the food product. The product is circulated through this system repeatedly until the desired temperature is reached. Temperature is monitored using thermocouples at the entrance and exit of the reactor. The temperature and time are recorded during the processing run. Once the desired temperature is reached the microwave generator is turned off. The product is then cooled by applying ice to the exterior of the transport tubes. Once the product is below 100° C the system is slowly depressurized by slightly loosening the sealed top of the product bin. Once the system is completely
Dairy Processing using Microwave Technology
One of the challenges processors face is being able to provide consumers with products that meet their expectations every time regardless of what point the product is in its life-cycle. Longer shelf life of products is essential for the dairy industry to remain prosperous because of the change in distribution practices. This is due to the decrease in the number of dairies and an increase in larger herds (Olson, 2001), which increases the average distance between processing locations and the consumer. Increased shelf life can increase the processing and distribution efficiency, reduce spoilage and insure the consumer receives higher quality dairy products.
Each dairy product has its own processing procedures and problems. Two major issues related to the processing performance of sour cream are fouling of the smoothing valve and the stability to syneresis during freezing and thawing. To render the texture of
an acidified gel commercially acceptable as sour cream, the process of smoothing is introduced after the gel network is broken. Although several techniques have been used to smooth the texture, one of the most popular is the use of a single service
homogenization value. This valve can be described as a tightly woven stainless steel plug that creates a mild shear force by flow diversion when the product is pumped through it (Hunt and Maynes, 1997).
One of the new methods of extending shelf life of dairy products is microwave heating. Currently available industrial methods of heating (indirect heating using plate or tubular heat exchangers and direct heating using steam injection or infusion) cause undesirable quality changes in dairy products such as ‘cooked’ flavors, especially in viscous thermo-sensitive products. Increased fouling of the heat exchanger walls can also occur which can raise processing costs due to cleaning and maintenance. To achieve the UHT pasteurization of sour cream without these negative effects, the use of rapid continuous non-contact heating using cylindrical microwave heaters was
implemented. Cylindrical microwave heaters/reactors are patented devices providing a focused, uniform high powered microwave energy field across a cylindrical exposure region containing a microwave transparent tube made of Teflon® through which the
Very little is known about microwave heating of sour cream for extended shelf life (ESL) products. J.J. Tuchyet al 1987 demonstrated that cream and sour cream shelf life could be extended by using a hot fill system where the product is heated to 73-80°C, then taken directly from the pasteurizer and filled into plastic pouches on a Jencopack FFS machine. Pouches were then cooled to l0° C in 15-20 minutes by immersion in a water bath cooled to 3° C. In the second system, which was an ultra clean cold-filling system, product from the chilled section of the pasteurizer was filled into form fill-seal pouches that had been sterilized in a unit utilizing H2O2 high intensity UV light, hot
sterile air and bacterial filters. Product contact surfaces down stream of the pasteurizer were cleaned at 88° C. Both systems improved keeping quality of product held at 4-7° C compared with the commercially pasteurized controls. Products filled on the ultra-clean system had longer shelf life than those filled on the hot fill system (e.g. shelf life of low acid products were extended by approximately 10 days). The hot fill system was an effective method for high acid dairy products such as sour cream. Microwave heating coupled with thermal properties of food materials and variation of thermal delivery as a result of processed material property variation have been provided by the following researchers; Saltiel and Datta 1998, Zhong and Datta 1999, Datta 2000, H. Zang and Datta 2000, Lau et al. 1998, 1999a, 1999b.
attempt to address the key issues of microwave processing in an industrial environment, such as thorough and even heating of the product. Despite more than a 30-year history of research and development, continuous microwave pasteurization and sterilization of foods is still considered an alternative and emerging technology. As such, it is subject to special scrutiny by the government regulatory agencies to insure that the products marketed to the public using this technology are safe. A report by Fleishman and Larken 2000 presented the U.S. Food and Drug Administration perspectives on
microwave pasteurization and sterilization processes. Compared to other alternative and emerging technologies for food processing, continuous processing of homogeneous fluid foods using microwave energy appears to be in a very favorable position for rapid commercialization and is facing the lowest level of regulatory concern.
2.3 Protein Gelation, Aggregation, and Stabilization
Historically, acidification of heated milk was applied as a preservation
technique. Now, acidified products like yogurt are highly appreciated for their texture, taste and health properties. During yogurt and sour cream preparation, the milk is subjected to a heat treatment before acidification. Therefore, production of yogurt (and sour cream) can be seen as a two-step process (Vasbindera et al, 2003).
On heat treatment at temperatures higher than 70°C the major whey proteins, i.e.
Acidification of milk towards the pI of casein, i.e. pH 4.6, lowers the stability of the k-casein on the surface of the casein micelles (Tuinier & De Kruif, 2002). The casein micelles loose their steric stabilization and Van der Waals attraction causes flocculation. Heat treatment of milk prior to acidification of milk at temperatures ranging from 201°C to 401°C changes the gelation properties markedly compared to those of unheated milk. Heat treatment has caused a shift in gelation pH towards higher pH values (Heertje et al, 1985; Horne & Davidson, 1993; Lucey at al, 1997; Vasbinder, et al, 2001). The final gel formed has an increased gel hardness, higher storage
modulus(G’) (Lucey et al., 1997; Lucey et al, 1998; Parnell-Clunies, et al, 1988; van Vliet & Keetels, 1995) and shows less susceptibility to syneresis. These effects are related to whey protein denaturation and the whey protein coating of the casein
micelles, causing an increase of the gelation pH from 4.6 (pI casein micelles) to 5.2 (pI whey proteins) (Vasbinder et al., 2001). Electron microscopy revealed that heat
those involving calcium bridging or the depletion of k-casein from the micelles, may play a role in the heat coagulation. Although this aggregation of casein and possible subsequent coagulation may affect the viscosity of the milk more than the denaturation of the serum proteins, very high temperatures and other specific conditions must be met (Fox and McSweeney, 1998; Walstra et al., 1999).
Addition of different proteins causes increased firmness and less syneresis. Gelatin behaved differently from milk proteins by binding large amounts of water without increasing the firmness as much as the added milk proteins. Gelatin was also superior for smoothness and appearance (Rash, 1990).
Gelatin is also a desirable dairy stabilizer because it adds a sheen-like
appearance to dairy products. It is commonly used in conjunction with modified food starch or pectin in order to prevent a jelly-like texture which occurs when gelatin is used alone (Chandan, 2006).
Experiment I - Analysis of Commercial sour creams
3.1 Introduction
To produce a UHT stable sour cream acceptable rheological limits needed to be determined. This was accomplished by analyzing the rheological properties of four different commercial sour creams (Kroger® Natural, Kroger® Original, Breakstone®,
and Westover®). The upper and lower viscosities and yield stresses were used as limits for viscosity and yield stress of the UHT stable sour cream formulation.
Yield stress is defined as the force necessary to initiate the flow of a product and is an important attribute in many foods. High yield stress is necessary in sour cream to keep it from flowing off of a baked potato or other foods. Yield stress has significant correlation (p<0.001) with the sensory firmness as perceived by panelists in laboratory-made (r=0.99) and retail (r>0.97) yogurts, independently of other physical or sensory properties. The apparent residual stress was significantly correlated with sensory
viscosity (r>0.90). Several advantages exist for assessing firmness using the yield stress including (1) less time to run the samples, (2) more power to detect differences, (3) less damage associated with sample handling, (4) avoid use of relative scales or anchors, (5) simple data analysis (homogeneous variances), (6) avoid costs associated with training and managing panelists, and (7) potential to design products based on a target yield and apparent residual stress (Harte et al, 2003).
representative of mastication and swallowing. Shear stress can be viewed as the resistance of a material to deformation and is measured as Force (F) and is usually measured in Pascals (Pa). The generation of a power law equation can be derived from the graph of these two data arrays. The power law equation assigns a numeric value to the shear-thinning behavior exhibited. Power law modeling will also assign a numeric value to identify the level of viscous behavior in the shear rate range used.
3.2 Materials and Methods
Four different brand names (Kroger® Natural, Kroger® Original, Breakstone®, and Westover®) were purchased from a local retail grocery chain. Ingredient lists of these brands in shown in table 3.1. Three individual containers were purchased for each brand. Viscosity data was collected in triplicate on the StressTech (ATS
Table 3.1: Commercial Brand Ingredient lists
Brand Ingredient List
Breakstone® Cultured pasteurized grade A milk and cream, enzymes Kroger® Natural Cultured cream, nonfat milk and enzymes
Westover® Cultured cream, skim milk, whey, modified corn starch, gelatin, sodium phosphate, guar gum, carrageenan, sodium citrate, calcium sulfate, and locust bean gum.
A pre-shear of each sample was performed on the StressTech to eliminate anomalies caused by yield stresses due to the presence of stabilizers and protein gel networks. Each sample was then dynamically tested using shear rates from zero to 1000 1/s. Corresponding shear stress and viscosity data were collected in this range. Data in the range between 10 and 100 were analyzed using Microsoft Excel. Trend lines, R2 values, and trend line equations were calculated using power law modeling. From the equations, consistency coefficients (K) and flow behavior indexes (n) values were determined (Table 3.2 and Figure 3.1). The range between 10 and 100 was used because this is the normal shear rate range for mastication, spooning or scooping, and stirring.
3.3 Results and discussion
Table 3.2 Power Law Modeling of Commercial Sour Creams (x = shear stress, y = shear rate)
Sample Power law model K n R²
Kroger® original y = 26.092x 0.3038 26.092 0.3038 0.9734 Westover® y = 29.385x 0.254 29.385 0.2540 0.9390
Viscosity
1.0E+01 1.0E+02 1.0E+03
1.0E+00 1.0E+01 1.0E+02
Shear Rate (1/s)
S
h
ear S
tr
ess
(P
a
)
Breakstone Kroger Natural Kroger Original Westover
There were significant differences in the behavior index and consistency
coefficient between all the commercial brands. The natural brands had more Newtonian behavior while the brands with stabilizers exhibited more shear-thinning behavior.
B
reaks
tone
®
Kroger® Na
tura
l
Kroger® O
rig
inal
Westover®
0.00 50.00 100.00 150.00 200.00 250.00 300.00 350.00
Samples
Yield Stress (Pa)
Table 3.3: Breakstone®, Kroger Natural®, Kroger Original®, Westover® Yield Stress data using HP Brookfield Viscometer
Yield Stress
Sample Test 1 Test 2 Test 3 Average Std. Dev.
Breakstone® 289.97 260.06 270.39 273.47 15.19
Kroger Natural® 156.44 145.86 184.37 162.22 19.90
Kroger Original® 245.93 269.97 212.46 242.79 28.88
Experiment II - Formulation determination
4.1 Introduction
A sour cream formulation that could withstand UHT treatment needed to be developed that had rheological properties between the upper and lower limits determined in the experiment I. Seven different formulations were developed to
characterize the behavior of the stabilization system which would determine the optimal combination of stabilizers. The seven formulations were rheologically analyzed using modeling techniques. A single formulation was then chosen and retested for
consistency in experiment III.
4.2 Materials and Methods
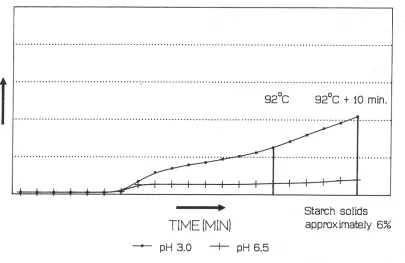
Thermtex® starch (National Starch and Chemical, Food Products division, 10 Finderne Avenue, P.O. Box 6500, Bridgewater, New Jersey 08807-0500, 908-685-5000) was chosen for this product because it is resistant to high shear, high
Figure 4.1: Thermtex® Amylograph
The 250 Bloom, type B Gelatin was supplied by Vyse Gelatin Company, Inc. 5010 North Rose Street, Schiller Park, IL 60176-1023. Cream (approximately 38 % milk fat) and milk (approximately 4% milk fat) were supplied by the North Carolina State Dairy pilot plant (Raleigh, NC). Eighty pounds (36.28 kg) of a standardized cream and milk (18% milkfat) was heated to 165° F (73.8° C) for 30 minutes in a
portion and stabilizers were incorporated using a single speed 1 quart Waring blender. The 8 pounds of mixture containing the stabilizers was then reincorporated into the remaining 16 pounds (7.26 kg). Table 4.1 shows the corresponding formulations.
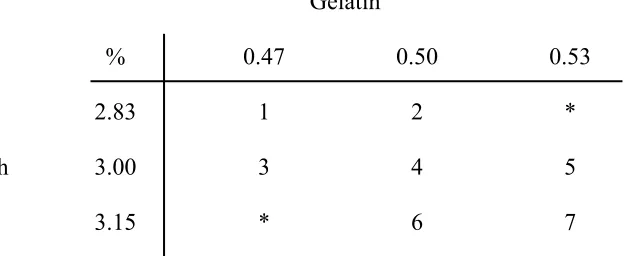
Table 4.1: Formulation Matrix. Starch and gelatin by percent total weight.
Gelatin % 0.47 0.50 0.53 2.83 1 2 * 3.00 3 4 5 Starch
3.15 * 6 7 * denotes formulations that were not implemented.
Each formulation was then homogenized in Gaulin Homogenizer (model #: 300CDG, serial number: 722 48 484699, Manton-Gaulin Mfg. Co. Everett, MA) using 500 psi 2nd phase and 2000 psi 1st phase. Besides thoroughly mixing the stabilizers and
thermally processed in the 5-kilowatt microwave (Industrial Microwave Systems, LLC, 3000 Perimeter Park Drive, Building One, Morrisville NC 27560) at a power of 3-kilowatts and a flow rate of 4.0 L/minutes until a temperature of 130° C was reached. Dielectric data were collected at 5° C increments during the processing. It was then cooled to 80° C by covering the processing pipes with ice. The sour cream was placed into 5-pound containers and stored for 2 months at 4° C. The samples were then tested on the Brookfield HP to determine yield stress values. Each sample was then analyzed using the StressTech. Rheological data were analyzed and graphed to determine significant differences.
4.3 Results and Discussion
Because of variations in heat treatment times, pumping times, and cool down times using the 5-kilowatt unit no correlation could be found between stabilizer
Underprocessing will result in less viscosity due to lack of full gelation of the starch. It is also possible that starch/gelatin interaction may interfere with increased viscosities and yield stresses in some of the formulations. These issues are worthy of further research. Because of these issues it was inconclusive which of the formulations was optimal. Several different formulations could prove to be optimal depending on the processing parameters. Because of this, the initial formulation was chosen because it had shown to be successful in past processing runs on the 5-kilowatt microwave unit.
Average Outlet Temperature (C)
0 20 40 60 80 100 120 140
0 1000 2000 3000 4000 5000 6000
Time (sec)
T
em
p
eratu
re
Table 4.2: Combinations of modified waxy maize starch and modified tapioca maltodextrin (10% aqueous solutions) after heating to 82° C , followed by
homogenization at 10.3 MPa and cooling to 65° C and gel strength after cooling to 4° C (Hunt, Maynes, 1997).
Starch Type1
Thermtex® N-lite D® Hot viscosity Cold gel strength (%) (cP) (mm) 0 100 3 110 10 90 4 114 20 80 6 112 30 70 10 110 40 60 39 90 50 50 282 74 60 40 515 90 70 30 6510 70 80 20 9,600 84 90 10 37,750 110
1Thermtex®, a modified waxy maize starch and N-Lite D®, modified tapioca maltodextrin, were obtained from National Starch and Chemical Company.
B reaks tone® Kr og er ® Na tu ra l Kr og er ® Or ig in al We st ov er ®
5 3 1 4 2 7 6
0.00 50.00 100.00 150.00 200.00 250.00 300.00 350.00 Samples Y ie ld S tre ss (P a)
Figure 4.3: North Carolina State University sour cream formulation yield stress and commercial brand yield stresses
Table 4.3 Significant differences between sour cream yield stresses using 1-way ANOVA statistical analysis.
Figures 4.4 and 4.5 graph the relationships between the NCSU sour cream formulations, Breakstone and Kroger Original respectively. As the graphs depict, all the NCSU sour creams had higher viscosities than the commercial brands. Table 4.5 contains the power law equations for the seven NCSU sour cream formulations. Statistical analysis using 1-way ANOVA statistical analysis of K and n values showed significant differences between all the samples (commercial and NCSU sour creams).
viscosity
1.00E+01 1.00E+02 1.00E+03
1.00E+00 1.00E+01 1.00E+02
Shear Rate (1/s)
S
h
ear Stre
ss
(Pa)
Sample 1 Sample 2 Sample 3 Sample 4 Sample 5 Sample 6 Sample 7 Breakstone 1 Breakstone 2 Breakstone 3
viscosity
1.00E+01 1.00E+02 1.00E+03
1.00E+00 1.00E+01 1.00E+02
Shear Rate (1/s)
S
h
ear Stre
ss
(Pa)
Sample 1 Sample 2 Sample 3 Sample 4 Sample 5 Sample 6 Sample 7 Kroger Original 1 Kroger Original 2 Kroger Original 3
Table 4.4: NCSU sour cream sample yield stress data from Brookfield HB
Sample Test 1 Test 2 Test 3 Average Std. Dev.
5 128.41 90.48 127.07 115.32 21.52
3 117.87 111.59 92.04 107.17 13.47 1 95.09 89.52 84.04 89.55 5.525
4 182.57 161.80 185.45 176.61 12.90 2 191.20 160.15 191.83 181.06 18.11 7 113.65 115.69 99.43 109.59 8.858
6 159.79 167.69 175.27 167.58 7.741
Table 4.5 Power law equations for North Carolina State University sour cream formulations
Sample Power law model K n R²
Because of the inconsistencies between formulations and expected viscosities dielectric data were also analyzed. Dielectric data were collected for MWS1-7 in the range 30° C to 130° C. The two dielectric properties are important. Dielectric loss (e”) is the ability of a material to convert microwave energy into heat. The dielectric
constant (e’) is the ability of the material to absorb microwave energy.
e' at 915 Mhz
35 37 39 41 43 45 47 49 51 53 55
30 40 50 60 70 80 90 100 110 120 130
Temperature (C)
e'
run1 run2 run3 run4 run5 run6 run7
e'' at 915 Mhz
10 15 20 25 30 35 40
30 40 50 60 70 80 90 100 110 120 130
Temperature
e''
run1 run2 run3 run4 run5 run6 run7
Experiment III -Validation of Formulation
5.1 Introduction
Formulation MWS4 needed to be validated before moving from bench
production to commercial production using the 60 kw unit. To confirm the results from experiment II, formulation MWS4 was used to produce a final batch of sour cream to be tested rheologically in triplicate. Validation of the results from this experiment were then compared to results from Experiment II.
5.2 Materials and Methods
cream premium freeze dried Lactic culture (product: ssk26, code: 089523,. Vivolac Cultures Corp. Indianapolis, IN). Fermentation was allowed to proceed for the next 18 hours. It was tested for titratable acidity before processing, which was 0.77. It was then separated into three one-8 pound (3.63 kg) portions. The three portions were named sample 8, 9, and 10. Each portion was processed with the 5kw microwave system (Industrial Microwave Systems, LLC, Morrisville NC) to a temperature of 130° C and then cooled to 80° C by covering the systems pipes with ice. It was placed in containers and stored at 4 °C for 1 month. MWS8-10 were analyzed using the StressTech as described in chapter 4.
5.3 Results and discussion
Since variations were present between all the samples from the same batch of sour cream it appears that lack of consistent processing parameters was a factor in the viscosity of the final product. Variations in processing may amplify or reduce
Table 5.1: Power law modeling equations comparing the final runs, previous formulation from chapter 4 (Sample 4) and Kroger original.
Sample Power law model K n R²
Viscosity
1.00E+01 1.00E+02 1.00E+03
1.00E+00 1.00E+01 1.00E+02
Shear Rate (1/s)
Sh
ear St
ress
(P
a
)
Sample 8(1) Sample 8(2) Sample 9(1) Sample 9(2) Sample 10(1) Sample 10(2) Breakstone Average
Viscosity
1.00E+01 1.00E+02 1.00E+03
1.00E+00 1.00E+01 1.00E+02
Shear Rate (1/s)
S
h
ear S
tress
(Pa)
Sample 8(1) Sample 8(2) Sample 9(1)
Sample 9(2) Sample 10(1) Sample 10(2) Kroger Original Average
Viscosity
1.00E+01 1.00E+02 1.00E+03
1.00E+00 1.00E+01 1.00E+02
Shear Rate (1/s)
She
a
r St
re
ss (
P
a
)
Sample 8(1) Sample 8(2) Sample 9(1) Sample 9(2) Sample 10(1) Sample 10(2) Sample 4 Average
Conclusions
Designing a successful stabilization system for a product with a dairy gel depends on the quality of the raw ingredients, use of customized ingredients for
increased performance, and how the product is processed. Processing may be done with methods that are established or with emerging new technologies, such as microwaves. In order for these products to be successful at a food service level they must be
consistent, functional, and have an extended product shelf life.
Although inconsistencies were present due to variations in heating, cooling, and pre-heating pumping times which are inherent variables in the normal operation of the 5kw microwave unit, all the formulations performed well. And although an optimal formulation could not be determined, the basic formulation using starch and gelatin is robust enough to handle variations in heating and cooling times during UHT processing.
The final formulation (Sample 4) proved to produce a sour cream that had less yield stress but higher viscosity than any of the commercial brands. Sample 4 also had no visible protein aggregation. The results of this research indicate that properly formulated sour cream can be UHT processed with continuous microwave technology to produce an acceptable product.
affects the functionality of Thermtex®. Future formulation should include freeze/thaw acceptability for use in frozen foods, such as gourmet frozen entrees.
References
Anonymous. 2003. Code of Federal Regulations(CFR), Title 21, Section 1. Anonymous. 2003. Hispanics and Food: Volume 2 –US – October 2003, Mintel Reports: USA, Food and Foodservice: USA
Anonymous. 2005. USDA/Economic Research Service. Sour cream consumption per capita.
Anonymous. 2006. http://wikipedia.org/wiki/Microwave_oven.
Bigelow, W.D., Bohart, G.S., Richardson, A.C. and Ball, C.O. 1920. Heat Penetration in Processing Canned Foods. National Canners Association Bullitin, No.16L.
Bruhn, C.M. and Bruhn, J.C. 1988. Observations on the whipping characteristics of cream. J. Dairy Sci., 71, 85-862.
Chandan, R.C., White, C.H., Kilara, A., Hui, Y.H. 2006. Manufacturing Yogurt and Fermented Milks, 1st Ed. Blackwell Publishing Ltd.
Chiu, C.P, K. Tatershi, F.V.Kosikowski and G. Armbruster. 1984. Microwave treatment of pasteurized milk. 1. Microwave Power, 19(.4), 269-272.
Corredig, M., & Dalgleish, D. G. 1996. Effect of temperature and pH on
the interactions of whey proteins with casein micelles in skim milk. Food Research International, 29, 49–55.
Cowan, R.S., 1997. A Social History of American Technology. Oxford University Press, Inc.
Dannenberg, F., & Kessler, H. G. 1998. Reaction kinetics of the denaturation of whey proteins in milk. J. Food Sci., 53, 258–263.
Datta, A.K., Anantheswa, R.C. 2001. Handbook of Microwave Technology for Food Application. Marcel Dekker, Taylor and Francis, CRC., New York.
Fleischman, G.I. and J.W. Larkin. 2000. FDA perspectives on microwave pasteurization and sterilization processes, 1FT Annual Meeting, Dallas, Texas.
Fox, P.F. et al. 2000. Cheese rheology and texture. In Fundamentals of Cheese Science, Fox et al. (eds.), ASPEN Publication, Gaithersburg, MA.
Fox, P.F. and P.L.H. McSweeney. 1998. Dairy Chemistry and Biochemistry. Blackie Academic and Professional, London, UK.
Guincamp, M., Humbert, G., & Linden, G. 1993. Determination of sulfydryl groups in milk using Ellman’s procedure and clarifying reagent. J. Dairy Sci., 76, 2152–2155. Hamid, M.A.K., Boulanger RI., S.C. Tong, RA. Gallop and RR Pereria. 1969. Microwave pasteurization of raw milk. J. Microwave Power, 4 (4), 272-275.
Handbook of Microwave Technology for Food Applications. New York. Marcel Dekker Inc.
Harte. F.M. , Clark., S, and Barbosa-Cánovas., G. V. 2003. Yield stress as predictor of firmness in yogurt. 26-7. IFT Annual Meeting. Chicago, IL.
Hashizume, K., & Sato, T. 1988. Gel-forming characteristics of milk proteins 1: Effect of heat treatment. J. Dairy Sci., 71, 1439–1446.
Heertje, I., Visser, J., & Smits, P. 1985. Structure formation in acid milk gels. Food Microstructure, 4, 267–277.
Hewe, A.G., 1. Tang, L. Luedecke L; and H. Feng. 1998. Dielectric properties of cottage cheese and surface treatment using microwaves. J. Food Eng., 37 (4), 389-410. Horne, D. S., & Davidson, C.M. 1993. Influence of heat treatment on gel formation in acidified milks. Protein and fat globule modification. In Proceedings of IDF Seminar, Munich, Germany, p. 267.
Jang, H. D., & Swaisgood, H. E. 1990. Disulfide bond formation between thermally denatured β-lactoglobulin and k-casein in casein micelles. J. Dairy Sci., 73, 900–904. Knutson, K.M., E.H. Marth and M.K. Wagner. 1988. Use of microwave ovens in pasteurized milk. J. Food Protection, 51(9), 715-719.
Kudra, T., F.R. Van De Voort, G.S.V. Rag haven and H.S. Ramaswamy. 1991.
Characteristics of milk constituents in a microwave pasteurization system. J. Food Sci., 56(4), 931-934.
Kuntz, Lynn A. 2002. Formulating by Gum, Pectin and Gelatin. Food Product Design. June.
Lau, M.H., Tang, A.A. Taub, T.C.S. Yang, C.G. Edwards and F.L. Younce. 1999b. HTST Processing offood in a microwave pouch using 915 MHZ microwaves. AICHE Annual Meeting.
Lau, M.H., Tang, J, Taub, I.A. , Yang, T.C.S., Edwards, C.G., and Younce, F.L., 1998. Microwave heating uniformity of food during 915 MHZ microwave sterilization process Proceedings of the 33rd Microwave Power Symposium, 78-81.
Lucey, J. A., Tamehana, M., Singh, H., & Munro, P. A. 1998. Effect of interactions between denatured whey proteins and casein micelles on the ormation and rheological properties of acid skim milk gels. J. Dairy Res., 65, 555–567.
Lucey, J. A., Tet Teo, C., Munro, P. A., & Singh, H. 1997. Rheological properties at smal1 (dynamic) and large (yield) deformations of acid gels made from heated milk. J. Dairy Res., 64, 591–600.
Mottar, J., & Bassier, A. 1989. effect of heat-induced association of whey proteins and casein micelles on yoghurt texture. J. Dairy Sci., 72, 2247–2256. Oldfield, D. J., Singh, H., Taylor, M. W., & Pearce, K. N. 2000. Heat-induced interactions of β-lactoglobulin and α -lactalbumin with the casein micelle in pH-adjusted skim milk. Int. Dairy J., 10, 509–518.
Parnell-Clunies, E., Kakuda, Y., deMan, J. M., & Cazzola, F. 1988. Gelation profiles of yoghurt as affected by heat treatment of milk. J. Dairy Sci., 71, 582–588.
Pofahl, T. R., & Vakaleris, D. G. 1968. Effect of heat on sulfhydryl and disulfide groups of milk proteins as measured by the spectrofluorometric method. J. Dairy Sci., 51(9), 1345–1348.
Rash, Kenneth. 1990 Compositional elements affecting flavor of cultured dairy foods. J. Dairy Sci., 73:3651-3656
Singh, H. 1993. Heat induced interactions of proteins in milk: Protein and Fat Globule Modifications. IDF Seminar, pp. 191–203.
Singh, Paul R., Heldman, Dennis R. 2001 Introduction to Food Engineering, 3rd edition. Academic Press.
Sale, A.J.H. 1976. A review of microwave for food processing. J. Food Technology, 11, :319-329.
Saltrel, C. and Datta, A.K. 1998. Heat and mass transfer in microwave processing. ADV. Heat Transfer, 33, 1-94.
Simon, M., A.P. Hansen and C.T. Young. 2001. Effect of various packaging materials on the headspace analysis of ultrapastuerized milk. J. Dairy Sci. 84, 774-783.
Stephen, A.M. ed. 1995. Food Polysaccarides and Their Applications. Marcel Dekker, Inc., New York, N.Y.
Tamime, A.Y. and R.K. Robinson. 1999. Yoghurt: Science and Technology, 2nd edition. CRC Press LLC, Boca Raton, FL.
Tuinier, R., & De Kruif, C. G. 2002. Stability of casein micelles in milk. J. Chem. Phys., 117(3), 1290–1295.
Appendix B: StressTech program information
FlowCurve C25 Sample vol 15.9cc Serrated Bob
Sample loading method: To gap
Maximum loading force 2.000E+1 N Proceed when force is below 1.000E+1 N or when waiting more then 1.000E+3 s
Limit loading speed below 10.000 mm to 0.300 mm/s Set temperature 4.0 ºC Equilibrium time 60.0 s Prompt for rotor release
Manual control Number of measurements 2 Measurement interval 6.000E+1 s
Shear rate table Shear rate 1.000E-1 - 1.000E+2 1/s Time 600.0 s No. of Measurements 60
Appendix C:
V1.0 Brookfield Viscometer Model: HB program
parameters
V1.0 Brookfield Viscometer Model: HB
Spindle No.: 72 Program: EZ-Yield Test Parameters: Pre-shear(rpm): 0 Auto-zero speed(rpm): 0 Run speed(rpm): 0.03
Base Increment Calibration(%): 0.9 Immersion mark: Secondary
Pre-shear time (sec): 0 Wait time (sec): 0