The eRHIC Project
Thomas Burton1,a
1Brookhaven National Lab P.O. Box 5000 Upton, NY 11973-5000
Abstract. The eRHIC project plans to expand Brookhaven National Laboratory’s Rela-tivistic Heavy Ion Collider (RHIC) with a high-intensity electron beam. Building on the exciting discoveries of RHIC, CERN, HERA and others, eRHIC will break new ground in collider luminosity and will push the frontiers of knowledge in nucleon and nuclear structure and in spin physics. The varied eRHIC physics programme and the proposed machine design will be presented and discussed.
1 Introduction
The Relativistic Heavy Ion Collider (RHIC) is a hadron-hadron collider located at Brookhaven Na-tional Laboratory. It is capable of colliding nuclei over a very wide range of masses, from protons to uranium. Protons can be spin-polarised, making RHIC the only polarised proton-proton collider in the world. Operating since 2000, RHIC has contributed many important discoveries in the field of nuclear and spin physics.
BNL’s long-term plan for RHIC envisages expanding the complex with a high-intensity electron beam. This “eRHIC” would then expand on scientific legacy of both RHIC and e-p experiments such as H1, ZEUS, HERMES and COMPASS, pushing new frontiers in precision studies of nuclear structure. eRHIC would represent several advances over HERA, the world’s only previous electron-hadron collider. eRHIC would afford vastly increased luminosity: up to a thousand times that of HERA. eRHIC would also utilise RHIC’s wide variety of beam species and energies (from 50 to 250 GeV protons, for example). Both electron and proton beams would be highly polarised, opening the avenue for high-precision and high-energy spin measurements not possible at lower-energy, fixed-target experiments like HERMES and COMPASS. Additionally, compared to the current capabilities of RHIC, the use of electron-proton collisions would open a wide range of precision studies of nucleon and nuclear structure not possible with hadron-hadron collisions.
The proposed layout of the upgraded eRHIC complex is presented in figure 1. A pair of energy-recovery linear accelerators (Linacs) would be used to accelerate electrons to their maximum energy over multiple passes. The electrons would then be steered into collisions with the hadron beam, decelerated and dumped, The electron beam line would not be a storage ring, but essentially a “Linac in a ring” - the electron beam would be used in only one collision before being discarded. This maintains a beam with low emittance, which measures the momentum and spatial spread of the beam, therefore yielding higher luminosity. The use of energy-recovery linacs [1], which recycle the energy of the electron beam, is one example of the novel technologies to be deployed at eRHIC; others include
ae-mail: [email protected]
DOI: 10.1051/
C
Owned by the authors, published by EDP Sciences, 2014
/2014 00 07 0
eSTAR
ePHENIX 30 GeV
30 GeV 100 m
Linac 2.45 GeV
Linac 2.45 GeV
Coherent e-cooler
Polarized e-gun
Beam dump 0.60 GeV
5.50 GeV
10.4 GeV
15.3 GeV
20.2 GeV
25.1 GeV
30.0 GeV
3.05 GeV
7.95 GeV
12.85 GeV
17.75 GeV
22.65 GeV
27.55 GeV
0.6 GeV
0.6 GeV
27.55 GeV New detector
Figure 1.Proposed layout of the eRHIC complex. A pair of energy-recovery Linacs and a polarised electron gun would provide a high-energy,
high-intensity polarised electron beam. A new dedicated detector would be constructed, while the existing PHENIX and STAR experiments could also be upgraded to measure e-p collisions. The employment of novel technologies, such as coherent electron cooling of the hadron beam to enhance luminosity, are part of the eRHIC upgrade path.
the use of coherent electron cooling to enhance the hadron beam intensity, and the development of a new, high-intensity polarised electron source.
A key feature of the eRHIC plan isstageability. The maximum electron beam energy can be increased simply by adding more radio frequency cavities to the Linacs. This allows the cost of the Linacs to be spread over a number of years of construction. In developing the science case for eRHIC, care has been taken to ensure that there is a vibrant and varied physics programme throughout the staging from low to high energy.
1.1 Why DIS?
RHIC continues to run a successful hadron-hadron programme, so why look to electron-nucleus col-lisions? In a word: precision. In a hadron-hadron collision, one probes the object of interest (a proton or ion) with another such object. Both of these are composite, strongly interacting particles, and as a result one does not directly probe the initial kinematics of the partons (quarks and gluons) involved in the collision. In a DIS interaction, the electron scatters via the exchange of a virtual photon (figure 2) that resolves a single quark in the target proton. The beauty of DIS is that by measuring only the en-ergyandscattering angleof the electron, the quantitiesQ2andx, which define the entire photon-quark kinematics of the interaction, can be constructed (see definitions in figure 2). The photon emitted from the electron acts like a high-energy microscope, precisely resolving the quark. In this way the fine details of a single nucleon can be seen: DIS functions as a hadronic “femtoscope”.
k
p
X
k'
q
Figure 2.Deeply inelastic scattering (DIS): an electron,k, scatters offa proton,
p, by exchanging a virtual photon,q, with invariant mass denotedQ2.Q2defines the “resolution” of the interaction; the higher
Q2is, the more finely this internal structure of the proton is resolved. At sufficiently highQ2(1 GeV) the photon interacts with a single quark, carrying some fractionxof the proton’s momentum, rather than the proton as a whole (hence “deeply”). KnowingQ2and
xfully defines the parton-level kinematics of the collision. The interaction is inelastic, hence the proton subsequently fragments into other particles,X.
2 Polarised DIS: Studying the Spin of the Proton
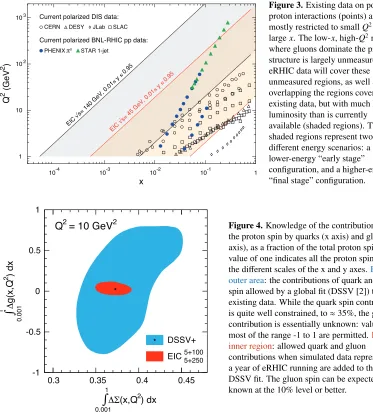
Spin is an intrinsic property of particles, a purely quantum-mechanical feature with no true classical explanation. The proton is not a point particle, so where does it’s spin come from? Experiments over the past 20 years have demonstrated that the simplest answer - that a proton’s spin comes from the spins of the three valence quarks that make it - is not true. It is now known that the spin provided by all the quarks (and antiquarks) in the proton - the three “valence” quarks, plus the quark-antiquark “sea” generated via splitting of gluons exchanged within the proton - make up little more than one third of the total proton spin. How the remainder is generated remains an important open question in spin physics. While it must be in some way divided between the spin of gluons and the angular momentum of partons due to their motion in the proton, the amount that each of these sources contributes is not known. Existing measurements of the gluon spin contribution suffer from large uncertainties. With its polarised beams, eRHIC is perfectly suited to determine how much the gluon spin contributes to the proton. In particular, it has to two key advantages over previous polarised proton experiments. Firstly, it has much greater kinematic reach than previous experiments, accessing lowxand largeQ2where gluons dominate the proton structure (figure 3). Secondly, the luminosity, and therefore the amount of data that can be acquired, will be much greater, yielding vastly improved precision
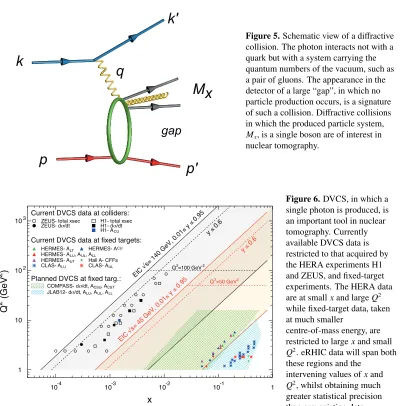
To assess the impact of eRHIC, data representing approximately a year of running were simulated with the polarised proton Monte Carlo generator PEPSI [3]. The simulated data were then added to a fit to global data; the results are shown in figure 4. With this measurement the gluon spin is constrained at the level of 5-10% or better, and the separate contributions of quark and gluon spin will be known. Whatever remains must be due to the orbital motion of quarks and gluons in the proton.
3 Nuclear tomography: Imaging Matter on the Smallest Scales
x
Q
2 (GeV 2 )
EIC
√s= 140 GeV, 0.01
≤ y ≤
0.95 Current polarized DIS data:
CERN DESY JLab SLAC
Current polarized BNL-RHIC pp data:
PHENIX π0
STAR 1-jet
1 10 102 103
10-4 10-3 10-2 10-1 1
EIC
√s= 45 GeV, 0.01
≤ y ≤
0.95
Figure 3.Existing data on polarised proton interactions (points) are mostly restricted to smallQ2and largex. The low-x, high-Q2region where gluons dominate the proton structure is largely unmeasured. eRHIC data will cover these unmeasured regions, as well as overlapping the regions covered by existing data, but with much higher luminosity than is currently available (shaded regions). The two shaded regions represent two different energy scenarios: a lower-energy “early stage” configuration, and a higher-energy “final stage” configuration.
(x,Q2) dx
1
0.001
g(x,Q
2 ) dx
1
0.001
Q2 = 10 GeV2
DSSV+
EIC 5+100 5+250
-1 -0.5 0 0.5 1
0.3 0.35 0.4 0.45
Figure 4.Knowledge of the contributions to the proton spin by quarks (x axis) and gluons (y axis), as a fraction of the total proton spin (a value of one indicates all the proton spin). Note the different scales of the x and y axes.Blue outer area: the contributions of quark and gluon spin allowed by a global fit (DSSV [2]) to existing data. While the quark spin contribution is quite well constrained, to≈35%, the gluon contribution is essentially unknown: values in most of the range -1 to 1 are permitted.Red inner region: allowed quark and gluon contributions when simulated data representing a year of eRHIC running are added to the DSSV fit. The gluon spin can be expected to be known at the 10% level or better.
measuring this transverse distribution to provide a multidimensional picture of how the partonic con-stituents of nucleons and nuclei are distributed, analogous to how medical technologies like MRI image “slices” through the brain to build up a full picture of its structure.
k
k'
p'
p
q
gap
Mx
Figure 5.Schematic view of a diffractive collision. The photon interacts not with a quark but with a system carrying the quantum numbers of the vacuum, such as a pair of gluons. The appearance in the detector of a large “gap”, in which no particle production occurs, is a signature of such a collision. Diffractive collisions in which the produced particle system,
Mx, is a single boson are of interest in nuclear tomography.
Q2=100 GeV2
Q2=50 GeV2 Planned DVCS at fixed targ.:
COMPASS- dσ/dt, ACSU, ACST
JLAB12- dσ/dt, ALU, AUL, ALL
Current DVCS data at colliders:
ZEUS- total xsec
ZEUS- dσ/dt H1- total xsecH1- dσ/dt H1- ACU
Current DVCS data at fixed targets:
HERMES- ALT HERMES- ACU
HERMES- ALU, AUL, ALL
HERMES- AUT Hall A- CFFs
CLAS- ALU CLAS- AUL
1 10 102 103
10-4 10-3 10-2 10-1 1
x
Q
2 (GeV
2 ) EIC
√s= 140 GeV, 0.01
≤ y ≤
0.95
y ≤ 0.6
y ≤ 0.6
EIC
√s= 45 GeV, 0.01
≤ y ≤
0.95
Figure 6.DVCS, in which a single photon is produced, is an important tool in nuclear tomography. Currently available DVCS data is restricted to that acquired by the HERA experiments H1 and ZEUS, and fixed-target experiments. The HERA data are at smallxand largeQ2 while fixed-target data, taken at much smaller
centre-of-mass energy, are restricted to largexand small
Q2. eRHIC data will span both these regions and the
intervening values ofxand
Q2, whilst obtaining much greater statistical precision than any existing data.
and gluons. Nuclear tomography therefore allows us to peer into the nucleon and see how its spin distorts the distribution of its components.
4 Saturation
-1.5 -1 -0.5 0 0.5 1 1.5 -1.5
-1 -0.5 0 0.5 1 1.5
-1.5 -1 -0.5 0 0.5 1 1.5
[0.0, 0.01] [0.0, 0.02] [0.0, 0.05] [0.0, 0.10] [0.1, 0.20] [0.2, 0.30] [0.3, 0.40] [0.4, 0.50] [0.5, 0.60] [0.6, 0.70] [0.7, 0.80] [0.8, 0.90] [0.9, 0.94] [0.9, 0.97] [0.9, 0.99] [0.9, 1.00]
by
(fm)
bx (fm) bx (fm)
q⇑(x=10-3,b→,Q2 = 4 GeV2)
q(x=10-3,b→,Q2 = 4 GeV2)
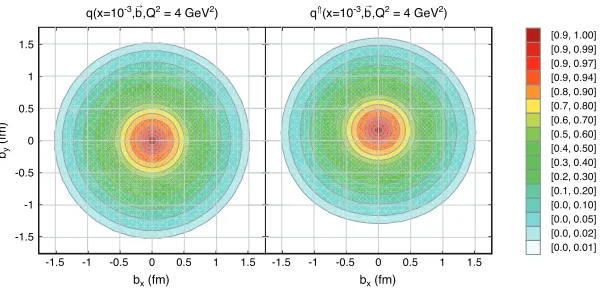
Figure 7. 2D spatial distributions of quarks in a proton, extracted using simulated data in eRHIC kinematics (left). When the spin of the the proton is included, parallel to the x direction, the distribution is shifted.
density cannot increase indefinitely, but must at some point be tamed to stop the gluon distribution becoming infinitely large.
Saturationis a mechanism proposed to cause this taming of the gluon distribution. Just as glu-ons can split, so too can two small-xgluons recombine to produce a single larger-xgluon. As the gluon density increases, so to does the rate of recombination, and this counters the gluon splitting to eventually “saturate” the gluon distribution at some constant value. Though there have been hints of saturation seen in data from RHIC, it has not yet been categorically proven. eRHIC will provide an excellent laboratory to not only test the existence of saturation, but characterise its properties. Key to eRHIC’s suitability is it’s ability to use nuclear beams. A large nucleus, such as gold (A=197) or uranium (A=238), yields a much higher density of gluons than a proton, allowing saturation effects to manifest at much largerxthan in a proton. As access to smallxrequires large energy, the practical result of this is that one requires lower beam energies to observe saturation with a nuclear beam than with a proton beam. While HERA was not able to observe saturation in e-p collisions, eRHIC will be able to investigate the saturation regime despite significantly lower centre-of-mass energy.
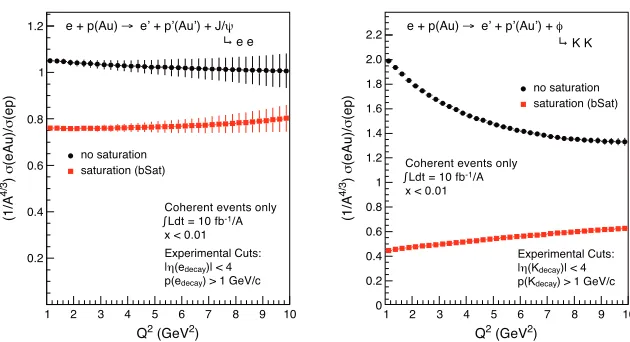
A number of signatures have been proposed for observing saturation. One of the most promising is exclusive production of mesons, such as theφand J/psi, already of interest for their utility in nuclear tomography (section 3). The ratio of the cross section with a heavy nucleus, such as gold, to that with a proton is very sensitive to the existence of saturation, as shown in figure 8. Such clear signatures will strikingly reveal saturation if it is present.
5 Summary
0.2 0.4 0.6 0.8 1 1.2
Coherent events only
∫Ldt = 10 fb-1/A
x < 0.01 Experimental Cuts: |η(edecay)| < 4 p(edecay) > 1 GeV/c
Coherent events only
∫Ldt = 10 fb-1/A
x < 0.01
1 2 3 4 5 6 7 8 9 10
(1/A
4/3
)
σ
(eAu)/
σ
(ep)
Q2 (GeV2)
no saturation saturation (bSat)
no saturation saturation (bSat)
e e e + p(Au) → e’ + p’(Au’) + J/ψ
1 2 3 4 5 6 7 8 9 10
(1/A
4/3
)
σ
(eAu)/
σ
(ep)
Q2 (GeV2)
2.2
2.0
1.8
1.6
1.4
1.2
1
0.8
0.6
0.4
0.2
0
e + p(Au) → e’ + p’(Au’) + φ
K K
Experimental Cuts: |η(Kdecay)| < 4
p(Kdecay) > 1 GeV/c
Figure 8. Ratio between the cross section for exclusive meson production on a gold nucleus and a proton, simulated with the Monte Carlo generator Sartre. The ratios for J/ψproduction are on the left,φproduction on the right. The error bars (which are smaller than the points in the case ofφproduction) are statistical and represent around a year of data. The differences between predictions in the case of no saturation (black) and saturation (red) are clear.
References
[1] M. Tigner, Nuovo Cimento37, (1965), 1228-1231.