a
a
n
n
d
d
E
E
c
c
h
h
o
o
-
-
A
A
c
c
o
o
u
u
s
s
t
t
i
i
c
c
O
O
b
b
j
j
e
e
c
c
t
t
N
N
o
o
r
r
m
m
a
a
l
l
i
i
z
z
a
a
t
t
i
i
o
o
n
n
i
i
n
n
E
E
c
c
h
h
o
o
l
l
o
o
c
c
a
a
t
t
i
i
n
n
g
g
B
B
a
a
t
t
s
s
D
D
i
i
s
s
s
s
e
e
r
r
t
t
a
a
t
t
i
i
o
o
n
n
d
d
e
e
r
r
F
F
a
a
k
k
u
u
l
l
t
t
ä
ä
t
t
f
f
ü
ü
r
r
B
B
i
i
o
o
l
l
o
o
g
g
i
i
e
e
d
d
e
e
r
r
L
L
u
u
d
d
w
w
i
i
g
g
-
-
M
M
a
a
x
x
i
i
m
m
i
i
l
l
i
i
a
a
n
n
-
-
U
U
n
n
i
i
v
v
e
e
r
r
s
s
i
i
t
t
ä
ä
t
t
M
M
ü
ü
n
n
c
c
h
h
e
e
n
n
M
M
a
a
i
i
k
k
e
e
S
S
c
c
h
h
u
u
c
c
h
h
m
m
a
a
n
n
n
n
M
T
Ta
ag
g
de
d
er
r
m
mü
ün
nd
dl
li
ic
c
he
h
e
n
n
P
Pr
r
üf
ü
f
un
u
ng
g:
:
F
Fr
re
ei
it
ta
ag
g,
,
de
d
er
r
1
1
3.
3
.0
04
4.
.2
20
0
07
0
7
G
Gu
ut
ta
a
ch
c
ht
te
er
r:
:
1
1.
.
PD
P
D
D
Dr
r
.
.
W
Wi
ie
eg
gr
re
eb
be
e
2
2.
.
Pr
P
ro
of
f.
.
D
Dr
r.
.
S
Sc
ch
hu
ul
ll
le
er
r
3
3.
.
Pr
P
ro
of
f.
.
D
Dr
r.
.
G
Gr
ru
up
pe
e
4
4.
.
Pr
P
ro
of
f.
.
D
Dr
r.
.
S
St
ta
ar
rc
c
k
k
5
5.
.
Pr
P
ro
of
f.
.
D
Dr
r.
.
F
Fo
oi
it
tz
zi
ik
k
6
t
Summary ____________________________________________________________________i
Echo suppression in bats ___________________________________________________ 1
1.1 Introduction __________________________________________________________ 2
1.2 Experimental procedures ______________________________________________ 10
1.2.1 Animals__________________________________________________________________ 10
1.2.1.1 Megaderma lyra ______________________________________________________ 10
1.2.1.2 Phyllostomus discolor __________________________________________________ 11
1.2.2 Experimental setup _________________________________________________________ 12
1.2.2.1 Megaderma lyra ______________________________________________________ 12
1.2.2.2 Phyllostomus discolor __________________________________________________ 15
1.2.3 Experimental design ________________________________________________________ 16
1.2.4 Stimuli __________________________________________________________________ 18
1.2.4.1 Active-acoustic paradigm: echo suppression in echolocation ____________________ 18
1.2.4.2 Passive-acoustic paradigm: echo suppression with external sounds_________________ 19
1.3 Results _____________________________________________________________ 24
1.3.1 Active-acoustic paradigm: echo suppression in echolocation _____________________ 24
1.3.2 Passive-acoustic paradigm: echo suppression with external sounds _____________________ 27
1.3.2.1 Echo suppression with impulses __________________________________________ 28
1.3.2.2 Echo suppression with contact calls _______________________________________ 29
1.3.2.3 Echo suppression with inverted contact calls ________________________________ 30
1.3.2.4 Echo suppression with the first syllable of the contact call______________________ 31
1.4 Discussion ___________________________________________________________ 32
Object-oriented echo perception ____________________________________________ 42
2.1 Introduction _________________________________________________________ 43
2.2 Experimental procedures ______________________________________________ 48
2.2.1 Experimental animal ________________________________________________________ 48
2.2.2 Experimental design ________________________________________________________ 49
2.2.3 Impulse responses__________________________________________________________ 49
2.2.4 Experimental setup _________________________________________________________ 52
2.2.5 Training procedure _________________________________________________________ 54
2.2.6 Computation of the significance of the data ______________________________________ 54
2.2.7 Simulation of the classification of scaled virtual objects via auditory spectrograms in P discolor
_______________________________________________________________________________ 55
2.3 Results _____________________________________________________________ 59
2.4 Discussion ___________________________________________________________ 61
2.4.1 Comparison with previous studies _____________________________________________ 61
2.4.2 Physiological correlates for auditory object normalization in echolocating bats __________ 63
2.4.3 Towards a functional model of echo-acoustic object normalization _____________________ 65
2.4.3.1 The extraction of impulse responses _______________________________________ 65
2.4.3.2 Auditory IR normalization ______________________________________________ 66
2.4.3.2.1 Auditory IR normalization in the time domain _______________________________ 66
2.4.3.2.2 Auditory IR normalization in the frequency domain: __________________________ 66
2.4.4 Problems and perspectives ___________________________________________________ 68
References _________________________________________________________________ 72
Figure List _________________________________________________________________ 78
Acknowledgements __________________________________________________________ 80
Curriculum vitae ___________________________________________________________ 81
Publication list _____________________________________________________________ 82
Kommunikation von entscheidender Bedeutung.
Echoortende Fledermäuse haben eine außergewöhnliche Fähigkeit entwickelt, um mit
akustischen Reizen umzugehen. Sie sind zu einem großen Teil auf die Bewertung von
Echos ihrer Echoortungsrufe angewiesen. Dieses Echoabbildungssystem ermöglicht es
ihnen unter anderem, auch kleinste Beute wie Insekten zu detektieren, jagen und zu fangen
sowie Hindernissen auszuweichen. Dies geschieht gewöhnlich in völliger Dunkelheit.
Auch die Verarbeitung externer, echoortungsunabhängiger Schalle spielt für Fledermäuse
eine große Rolle, sei es bei der passiven Beutelokalisation anhand Beute-generierter
Geräusche oder bei sozialer Interaktion.
Die vorliegende Arbeit befasst sich mit zwei unterschiedlichen Aspekten der sehr
komplexen echo-akustischen Situation, mit der diese außergewöhnlichen Tiere in ihrem
Alltag konfrontiert sind.
Im ersten Abschnitt wird die Frage behandelt, wie Fledermäuse mit irreführender
räumlicher Information in Echos umgehen.
Akustische Orientierung findet meist in hallenden Umgebungen statt. Die präzise
Lokalisation von Schallquellen in natürlichen, hallenden Umgebungen ist eine wesentliche
Aufgabe des auditorischen Systems. Verhaltensstudien zeigen, dass das auditorische
System für die präzise Lokalisation von Schallquellen nur die räumliche Information des
Schalls, welcher zuerst das Ohr erreicht, nutzt. Die räumliche Information in den zeitlich
verzögert am Ohr eintreffenden Echos wird unterdrückt (‚Precedence effect’).
Für Fledermäuse ist der Precedence effect in der Echoverarbeitung sinnvoll, wenn es um
die Lokalisation von externen, echoortungsunabhängigen Schallquellen geht. Geht es
jedoch um die Verarbeitung der Echos von Echoortungsrufen scheint die Unterdrückung
von Echos kontraproduktiv zu sein.
In dieser Studie wurde in einem 2AFC (two- alternative, forced- choice) Paradigma
untersucht, ob und in welchem Ausmaß die echoortenden Fledermäuse Megaderma lyra
Echoortungsrufe unterdrücken. Weiterhin wurde untersucht, wie Fledermäuse mit Echos
von unterschiedlichen, echoortungsunabhängigen Schallquellen umgehen.
Die Ergebnisse zeigen, dass M. lyra und P. discolor generell die räumliche Information
eines zweiten Echos ihres Echoortungsrufes nicht unterdrückten. Dies war unabhängig von
der zeitlichen Verzögerung zwischen ersten und zweiten Echo. Nur ein M. lyra-
Individuum zeigte eine signifikante Unterdrückung der räumlichen Information des
zweiten Echos. In einer exakten Wiederholung des Experimentes trat diese
Echounterdrückung jedoch nicht erneut auf. Weiterhin konnte gezeigt werden, dass
Echounterdrückung bei der Fledermaus M. lyra auf externe, echoortungsunabhängige
Schalle begrenzt ist, die eine semantische Bedeutung für die Fledermaus tragen, wie das
der Fall bei einem arttypischen Kontaktlaut ist. Abstrakte Schalle wie ein akustischer
Impuls, ein zeitinvertierter Kontaktlaut oder die erste Silbe des Kontaktlautes riefen keine
spontane Echounterdrückung hervor.
Diese Daten zeigen, dass Fledermäuse zwar grundsätzlich in der Lage sind, die räumliche
Information in Echos zu unterdrücken; dies scheint aber nicht der ‚default’ Mechanismus
in ihrer Echoverarbeitung zu sein. Es ist denkbar, dass der Grund für dieses ungewöhnliche
Fehlen des Precedence effects bei Fledermäusen möglicherweise in den sehr kurzen
Integrationszeiten der auditorischen Filter im Ultraschallbereich liegt. Für die beobachtete
fakultative Echounterdrückung spielt somit der Einfluss von kognitiven Komponenten, die
mit dem Precedence effect assoziiert sind, eine wichtige Rolle. Diese Studie unterstreicht
den Einfluss höherer auditorischer Verarbeitungsebenen für die Echounterdrückung.
Das Ziel des zweiten Abschnitts dieser Arbeit war es zu untersuchen, wie Fledermäuse die
Unterschiede in Echos von unterschiedlich großen Objekten bewerten.
Echoortende Fledermäuse können dreidimensionale Objekte allein durch die Analyse der
Echos ihrer Echoortungsrufe identifizieren. Allerdings können sich Objekte mit gleicher
Struktur in der Größe unterscheiden. Damit Objekte trotz dieser Größenvarianz ohne
Probleme erkannt werden können, muss das auditorische System eine größen-invariante,
normalisierte Repräsentation der Objekte erstellen.
Diese Verhaltensstudie beschreibt die Klassifikation von Echos von komplexen virtuellen
Objekten unterschiedlicher Größe. In einem Phantom-Ziel-Rückspielexperiment konnte
elektrophysiologischen Studie wurden Populationen von kortikalen Neuronen gefunden,
die diese psychophysische Leistung in einem größen-invarianten Antwortverhalten
widerspiegeln. Es konnte in diesem zweiten Projekt erfolgreich gezeigt werden, dass
echoortende Fledermäuse in der Tat ein Konzept von auditorischer Objektnormalisierung
Summary
The processing of acoustic cues is critical for all animals in a wide range of behaviours
including orientation, predator-prey interactions and social communication. The auditory system can process these sound information with amazing precision.
Echolocating bats have developed an extraordinary ability to deal with acoustic cues. Their
echo-imaging system has enabled them to detect, pursue and capture tiny prey like insects,
to avoid obstacles and to interact with their environment, often in total darkness. Bats
heavily rely on the evaluation of echoes for orientation and hunting. The evaluation of
external, echolocation- independent sounds also plays an important role for bats, e.g. while
localizing prey via prey-generated noise or for social purposes.
The current thesis addresses two different aspects of the very complex echo-acoustic
situation these extraordinary animals are confronted with in their daily life.
The first approach of this thesis is concerned with the question how bats deal with
misleading spatial information of echoes.
Acoustic orientation most often takes place in echoic environments. Accurate sound
localization in natural, echoic environments is a vital task of the auditory system. Many
behavioral studies have shown that for accurate sound localization, the auditory system
relies only on the spatial information provided by the first wave front and that spatial
information of the (delayed) echoes is suppressed (‘precedence effect’). For a bat, this
approach is also useful when localizing external, echolocation-independent sound sources,
but it is in conflict with the processing of the echoes of self-generated sounds in an
echolocation context.
In a two-alternative, forced choice paradigm, it is investigated whether and to what extend
the echolocating bats Megaderma lyra and Phyllostomus discolor spontaneously suppress
the spatial information of either a second echo of their sonar emission or echoes of
different external, echolocation-independent sounds. In general, M. lyra and P. discolor
did not suppress the spatial information of a second echo independent of the delay. Only
one M. lyra showed significant echo suppression. However, this suppression could not be
confirmed in an exact repetition of the experiment. Furthermore, it is shown that in the bat
impulse, a time-inverted contact call, or only the first syllable of the contact call do not
induce spontaneous echo suppression.
The current data indicate that while bats may be able to suppress the spatial information of
echoes, this is not their default mode of auditory processing. The reason for this
exceptional absence of spatial echo suppression may lie in the shorter time constants of
cochlear processing in the ultrasonic frequency range and the strong influence of cognitive
components associated with the precedence effect. This study emphasises the contribution
of high-level semantic auditory processing to echo suppression.
The aim of the second approach was to characterize how echolocating Phyllostomus
discolor deals with size-induced variations in echoes due to different-sized ensonified
objects. Echolocating bats can identify three-dimensional objects exclusively through the
analysis of acoustic echoes of their ultrasonic emissions. However, objects of the same
structure can differ in size and the auditory system must achieve a size-invariant,
normalized object representation for reliable object recognition.
This study describes the behavioral classification of echoes of complex virtual objects that
vary in object size. In a phantom-target playback experiment, it is shown that the bat
P. discolor spontaneously classified most scaled versions of objects according to trained
standards. This psychophysical performance is reflected in electrophysiological responses
of a population of cortical units received from a cooperated study, which showed an
object-size invariant response. The current results indicate that echolocating bats have
Echo suppression in bats
Is there an echo in here?
Part of this chapter is already published in The Journal of Experimental Biology (2006) under the title
“Spatial echo suppression in the echolocating bats Megaderma lyra and Phyllostomus discolor” by Maike
Schuchmann, Mathias M. Huebner and Lutz Wiegrebe.
A second publication under the title “Semantic meaning determines spatial echo suppression in bats” by
Maike Schuchmann and Lutz Wiegrebe is in preparation for Current Biology.
As this chapter is a continuation of my Diploma Thesis “Lokalisationsdominanz im Rahmen der
Echoortung” (2003), some data out of this thesis is presented again to provide a more detailed insight in the
1.1 Introduction
Humans spend most of their time in reverberant environments. Echoes are a fundamental
feature of these acoustic environments. While communicating in e.g. lecture halls, in
offices, public transportation and other enclosed rooms listeners are confronted with a
mixture of echoes. The speaker’s voice- or any other sound- reaches the listeners’ ear not
only directly (see Figure 1 (1)), but is also reflected by nearby surfaces like walls. These
echoes reach the listeners’ ear indirectly some milliseconds after the direct sound (see
Figure 1 (2)). Each of these echoes carries its own set of localization cues and provides
misleading information about the speaker’s spatial position Thus, evaluating confusing
spatial information contained in echoes would complicate a correct speaker localization.
Nevertheless, despite these existing echoes, correct localization of a speaker’s position is
easily possible. In the first chapter of this thesis, a mechanism for this accurate sound
localization is investigated.
Figure 1: sound travel path
In reverberant environments, a sound (here displayed by the loudspeaker symbol) reaches the listeners’ ear
not only via a direct path (1), but can also be reflected by nearby objects like a wall (2). This echo reaches
the listeners’ ear shortly after the direct sound and carries misleading spatial information about the position
of the sound source. Evaluating the spatial information in the echo would lead to a wrong localization of the
sound source nearby the reflecting surface.
1 2
1
1 2
As mentioned above, localization of sound sources in a natural environment is
complicated by echoes related to the sound source. In order to avoid localization errors the
auditory system must resolve which cues come directly from the sound source and has to
suppress the misleading spatial information of echoes.
A psychophysical phenomenon relevant to sound localization in reverberant environments
is commonly known as the ‘precedence effect’ (Wallach et al., 1949).
Accurate sound localization is possible for most animals because the spatial information
cues from the direct and shortest path from sound source to listener carries greater
perceptual weight than the spatial information in the echoes. Only the directional
information of the sound which reaches the ear first dominates the perceived position of a
sound source. The spatial information of echoes is suppressed.
A common behavioural paradigm used to examine the precedence effect is to simulate a
direct sound source (‘lead’) and a single echo (‘lag’) with two loudspeakers in an anechoic
chamber (see Figure 2). The speakers are placed in the left and right hemi field equidistant
to the listener, each presenting identical sounds offset in time such that the lagging sound
is delayed relative to the leading sound. These lead-lag trials usually were interspersed
between trials, where only one of the two speakers emits a sound. Listeners were asked to
indicate where they perceive a sound. The performance of the listeners in the trials with a
single sound source serves as baseline performance. This ‘lead-lag paradigm’ allows for
the investigation of the mechanisms used by listeners to resolve spatial information for
sounds in reverberant environments.
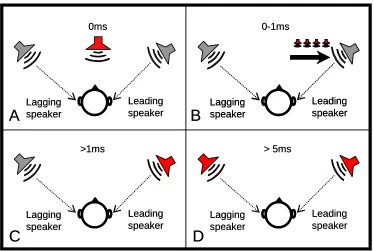
When two sounds were presented simultaneously (lead-lag delay = 0 ms), they are
perceptually fused and this fused percept is located midway between the two speakers (see
Figure 2A). Two sounds delayed by less than 1 ms are spatially fused and are heard as a
single sound located between the leading and lagging sound source position (‘summing
localization’ (Blauert, 1997), see Figure 2B). For lead-lag delays between about one and
five ms, the sound and its echo remain perceptually fused, but the perceived position of
this fused sound image is dominated by the position of the lead (Figure 2C). This percept
is referred to as ‘localization dominance’.
When lead and lag are temporally segregated by >5 ms, the ‘echo threshold’ is reached
and the two sounds are perceived as independent entities with their own spatial location
Figure 2: Perceived position of a sound source in a lead-lag paradigm.
Two speakers are placed in the same distance and angle in front of the listener. The presentation of the
sound has an additional delay between the leading and the lagging speaker. In red: perceived position of the
sound source. A and B: For lead-lag delays of 0-1 ms, the two sounds from the speakers are perceptually
fused and perceived as a single sound source between the leading and lagging speaker (‘summing
localization’). C: For lead-lag delays > 1 ms, the position of the perceived fused sound source is dominated
by the position of the leading speaker (‘localization dominance’). D: Reaching the echo threshold (lead-lag
delays > 5 ms, stimulus-dependent), the two sounds are perceived as independent entities with their own
spatial location.
Echo-threshold values can vary tremendously. Echo threshold depends on both signal
duration and complexity. They are much shorter for brief stimuli such as clicks than for
longer duration stimuli like noise and ongoing complex stimuli such as running speech (up
to 50 ms and more). For example, echo threshold for clicks is reached at lead-lag delays
around 2 ms. For speech, echo threshold is around 20-50 ms. The echo thresholds for
sinusoids of 0.25, 0.5 and 2 kHz vary, dependent on filtering and duration, between 5 and
100 ms (for review see Blauert (1997)).
Behaviourally, the precedence effect has not only been investigated in humans, but also in
several other species.
Tollin and Yin (2003) investigated the precedence effect in cats (Felis catus domesticus).
They used the search coil technique to measure the eye positions of cats which were
trained to saccade to the apparent locations of sounds. Brief broadband stimuli were
presented from two locations, with a delay between their onsets; the delayed sound meant
to simulate a single reflection. The cats first exhibited summing localization for delays <
±400 µs. They also showed localization dominance for delays from 400 µs to about 10
ms. Finally, the echo threshold was reached for delays >10 ms. These data reveal that cats
experience the precedence effect phenomena similarly to humans.
Cranford (1982) tested cats in a classical lead-lag paradigm with impulses with a
frequency spectrum from 500-16000 Hz. The cats were trained to release foot levers
corresponding to the side of the sound. The animals showed localization dominance for
lead-lag delays of 0.5 to 2 ms.
The albino rat (Rattus norvegicus) has also shown behavioural correlates to the
precedence effect: Kelly (1974) showed that localization dominance occurred when either
click in a pair was delayed or reduced in intensity over a certain range. Hoeffding and
Harrison (1979) varied the time, intensity, or both of a lagging click in a pair of clicks and
also found that localization dominance occurred in rats at certain interstimulus delays.
Ashmead et al (1986) investigated the development of auditory localization in a litter of
dogs. The pups’ orienting responses to dog vocalizations presented from loudspeakers 90
degrees to each side were recorded. Sounds were presented in the classical lead-lag
configuration as either a single source or a lead-lag presentation. Localization began
around 16 days after birth, for single-source sounds. Single-source sounds were localized
earlier during development than precedence-effect sounds. Nevertheless, the dogs showed
precedence effect.
Babushkina and Poliakov (2001) tested the localization of a sum of acoustic signals by
two northern fur seals (Callorhinus ursinus) in air depending on sound parameters. This
was investigated by using the method of instrumental conditioned reflexes with food
reinforcement. It was found that fur seals showed the precedence effect in a similar time
range as humans: localization dominance was found for clicks at a delay from around
methods to measure the discrimination performance of budgerigars (Melopsitta undulatus)
of a stimulus presented between + and - 90 degrees azimuth with a delay (left-right), from
the same two stimuli presented with the opposite delay (right-left). At short delays, where
humans experience summing localization, budgerigars have difficulty discriminating
between the two presentation types. With increasing delays, budgerigars showed
improved discrimination performance. At even longer delays, where echo thresholds are
found in humans, discrimination performance worsens again. These results show that
budgerigars exhibit the phases of the precedence effect similar to humans. Similar results
were found in two additional bird species: canaries (Serinus canaria) and zebra finches
(Taeniopygia guttata), using a discrimination paradigm (Dent and Dooling, 2004).
Spitzer and Takahashi (2006) tested the accuracy and precision with which the barn owl
(Tyto alba) turns its head toward sound sources under conditions that evoke the
precedence effect in humans. Stimuli consisted of 25-ms noise bursts emitted from two
sources, separated horizontally by 40 degrees, and temporally by 3-50 ms. At delays from
3 to 10 ms, head turns were always directed towards the leading source, indicating that the
owls perceived localization dominance. Echo threshold was reached at a delay 20 ms.
These findings demonstrate that also owls exhibit the precedence effect.
Furthermore, the precedence effect was examined in insects: Wyttenbach and Hoy (1993)
demonstrated the precedence effect in the Polynesian field cricket (Teleogryllus
oceanicus). A standard two-pulse paradigm with a directional escape response to
ultrasound was used. The crickets showed summing localization for delays of 0 to 2 ms.
Localization dominance was examined for delays of approximately 4 to 75 ms. At delays
over approximately 75 ms, the echo threshold was reached. Precedence effect was also
found in neotropical katydids (Neoconocephalus spiza), when they were tested via
two-choice phonotaxis trials. The authors found that female katydids avoided male calls
occurring during an interval beginning immediately after the onset of a leading call
(Snedden and Greenfield, 1998).
Summarized, all species tested so far experience the precedence effect in nearly the same
Today, little is known about the actual physiological mechanisms that mediate the
precedence effect. There are some candidate structures in the auditory system which play
a role for echo suppression.
Several studies showed the role of the inferior colliculus (IC) for echo suppression. It was
found that IC neurons are usually sensitive to specific interaural time differences (ITD)
and azimuthal locations as it is a prerequisite for the precedence effect, hence the
measurements were consistently made at a neuron’s “best” azimuth or ITD (for detailed
review see Litovsky (1999)).
But also earlier stages of the auditory system contribute to the precedence effect. The IC
contains abundant inhibitory synapses, primarily from the lateral superior olive (LSO,
(Saintmarie et al., 1989)) and the dorsal nucleus of the lateral lemniscus (DNLL, e.g.
Moore and Moore (1987)). Fitzpatrick et al. (1995) have postulated that the DNLL
projections may play a prominent role for the observations in context of the precedence
effect made in the IC. The DNLL was also described as a key structure for echo
suppression by Burger and Pollak (2001). They were able to show that in the Mexican
free-tailed bats (Tadarida brasilensis mexicana) the response of DNLL neurons can be
suppressed for tens of milliseconds due to GABAergic inhibition. This time range fits well
with the times found for the precedence effect. Similar results are reported from the
Mongolian Gerbil (Meriones unguiculatus) in a work by Pecka et al. (2006).
Furthermore, Hartung and Trahiotis (2001) emphasize the role of the auditory periphery
for the precedence effect. The cochlear filters in the auditory periphery are
frequency-specific band pass filters. When a sound arrives at these filters, the filters ring for a
specific time depending on their specific frequency. The lower the specific frequency of
the cochlear filter is the longer is its ringing time. This ringing time is the integration time
of the filter. When two sounds excite the filter with a short delay, it leads to two
overlapping filter responses which again lead to constructive or destructive interferences
of the whole filter response. There’s no discrete resolution of the sounds when they arrive
at the auditory filters within their integration times. Thus, when an echo arrives at an
auditory filter after the direct sound within its integration time, it won’t be solved as a
single sound event. Therefore, the authors argue that a large amount of psychophysical
findings can be explained by the integration times of the auditory filters. The measured
single neuron results cannot account for all perceptual phenomena related to the
precedence effect.
It is conceivable that behavioural manifestation of the precedence effect is mediated at
higher levels in the auditory pathway and is therefore sophisticated. This would be
consistent with studies which suggest that the auditory cortex is essential for behavioural
precedence effect (e. g. (Mickey and Middlebrooks, 2005; Damaschke et al., 2005)
Note: the precedence effect is not exclusively a hard-wired phenomenon. It can also be
seen as an active perceptual process that depends in part on the listeners’ expectations.
Thus, the perception of echoes appears to be modulated by listeners’ expectations about
room acoustic information contained in reflected sound (Clifton et al., 2002).
Furthermore, echo suppression can break down when the lead-lag arrangement is switched
(‘Clifton effect’ (Clifton, 1987)). It was also shown, that listeners can learn to use the
directional cues available in the lagging sound (Saberi and Perrott, 1990). These are strong
indicators for a facultative, situation-dependent processing of echoes, presumably
executed in higher brain centres.
Although a possible neuronal substrate for echo suppression in bats is found (Burger and
Pollak, 2001), yet there is still an investigation of a behavioural manifestation of the
precedence effect in bats to be done.
At first sight, the precedence effect is counterproductive to the bats’ ability to localize
objects via echolocation. It is just the spatial information in echoes which enables the
localization of objects in the dark. Bats rely heavily on the evaluation of these echoes for
orientation and hunting. Each echo includes information about the properties of the
environment, but there are also higher-order echoes: An ensonified object reflects an
echolocation call not only directly back to the bat’s ears, but also in other directions.
There, the echo can be reflected once more by other objects and impinge on the bats´ ear
indirectly. This results in a higher-order echo which includes misleading spatial
information on the object. But it contains information about the environmental properties.
The perceptual suppression of the misleading information could be essential for the bats´
echo-acoustic orientation and localization abilities, but can also cause a loss of essential
Bats produce sounds not only for orientation and prey capture but also for acoustic
communication. Thus, in their natural environment, they are not only confronted with
higher-order echoes of their echolocation calls. Since bats live in complete darkness, they
have developed complex communication calls which enable them to exchange information
in the context of their various social interactions. As they live in large colonies, mostly
residing in reverberant caves, bats not only have to cope with echoes of their own vocal
emissions but also with echoes of communication calls from conspecifics. In this acoustic
situation, the suppression of echoes with misleading spatial information of a sender would
facilitate the perception of the origin of communication signals from other bats and would
ease social interaction. So, while the suppression of spatial information of higher-order
echoes of their own echolocation calls may cause a loss of information about the
environment, a suppression of misleading spatial information in echoes of social calls
might be quite beneficial for a bat. Thus, one can expect a stimulus-dependency in the echo
suppression behaviour in bats.
The first part of the current thesis is designed to investigate whether and to what extend
the echolocating bats Megaderma lyra and Phyllostomus discolor exhibit echo
suppression behaviour consistent with the precedence effect when processing echoes of
their echolocation calls. Furthermore, the echo suppression behaviour of M. lyra to an
external sound which carries semantic meaning for the bat, in this case, a contact call, is
investigated in contrast to abstract sounds like an acoustic impulse, a time-inverted contact
Figure 3: Megaderma lyra
1.2 Experimental procedures
1.2.1
Animals
1.2.1.1 Megaderma lyra
Megaderma lyra (Geoffroy, 1810), the false vampire bat, is
an old world, tropical gleaning bat. It detects its prey both
via echolocation (Schmidt et al., 2000) and based on passive
listening to prey-generated rustling noises (Neuweiler,
2000). A total of seven adult M. lyra took part in the
training: four males (Gepetto, Murcielago, Pinocchio and
Vladimyr) and three females (Aspodia, Avicula and Tikiri).
The animals were kept together in two 12 m² rooms with
free access to water. In these rooms, they were only fed on
days without training sessions, i.e., only for two days after
5-day periods of training. For a balanced nutrition, they were
fed with mice during the training breaks. During the training
period they were only fed with mealworms for reward. The
weight of the animals lay between 32 and 38 g. All animals were experienced in
performing psycho-acoustic experiments in former studies (e.g. (Weissenbacher and
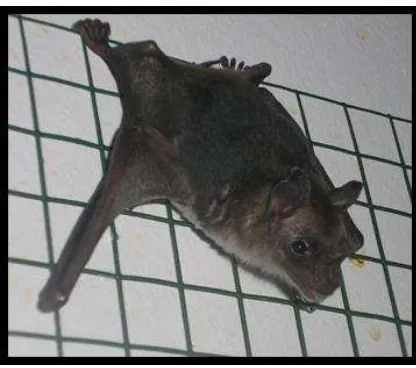
Figure 4: The lesser spear-nosed bat (Phyllostomus discolor)
1.2.1.2 Phyllostomus discolor
Phyllostomus discolor (Wagner, 1843), the lesser spear-nosed bat, is a new world, tropical
bat. The animals originated from a breeding
colony in the Department Biologie II of the
Ludwig-Maximilian-University in Munich. It
feeds mainly on fruits, pollen and insects
(Novak, 1994); the insects mainly being
gleaned from the vegetation.
Two adult P. discolor (both female) took part
in the training. The animals were housed
together in a box (80cm x 40cm x 50cm) with
free access to water. In this box, they were only fed
on days without training sessions, i.e. only for two
days after a 5-day training period. For a balanced nutrition, the bats were fed with
mealworms during the training breaks. During the training period, they were fed with
banana pulp (containing of mashed banana, honey and infant milk powder) for reward.
The weight of the animals lay between 30 and 36 g. All animals had no experience in
1.2.2
Experimental setup
1.2.2.1 Megaderma lyra
The experiments took place in a weakly illuminated, echo-attenuated chamber (3.5 m x
2.2 m x 2.2 m). As in former studies (Weissenbacher and Wiegrebe, 2003; Wiegrebe and
Schmidt, 1996) the setup consisted of a starting perch on one side of the room and two
ultrasonic speakers, one in the left and one in the right hemi field. A schematic
experimental setup is shown in Figure 5A and B; an image of the experimental chamber is
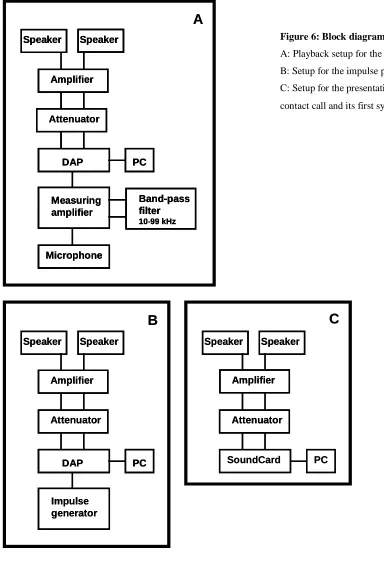
shown in Figure 5C. A block diagram of the setup is depicted in Figure 6.
C
ls ls
fd fd
C
C
ls ls
fd fd
Figure 5: Experimental setup for Megaderma lyra
The figure shows a cartoon with the frontal (A) and side (B) view of the setup and an image of the
experimental chamber (C).
The setup consisted of a starting perch and two ultrasonic speakers (ls), each of those is associated with a
feeding dish (fd) next to the speakers. The angle between the speakers in the M.lyra setup was 90°. This
angle was positioned at 45° elevation (B). A microphone (mic) was placed in front of the bats’ head to pick
Each speaker was associated with a feeding dish. The distance from the loudspeakers to
the bats´ head was 1.2 m. The angle between the speakers and the bats´ head was 45°. To
pick up the bats´ sonar emissions, a ¼ inch microphone (Brüel & Kjaer, 4135, Naerum,
Denmark) was installed 0.12 m in front of the bats’ head. The emissions were amplified
(B&K 2636), band-pass filtered (10-99 kHz, Krohn Hite 3342, Brockton, Massachusetts,
USA) and digitized by a data acquisition board (Microstar DAP 5200, Bellevue,
Washington, USA) at a sampling rate of 250 kHz. On this board, the emissions were
digitally delayed and played back over either one channel (lead-only trials) or over two
channels (lead-lag trials). These signals were attenuated (custom passive attenuation
network), amplified (Rotel RB 976 MK II, Worthing, England) and presented via
ultrasonic speakers (Matsushita EAS 10 TH 800D, Osaka, Japan) at an overall attenuation
of 30 dB re. emission level. The playback delay of the lead was always 4.5 ms including
the acoustic travel times.
The impulses were generated by a pulse generator (Hewlett-Packard 8012B). The contact
call, the inverted contact call and the syllable of the contact call were played back via a
phase 28 soundcard (TerraTec, Nettetal, Germany) which was controlled by MatLab via
the interface software SoundMex. The frequency response of all setup components
including speakers was flat within + five dB between five and 100 kHz.
On the other side of the room, opposite to the perch, the experimentator was seated,
controlling the experimental procedure and the data storage with a touch screen (WES TS,
ELT121C-7SWA-1, Nidderau-Heldenbergen, Germany). The experimental program was
Speaker Speaker Attenuator SoundCard PC Speaker Speaker Amplifier Microphone Measuring amplifier Band-pass filter 10-99 kHz DAP PC Speaker Speaker Attenuator Impulse generator DAP PC
A
B
C
Attenuator Amplifier Amplifier SpeakerSpeaker SpeakerSpeaker
Attenuator Attenuator SoundCard PC Speaker Speaker Amplifier Microphone Measuring amplifier Band-pass filter 10-99 kHz DAP PC Speaker
Speaker SpeakerSpeaker
Amplifier Amplifier Microphone Microphone Measuring amplifier Measuring amplifier Band-pass filter 10-99 kHz Band-pass filter 10-99 kHz DAP PC DAP
DAP PCPC
Speaker
Speaker SpeakerSpeaker
Attenuator Attenuator Impulse generator Impulse generator DAP PC DAP
DAP PCPC
A
B
C
Attenuator Attenuator
Amplifier
Amplifier AmplifierAmplifier
Figure 6: Block diagram of the lead-lag setup
A: Playback setup for the echolocation calls
B: Setup for the impulse presentation
C: Setup for the presentation of the (inverted)
1.2.2.2 Phyllostomus discolor
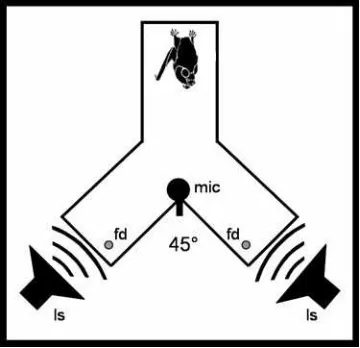
The experiments took place in a horizontal Y-shaped maze in an echo-attenuated chamber.
A starting perch was located at the bottom leg of the Y, and a feeder was mounted at the
end of each upper leg. The angle between the legs was 45°. An ultrasonic speaker
(Matsushita EAS 10 TH 800D) was placed in a distance of 15 cm in front of each upper
leg (see Figure 7). Further, a ¼ inch microphone (B&K 4135) was located in the middle of
the maze to pick up the bats´sonar emissions. The stimulation apparatus was identical to
that used with M. lyra (see Figure 6A).
The experimentator was seated outside the chamber, controlling the experimental
procedure via a computer interface and an infrared camera.
Figure 7: Experimental setup for Phyllostomus discolor
The P. discolor setup was a Y-shaped maze (45x30 cm; wire mesh); the angle between the two legs was
45°. The inner width of each leg was 10 cm. The setup consisted of a starting position and two ultrasonic
speakers (ls), each of those is associated with a feeding dish (fd) next to the speakers. A microphone (mic)
1.2.3
Experimental design
A stimulus and its echo were simulated in a lead-lag paradigm. In this paradigm, two
ultrasonic speakers were placed at the same distance and angle in each hemi field to the
bats’ starting position. The bats were trained in a two-alternative, forced choice
experiment. In an initial training period, only one of the two speakers emitted a stimulus
to train the bats to move to that speaker emitting the stimulus to get a food reward
(‘lead-only trials’). The presenting speaker alternated randomly. When the bats were able to
solve this task with a stable performance of >85 % correct choices over several days, test
trials were randomly interspersed between these lead-only trials with a probability of
25 %, such that two of eight trials were test trials. In these test trials, both speakers
emitted a stimulus but the stimulus from one speaker had an additional delay of 0 ms and
0.1 ms up to 12.8 ms in doublings (‘lead-lag trials’). The lead-lag delays were presented
randomly across lead-lag trials. As in the lead-only trials, the speaker emitting the leading
stimulus in the lead-lag trials varied randomly. In these trials the bats were free to choose
any speaker to receive a food reward; i.e., the spontaneous performance of the bats was
assessed. 30 lead-lag trials were collected for each of the nine lead-lag delays, therefore
each bat completed 270 lead-lag trials interspersed between 810 lead-only trials. The
performance was calculated as decisions for the side of the leading stimulus in percent as
a function of the lead-lag delay.
In the lead-lag trials, the following behaviour would be expected: The bats were trained to
move to the side of the speaker where they perceive a stimulus. If the bats experience
summing localization (one fused auditory event between the two speakers) with a lead-lag
delay of 0 ms, they could not show any side preference, thus the performance level would
be around 50 % (Figure 8A). With increasing lead-lag delay, the bats would be expected
to prefer the side of the leading speaker. If the bats perceive localization dominance,
meaning the leading stimulus dominates the perceptive position of the auditory event, they
would significantly (performance > 75 % for 30 trials (Miller, 1996)) move to the side of
the leading stimulus (Figure 8B). Reaching the echo threshold, the bats would perceive
two separate stimuli in distinct positions and would again choose one of the sides
Figure 8: Expected response behavior of echo-suppressing bats in the lead-lag paradigm
A: With a lead-lag delay around 0 ms, the bats would perceive a fused sound source in the middle between
the two speakers; therefore the bats would respond by chance and a performance around 50% would be
reached.
B: With increasing lead-lag delay, the side of the leading speaker would dominate the localization of the
fused sound source; therefore the bats would significantly choose the side of the leading speaker (>75% for
30 trials per condition).
C: Reaching the echo threshold, the bats would perceive two distinct sound sources and would again choose
1.2.4.1 Active-acoustic paradigm: echo suppression in echolocation
1.2.4.1.1 Echolocation call
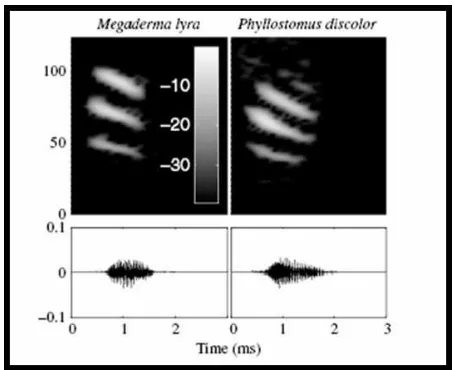
Many echolocation calls are short and broadband signals. Possibly, their emission triggers
special attention in the bat (Metzner, 1993). Thus, it might be possible that the active
emission of echolocation calls activates circuits which enhance the evaluation of returning
echoes. M. lyra emits brief (0.5-1.5 ms), broadband, multi-harmonic echolocation calls.
The fundamental frequency is frequency modulated from about 23 to 19 kHz. The
strongest harmonics are the 3rd, 4th or 5th. P. discolor emits short (<3ms) broadband
downward-modulated multiharmonic echolocation calls in the frequency range between 40
and 90 kHz. Thus, its echolocation calls are also short, multi-harmonic frequency sweeps
but slightly longer than M. lyra calls and with a stronger dominance of lower harmonics.
Exemplary echolocation calls of M. lyra and P. discolor are shown in Figure 9.
Figure 9: Echolocation calls
Sample of a characteristic Megaderma lyra echolocation call (left column) and a Phyllostomus discolor
echolocation call (right column). The upper row shows the spectrograms (the colorbar shows the magnitude
in dB); the lower row shows the oscillograms. M. lyra emits brief (0.5-1.5 ms), broadband, multi-harmonic
echolocation calls. The fundamental frequency is frequency modulated from about 23 to 19 kHz. The
strongest harmonics are the 3rd, 4th or 5th. P. discolor also emits brief (<3ms), broadband, multi-harmonic
echolocation calls covering the frequency range between 40 and 90 kHz. The fundamental frequency is
1.2.4.2 Passive-acoustic paradigm: echo suppression with external sounds
1.2.4.2.1 Impulses
Impulses are often used in echo suppression studies. The current impulse had a duration of
7µs which results in a white spectrum in the frequency range from 5 kHz up to 100 kHz.
Thus, the impulses were also short and broadband like an echolocation call, but the
presentation was independent from the bats´ echolocation activity. The peak- equivalent
SPL of the impulses was 94 dB.
1.2.4.2.2 Contact call
The stimulus was a recording of an adult male M. lyra contact call (Figure 10).
Corresponding to the nomenclature used for bird songs (Leonardo and Konishi, 1999), a
call is composed of motifs and the motifs are comprised of syllables. The current contact
call consisted of three motifs. The first syllable of each motif is a frequency-modulated,
multiharmonic complex. It had a duration of 15-20 ms; the strongest harmonic was f0 with
a frequency of 15 kHz. The first syllable is followed by a series of multiharmonic
syllables, which are similar to echolocation calls. The presentation of the contact call was
Figure 10: M. lyra contact call
A and C: Oscillogram; B and D: spectrogram. A and B show the whole contact call (duration: 4.26 s) as it
was presented to the bats in a loop until they made their decision. The call consists of three motifs, each is
composed of several syllables.
C and D show the first motif of the call for a more detailed impression of the fine-structure. This motif
contained a frequency-modulated, multiharmonic complex (=first syllable; duration: 15-20 ms; f0= 15 kHz
the strongest harmonic). This complex was followed by a series of multiharmonic syllables, similar to
echolocation calls (Figure 9).
Spectrogram, FFT size 512, Hanning window.
4.26 s 0.50 s /div
50 kHz 100 kHz -10 dB -30 dB -50 dB -70 dB -90 dB
Spectrogram, FFT size 512, Hanning window.
4.26 s 0.50 s /div
50 kHz 100 kHz -10 dB -30 dB -50 dB -70 dB -90 dB Am plitude
Spectrogram, FFT size 512, Hanning window.
0.5 s 0.1 s /div
50 kHz 100 kHz
-10 dB -30 dB -50 dB -70 d B -90 dB
Am plitude
Spectrogram, FFT size 512, Hanning window.
0.5 s 0.1 s /div
50 kHz 100 kHz
-10 dB -30 dB -50 dB -70 d B -90 dB 4.26s 0.50s/div 0.5s 0.1s/div
A
B
D
C
Spectrogram, FFT size 512, Hanning window.
4.26 s 0.50 s /div
50 kHz 100 kHz -10 dB -30 dB -50 dB -70 dB -90 dB
Spectrogram, FFT size 512, Hanning window.
4.26 s 0.50 s /div
50 kHz 100 kHz -10 dB -30 dB -50 dB -70 dB -90 dB Am plitude
Spectrogram, FFT size 512, Hanning window.
0.5 s 0.1 s /div
50 kHz 100 kHz
-10 dB -30 dB -50 dB -70 d B -90 dB
Am plitude
Spectrogram, FFT size 512, Hanning window.
0.5 s 0.1 s /div
50 kHz 100 kHz
-10 dB -30 dB -50 dB -70 d B -90 dB
4.26s 0.50s/div
0.5s 0.1s/div
Spectrogram, FFT size 512, Hanning window.
4.26 s 0.50 s /div
50 kHz 100 kHz -10 dB -30 dB -50 dB -70 dB -90 dB
Spectrogram, FFT size 512, Hanning window.
4.26 s 0.50 s /div
50 kHz 100 kHz -10 dB -30 dB -50 dB -70 dB -90 dB Am plitude
Spectrogram, FFT size 512, Hanning window.
0.5 s 0.1 s /div
50 kHz 100 kHz
-10 dB -30 dB -50 dB -70 d B -90 dB
Am plitude
Spectrogram, FFT size 512, Hanning window.
0.5 s 0.1 s /div
50 kHz 100 kHz
1.2.4.2.3 Inverted contact call
The stimulus is an temporally inverted contact call (Figure 11). Therefore, it contains the
same spectral content as the M. lyra contact call (see 1.2.4.2.2), but its temporal features
are inverted. Due to this inversion the semantic meaning most likely was lost. This can be
Figure 11: Inverted Megaderma lyra contact call
A and C: Oscillogram; B and D: Spectrogram. The call contained the same spectral characteristics as the
contact call but is temporally inverted. A and B show the whole inverted contact call sequence as it was
presented to the bats in a loop until they made their decision. C and D show the inverted first motif of the call
for a more detailed impression how the call is constructed.
Am plitude
Spectrogram , FFT size 512, Hanning window.
0.5 s 0.1 s /div
50 kHz 100 kHz
-10 dB -30 dB -50 dB -70 dB -90 dB
Am plitude
Spectrogram , FFT size 512, Hanning window.
0.5 s 0.1 s /div
50 kHz 100 kHz
-10 dB -30 dB -50 dB -70 dB -90 dB
Spectrogram , FFT size 512, Hanning window.
4.26 s 0.50 s /div
50 kHz 100 kHz
-10 dB -30 dB -50 dB -70 dB -90 dB
Spectrogram , FFT size 512, Hanning window.
4.26 s 0.50 s /div
50 kHz 100 kHz
-10 dB -30 dB -50 dB -70 dB -90 dB 4.26s 0.50s/div 0.5s 0.1s/div
A
B
D
C
Am plitudeSpectrogram , FFT size 512, Hanning window.
0.5 s 0.1 s /div
50 kHz 100 kHz
-10 dB -30 dB -50 dB -70 dB -90 dB
Am plitude
Spectrogram , FFT size 512, Hanning window.
0.5 s 0.1 s /div
50 kHz 100 kHz
-10 dB -30 dB -50 dB -70 dB -90 dB
Spectrogram , FFT size 512, Hanning window.
4.26 s 0.50 s /div
50 kHz 100 kHz
-10 dB -30 dB -50 dB -70 dB -90 dB
Spectrogram , FFT size 512, Hanning window.
4.26 s 0.50 s /div
50 kHz 100 kHz
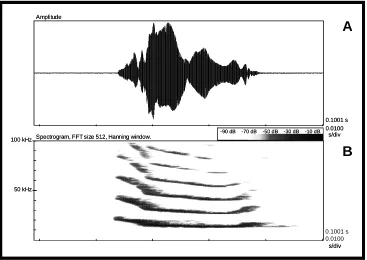
1.2.4.2.4 First syllable of the contact call
Consisting of a longer and low-frequent element, a possible influence of the onset of the
first syllable of the contact call over the social relevance of the call on the echo suppression
behavior should be excluded. Therefore, the first syllable of the contact call was presented.
This first syllable had a duration of around 17 ms, f0 was around 15 kHz and was the
strongest harmonic (Figure 12).
Figure 12: First syllable of the M. lyra contact call
A: Oscillogram; B: spectrogram. The first syllable of the contact call had a duration of 15-20 ms; f0= 15 kHz
is the strongest harmonic:
Amplitude
Spectrogram, FFT size 512, Hanning window.
0.1001 s 0.0100 s/div 50 kHz 100 kHz -10 dB -30 dB -50 dB -70 dB -90 dB Amplitude
Spectrogram, FFT size 512, Hanning window.
0.1001 s 0.0100 s/div 50 kHz 100 kHz -10 dB -30 dB -50 dB -70 dB -90 dB 0.1001 s 0.0100 s/div
A
B
AmplitudeSpectrogram, FFT size 512, Hanning window.
0.1001 s 0.0100 s/div 50 kHz 100 kHz -10 dB -30 dB -50 dB -70 dB -90 dB Amplitude
Spectrogram, FFT size 512, Hanning window.
1.3 Results
1.3.1 Active-acoustic paradigm: echo suppression in echolocation
In a two-alternative forced-choice task, the bats were successfully trained via lead-only
trials to move towards the speaker from which the single reflection of their echolocation
call was presented. After this training period, the performance in these lead-only trials was
always above 85 % correct. The data reported below were obtained while the bats
maintained this good performance for the lead-only trials. The data are based on an overall
of about 12,000 trials obtained from 7 animals. In three animals, a second data acquisition
was done to make sure that the observed results are valid.
Figure 13 shows the spontaneous decisions of the five M. lyra individuals in the
interspersed lead-lag trials as a function of the lead-lag delay. Individual data are plotted
in panels A to E, average data are shown in panel F. Based on 30 trials per condition,
significant performance is reached at about 75 % correct. In general, the bats did not
significantly prefer the leading reflection of their sonar emission over the lagging
reflection. While the first acquisition of Bat 3 (Panel C) indicates a significant preference
for the leading reflection for lead-lag delays between 0.4 and 3.2 ms, a second acquisition
could not confirm this finding. The average data show that there is only a weak trend
towards a preference for the first reflection.
Data for the two P. discolor individuals are shown in Figure 14. Again, both individuals
do not significantly prefer the first reflection over the second.
Taken together, the results show that both bat species generally do not reveal localization
Figure 11: Echo suppression in the echolocating bat M. lyra
The figure shows the percent decisions towards the first of two reflections plotted against the lead-lag delay.
Chance performance is represented by the horizontal line at 50 %; significant performance is represented by
the fine dotted line at 75 %. The bats’ performance in the lead-only trials is shown by the strong horizontal
lines. Panels A to E show individual data; Panel F shows the mean performance of all bats; the error bars
indicate the standard deviation. The two data plots in Panels A, C, and E show a first and second data
acquisition of these bats. Only one of five M. lyra individuals spontaneously showed significant preference
(>75%) for the first of two reflections (C; first acquisition). Bat 1:Avicula; Bat 2: Gepetto; Bat 3:
Figure 12: Echo suppression in the echolocating bat P. discolor
The figure shows the decision towards the first of two reflections plotted against the lead-lag delay. Data are
shown in the same format as in Figure 11. The data plot represent data from the two P. discolor individuals.
1.3.2 Passive-acoustic paradigm: echo suppression with external sounds
In a two-alternative forced-choice (2-AFC) task, stimulus-dependent echo suppression in
passive-listening individuals of M. lyra was examined.
In lead-only trials, the bats were successfully trained to move towards the speaker from
which a single stimulus was presented. The stimuli used to investigate stimulus-dependent
echo suppression in bats were impulses, a M. lyra contact call, an inverted contact call and
the first syllable of the contact call. After the training period, the performance in lead-only
trials was always above 85 % correct. The data reported below were obtained while the
bats maintained this good performance for the lead-only trials. Figure 13-16 show the
spontaneous decisions for the leading stimulus of two to three M. lyra individuals in the
interspersed lead-lag trials as a function of the lead-lag delay. Based on 30 trials per delay
condition, significant performance is reached at about 75 % correct. Due to the
1.3.2.1 Echo suppression with impulses
The echo suppression behaviour of two M. lyra individuals (Gepetto and Tikiri) was tested
when they were confronted with leading and lagging impulses. Figure 13 shows the
spontaneous decisions of the two M. lyra individuals in the interspersed lead-lag trials as a
function of the lead-lag delay. Based on 30 trials per condition, significant performance is
reached at about 75 % correct.
Both individuals did not significantly prefer the leading impulse over the lagging one.
Figure 13: Suppression of impulse echoes in M. lyra
The figure shows the percent decisions towards the first of two impulses plotted against the lead-lag delay of
two M. lyra individuals. Chance performance is represented by the horizontal line at 50 %; significant
performance is represented by the fine dotted line at 75 %. The performance in the lead-only trials of the
two tested bats is shown by the strong horizontal lines. None of the bats showed significant spontaneous
1.3.2.2 Echo suppression with contact calls
The echo suppression behaviour of three M. lyra individuals (Gepetto and Aspodia) was
tested when they were confronted with leading and lagging contact calls. Figure 14 shows
the spontaneous decisions of three M. lyra individuals in the interspersed lead-lag trials as
a function of the lead-lag delay. Individual data is plotted in panel A-C, average data is
plotted in panel D. Based on 30 trials per condition significant performance is reached at
about 75 % correct. All three individuals preferred the leading contact call over the lagging
one when there was lead-lag delay of 0.2 to 0.4 ms (Figure 14, A-C). This trend is also
consistent when the average of the data is calculated (Figure 14 D).
Figure 14: Suppression of contact call echoes in M. lyra
The figure shows the percent decisions towards the first of two contact calls plotted against the lead-lag delay
of three M. lyra individuals. Data are shown in the same format as in Figure 13. The bats’ performance in the
lead-only trials is shown by the strong horizontal lines. In panel A-C the performance of bat 1 to 3 is plotted;
average is plotted in D. All animals showed significant preference for the leading contact call when there was
a lead-lag delay of 0.2 to 0.4 ms. This trend is also consistent in the averaged data. Bat 1: Gepetto;
Two individuals (Gepetto and Aspodia) were confronted with leading and lagging inverted
contact calls. Figure 15 shows the bats’ spontaneous decisions in the interspersed lead-lag
trials as a function of the lead-lag delay. Again, based on 30 trials per condition, significant
performance is reached at about 75 % correct.
As observed in the impulse condition (Figure 13), both individuals did not show significant
preference for the leading inverted contact call.
Figure 15: Suppression of echoes of an inverted contact call in M. lyra
The figure shows the percent decisions towards the first of two inverted contact calls plotted against the
lead-lag delay of two M. lyra individuals. Chance performance is represented by the horizontal line at 50 %;
significant performance is represented by the fine dotted line at 75 %. The performance in the lead-only trials
of the two tested bats is shown by the strong horizontal lines. None of the bats showed significant