Development of model and simulation of heat transfer phenomena during hydrothermal processing using SOLIDWORKS®
Muhammad Musaddique Ali Rafique1,2, Umair Shah3
1Department of Metallurgical and Materials Engineering, University of Engineering and
Technology, Lahore, 54000, Pakistan
2Eastern Engineering Solutions LLC, Detroit MI 48202
3University of Punjab, Lahore, Pakistan
Abstract
Hydrothermal /super critical processes are important process to synthesize materials which are otherwise difficult to form under normal conditions. A mathematical model is developed using standard transport equations to calculate the time for heating of hydrothermal reactor and computer simulation of the model was carried out in SOLIDWORKS® to validate it. The materials used to form reactor vessel were stainless steel (outer body) and TEFLON (PFA) (inner vessel). It was shown that composite wall, its geometry, construction & properties greatly affect the time and pattern of heat transfer. The time calculated and pattern generated were found to be in good agreement with experimental values.
Key Words: Hydrothermal, simulation, TEFLON
1. Introduction
Hydrothermal treatment [1] is a thermochemical process [2], widely used in various manufacturing processes [3-5]. These treatments are performed above 100oC in an aqueous solution [6]. It is an old technique that has been employed in treatment of sewage water, power industry, synthesis of chemicals [1, 7, 8], nanotechnology, and petroleum industry. Super critical hydrothermal processes involve high temperature (Tc) and pressure (Pc), usually above the critical temperature of the water (Tc = 647 K & Pc = 221 bar). Precise calculation of the heat generation and transfer can give more control over the hydrothermal process. Any hydrothermal process involves two steps i.e. heat generation and heat transfer. Heat generation may be attained via electrical power [9, 10]. Heat transfer depends upon the process being carried out, type of insulation and configuration of the hydrothermal reactor. For a successful modelling, it is important to incorporate all temperature & pressure dependent material properties. External heating elements are placed for more precise control of temperature during the hydrothermal treatment. The heat generation (Q) in joules is in accordance with the Joule heating law (Q = I2Rt), where I is the current in amperes, R is the resistance of the heating elements and t is the duration in seconds. Heating elements may be constructed through high electrical resistance materials (stainless steels, tungsten alloys & nickel chromium alloys).
2. Mathematical formulation
To formulate a generalized mathematical model corresponding to heat transfer phenomena during hydrothermal processing in sealed vessels, following assumptions were made:
1) Main source of heating is electrical resistance heating in a Box type furnace. Electric heater are at constant temperature.
2) Thermal properties of mold are not constant & do change with change of temperature. 3) Thermal conductivity of mold (steel) is very high and that of TEFLON is very low. 4) Rate of heat transfer by convection and radiation is negligible.
5) The furnace is very well insulated.
Based upon these assumptions, following is considered
a. The steel and TEFLON (composite) vessel is considered identical to sealed pressurized reactor / vessel in which quantity of heat to and from system is zero (Adiabatic process).
3. Heat transfer for hydrothermal reactor
In order to formulate a mathematical model for heat transfer problem during heating, consider a stainless-steel engulfed TEFLON vessel placed inside an electric furnace (resistance heating).
There are three steps in which heat is transferred
i. First step in which electrical power is used to heat the resistance element of furnace to desired temperature.
ii. Second step in which heat energy generated in step one is used to heat the vessel (steel). iii. Third step in which heated steel vessel heats the TEFLON vessel.
Time of heating is determined separately during each interval using different relations and then individual times are summed up together to get total time taken for heating.
3.1First step of heating – heat generation
When furnace is switched ON, electricity starts flowing from power (electrical) generation source into the elements. Material(s) of elements offer resistance to the flow of electricity. Consider a Voltage V flowing through resistor of resistance R in time t, then energy (heat) generated may be written as
Qt = V x I x time (1)
Qt = V2/R x time (2)
where
Qt = quantity of power consumed (Watt – hour) & heat energy produced (KJ) V = Voltage (volts) (standard, different for different localities)
resistivity of material – changes with change of temperature) [9] t = time of heating (hr)
All the heat generated in this step goes into overcoming material heat losses expressed in term of specific heat capacity of substance when it is heated across a temperature difference. This may be written as.
Qt = m Cp ∆T
Qt = mCp (T2 – T1) (3)
where
m = mass of heating element (kg)
Cp = specific heat capacity of material (function of temperature) (KJ/Kg K) T2 = final temperature (K)
T1 = initial temperate (K)
m Cp(T2 – T1) = V2/R x time
(4) time = (m Cp(T2 – T1) x R) / V2
(5)
This is the time in which elements reaches set operating temperature (T2) from initial temperature (T1). Putting back the calculated time in (2) yields energy (heat) generated (hence available for transfer to raise the temperature of vessel).
Various factors affect time of heating during first step such as thermal conductivity of mold material [12, 15, 16], heating conditions, maximum power rating of furnace [9], safe operating limit, specific heat of metal, etc. All these should be taken into account while designing a heating system [10]. Soon after the element is heated to designated temperature, second step of heating (heat transfer) begins.
3.2Second step of heating – heat transfer
When resistance heating element is heated to its set operating temperature, the heat it produces (using electrical power) goes into raising the temperature of hydrothermal vessel [10, 12, 17]. Time to heat the vessel (bringing inside wall temperature to reaction temperature) is determined in that step using standard energy (heat) generation by electricity & heat transfer (conduction) equation(s) and is represented as time of reaction.
Energy (heat) generated once again may be written as Qt = V2/R x time
Heat transfer from high temperature T2 to lower temperature T1 may be represented by following equation
QT = (T2 – T1)/Rt
Where T2 and T1 are outside and inside temperatures (K) of stainless steel vessel at infinitesimal value of time t and Rt is the thermal resistance of materials (K/W) at the same time.
4. Determination of thermal resistance
This thermal resistance can further be expressed in the form
Rt = L/kA
Where
L = thickness of mold material(s) (m)
A = Surface area exposed/available for heat transfer (m2)
k = Thermal conductivity of material (W/m-K) (strong function of temperature)
For stainless steel (304) k may be expressed by general relation
k = 9.705 + 0.0176T - 1.60x10⁻⁶T2
where
T = temperature of operation (K) at infinitesimal time t
5. Results and discussion
Results and discussions are presented in the form of readings taken both by simulation and by thermocouple. Effect of various output values are presented in the form of temperature as input function. Results are presented in animation form yielded by simulation software package to explain and co-relate the phenomena occurring during heat transfer. These observations primarily show time dependent behavior of heat transfer phenomena and pattern at various locations of vessel (inside, outside and across the wall). The readings were taken at small time intervals to take advantage of better and efficient heat transfer pattern across wall of vessel. The simulations results are performed at fine mesh and take into account various modes of heat transfer from open, exposed and enclosed vessel surfaces. All simulations, graphical and experimental results complement each other and exhibit similar patterns of heat transfer with the passage of time till a condition is reached where all inner surface of vessel gets heated to desired operating temperature (250oC) uniformly. The simulation performed also take into account small variation in geometry (contours, curvy surfaces, fillet radius, champers). The model also shows the effect of time on different properties of vessel material and describes heat transfer variation across mold wall with change of time and temperature. It also takes into account the dynamic change in heat transfer coefficients with time along with change in quantities of heat(s) released as affected by change of input and vessel material temperature.
5.1 Effect of metal temperature
heat transfer when overall mass is cold as a whole which eventually will incur more effort on heating elements to supply more heat to compensate for that which in turn finally can be in direct conflict with over heat transfer calculations carried out. Care must be taken to tune the heating from heating elements in such a way that they supply maximum heat at the start of heating cycle and avoid cold spot and once base and maximum mass of material at base, reaches high enough temperature, the heating from elements may reduce in conjunction with heating due to incipient heated mass itself to account for, and cater the, remaining heat, and heat transfer requirements. This is the best way to optimize the process. An industrial example of this phenomena is microcontroller based back loop heating programs such as one supplied by Inductotherm UK®. In metallurgical hearth type furnaces this effect is taken care of by introduction of heated metal parts from within furnace (which have been heated to high temperature already) at the top mouth from time to time. This ensures that top does not suffer from cold spot. In Foundry practice, the same phenomena could be avoided by introduction of purpose made heating pads (a self-burning refractory material) which gets fire when come in contact with liquid metal and remains at high temperature for a long enough time thus reduces the chances of getting cold spots specially in isolated regions of mold.
(a)
(b)
Fig – 3: (a) Mesh size of cylinder used in current simulation study (Total elements = 26346, Total Nodes = 49250) (b) Steady state heat transfer pattern at outside wall temperature T1=
250oC, time (t) = 0 and Node = 1 (c) same heat transfer pattern observed from top (isometric view) (d) Top (non-isometric view)
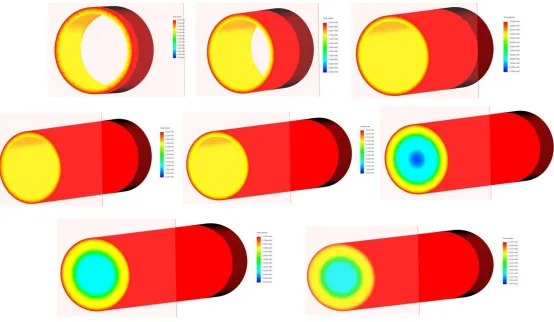
Figure 4 (a – h): shows heat transfer profiles across different sections of cylindrical vessel
at time t = 0
Figure 5 (a – c): shows actual heat transfer profiles across different sections of cylindrical vessel (a) 200
Clearly, it can be seen that heat transfer occurs not only along straight line drawn perpendicular to tangent to outside surface but it occurs at various angles along tangent which results in a 3D steady state heat transfer pattern which gives very useful information about properties of material (stainless steel) as a function of temperature. It clearly shows that inward heat transfer is maximum along horizontal center line (or central cross section region) even when heating elements are applied longitudinally and imparting heat uniformly all along length of cylinder. This is because, the effect of heat transfer occurs not only by conduction but also by convection and radiation to open atmosphere at places near the surface and bottom of cylinder due to their close proximity to ambient. Although, their effects are negligible and can be ignored but in actual practice and in simulations performed at very fine mesh size, their effect becomes prominent and contributes towards overall heat transfer thus resulting in variant heat transfer pattern from point to point. This effect also results in deviation from steady state nature of heat transfer to non – steady state heat transfer. This effect can be avoided by the use of wool or insulating pads at top end and below bottom of cylinder which results in blockage of heat transfer and contributes towards decrease in temperature drop at such appreciable value.
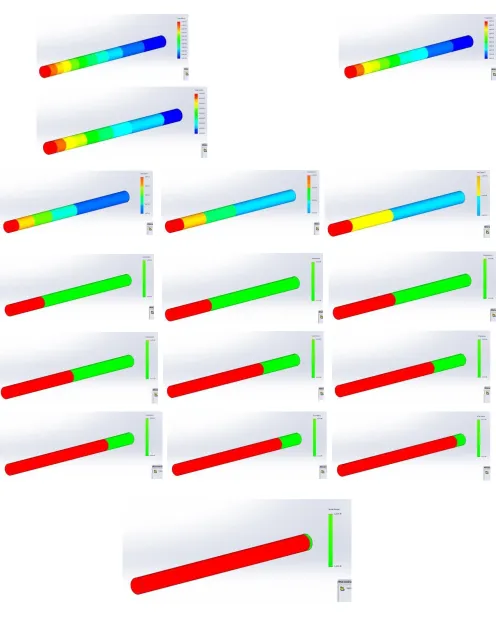
5.2 Effect of time
As the time changes from time t = 0 to 1, 2, 3, …., all the thermodynamics properties and parameters in the casting change as well. Especially the phenomenon predicted is a strong function of changes in heat transfer coefficients (HTC). All three HTC from convection, conduction and radiation change consequently. Though minutes, the changes in HTC strongly affect the overall temperature and temperature distribution (profile) across various sections of casting including temperature variation across wall of the vessel as shown in Fig - 8 (a – p). These figures show temperature profile of an element chosen randomly at a certain point from cross section of wall of cylinder which is subjected to change in HTCs. This change in HTCs; result in variation in temperature from outside maximum (250oC) to inside maximum (250oC). That is with the change of time, as HTC change, the temperature across thickness of
with varying values of HTC
6. Defects
Three types of defects are identified during simulation which may give rise to poor results
1. Radial heating (along horizontal half plane) 2. Improper surface selection
3. Convection from outside of base (improper base insulation / protection) (cold spot outside as well as inside)
4. No radiation from inside base (it results into accumulation of heat at the base – deteriorates properties)
5. Radiation + convection from outside base (too much heat transfer resulting into dead zones)
6. Base heating only
(1) Radial heating only
(3) Convection from outside of base
(6)Base hating only
Results obtained by simulations are presented as animations to check the validity of model and accuracy
and consistency of results. These observations primarily show time dependent behavior of heat transfer
phenomena and determine the conditions of casting at different intervals of time. The readings were taken at small intervals of time to get better representation of thermal heat transfer pattern across mold surface.
Both simulation and experimental results (visual observations) complement each other and exhibit similar patterns of heat transfer with the passage of time till a condition is reached at which metal losses all its heat and completely solidifies. The model also shows the effect of time on different properties of mold
material as well as gives heat transfer pattern across mold wall with change of time and temperature. It
7. Conclusions
Following conclusions may be drawn from this study
1- Heat the external vessel to at least X times the desired quickness in achieving the resultant/required temperature e.g. if 100oC is required inside & time taken is 2.5 weeks (outside 100oC). Time is inversely proportional to outside temperature. This relationship is as follows
Inside Outside Time
100 100 2.5 weeks
100 200 1.2 weeks
2- Decrease the thickness of insulating (TEFLON) part (keeping in view strength/stability at designed inside pressure (86 bar in present case)
3- Make a TEFLON – Steel composite having good k
4- Wait for long enough time to get 100oC at the inside while outside is 100oC
5- Design the cooling system in walls (air based/water based/salt based/mechanical steel plates) to keep them cool.
6- Assume heating by electric resistance elements in furnace with air properties being good conductor of heat and stagnant (i-e there is no in and out of fresh air to the system) (perfect insulating walls). Moreover, the temperature of heating elements/chamber remains at 100oC by automatic switching ON and OFF of furnace.
7- Temperature of inside wall (at different points rises differently depending on the its geometry, location, distance from heating source & properties of air &/or heat transfer medium. (this is very small rise in temperature)
8- Rate of heat transfer decreases with time (but never approaches zero practically)
9- Rt increases
10- K decreases as time passes and temperature increases
11- Cp also changes
12- Time to complete the process increases becomes very high (but never approaches infinity) (theoretically as well as practically with very high significant figures)
1. References
1. Byrappa, K. and T. Adschiri, Hydrothermal technology for nanotechnology. Progress in Crystal Growth and Characterization of Materials, 2007. 53(2): p. 117-166.
2. Sadat-Shojai, M., Preparation of hydroxyapatite nanoparticles: Comparison between hydrothermal and
Solvo-Treatment processes and colloidal stability of produced nanoparticles in a dilute experimental
dental adhesive. Journal of the Iranian Chemical Society, 2009. 6(2): p. 386-392.
3. Yoshimura, M. and K. Byrappa, Hydrothermal processing of materials: past, present and future. Journal of Materials Science, 2008. 43(7): p. 2085-2103.
4. Zhang, X. and K.S. Vecchio, Hydrothermal synthesis of hydroxyapatite rods. Journal of Crystal Growth, 2007. 308(1): p. 133-140.
5. Nian, J.-N. and H. Teng, Hydrothermal Synthesis of Single-Crystalline Anatase TiO2 Nanorods with
Nanotubes as the Precursor. The Journal of Physical Chemistry B, 2006. 110(9): p. 4193-4198.
6. Rafique, M.M.A., Hydrothermal Processing of Phase Pure and Doped Hydroxyapatite and its
Characterization. Journal of Encapsulation and Adsorption Sciences, 2018. Vol.08No.01: p. 19.
7. Ashok, M., et al., Growth and characterization of hydroxyapatite crystals by hydrothermal method.
Journal of Materials Science: Materials in Medicine, 2007. 18(5): p. 895-898.
8. Earl, J.S., D.J. Wood, and S.J. Milne, Hydrothermal synthesis of hydroxyapatite. Journal of Physics: Conference Series, 2006. 26: p. 268-271.
9. Edward, H., Hughes Electrical and Electronic Technology. 2010: Pearson Education. 10. Theraja, B.L., Textbook of Electrical Technology. 1977: S. Chand.
11. Bergman, T.L., et al., Fundamentals of Heat and Mass Transfer. 2011: Wiley.
12. HOLMAN, J.P., Heat Transfer. 1968.
13. Rafique, M.M.A., Modeling and Simulation of Heat Transfer Phenomena. Heat Transfer: Studies and
14. Rafique, M.M.A. and J. Iqbal, Modeling and simulation of heat transfer phenomena during investment
casting. International Journal of Heat and Mass Transfer, 2009. 52(7): p. 2132-2139.
15. Çengel, Y.A. and M.A. Boles, Thermodynamics: An Engineering Approach. 2006: McGraw-Hill Higher
Education.