International Journal of General Medicine
Dove
press
O r I G I n a l r e s e a r c h
open access to scientific and medical research
Open access Full Text article
Effect of fluid loading with normal saline and 6%
hydroxyethyl starch on stroke volume variability
and left ventricular volume
Hirotsugu Kanda1
Yuji Hirasaki2
Takafumi Iida1
Megumi Kanao1
Yuki Toyama1
Takayuki Kunisawa1
Hiroshi Iwasaki1
1Department of Anesthesiology and
Critical Care Medicine, Asahikawa Medical University, Asahikawa,
2Department of Anatomy, The Jikei
University Graduate School of Medicine, Tokyo, Japan
Correspondence: Hirotsugu Kanda Department of Anesthesiology and Critical Care Medicine, Asahikawa Medical University, Midorigaoka-higashi 2-1-1-1, Asahikawa 078-8510, Hokkaido, Japan
Tel +81 166 68 2583 Fax +81 166 68 2589 email [email protected]
Purpose: The aim of this clinical trial was to investigate changes in stroke volume variability (SVV) and left ventricular end-diastolic volume (LVEDV) after a fluid bolus of crystalloid or colloid using real-time three-dimensional transesophageal echocardiography (3D-TEE) and the Vigileo-FloTrac™ system.
Materials and methods: After obtaining Institutional Review Board approval, and informed consent from the research participants, 22 patients undergoing scheduled peripheral vascular bypass surgery were enrolled in the study. The patients were randomly assigned to receive 500 mL of hydroxyethyl starch (HES; HES group, n=11) or normal saline (Saline group, n=11) for fluid replacement therapy. SVV was measured using the Vigileo-FloTrac system. LVEDV, stroke volume, and cardiac output were measured by 3D-TEE. The measurements were performed over 30 minutes before and after the fluid bolus in both groups.
Results: SVV significantly decreased after fluid bolus in both groups (HES group, 14.7%±2.6% to 6.9%±2.7%, P,0.001; Saline group, 14.3%±3.9% to 8.8%±3.1%, P,0.001). LVEDV significantly increased after fluid loading in the HES group (87.1±24.0 mL to 99.9±27.2 mL, P,0.001), whereas no significant change was detected in the Saline group (88.8±17.3 mL to 91.4±17.6 mL, P.0.05). Stroke volume significantly increased after infusion in the HES group (50.6±12.5 mL to 61.6±19.1 mL, P,0.01) but not in the Saline group (51.6±13.4 mL to 54.1±12.8 mL, P.0.05). Cardiac output measured by 3D-TEE significantly increased in the HES group (3.5±1.1 L/min to 3.9±1.3 L/min, P,0.05), whereas no significant change was seen in the Saline group (3.4±1.1 L/min to 3.3±1.0 L/min, P.0.05).
Conclusion: Administration of colloid and crystalloid induced similar responses in SVV. A higher plasma-expanding effect of HES compared to normal saline was demonstrated by the significant increase in LVEDV.
Keywords: colloid–crystalloid controversy, fluid responsiveness, three-dimensional transesopha-geal echocardiography (3D-TEE)
Introduction
Intravenous fluid resuscitation is an essential practice in perioperative and critical care medicine to restore depleted intravascular volume and optimize oxygen delivery to vital organs.1 Intravenous fluid therapy should be initiated based on careful
assessment of the fluid responsiveness. Fluid responsiveness is defined as a state in which fluid therapy results in an increased cardiac output.2 The appropriate type and
amount of solution should be given to optimize vital organ perfusion and avoid fluid overload.3 In the operating room, this treatment approach, for example, goal-directed
fluid therapy, is conducted under close monitoring by anesthesiologists, who make
International Journal of General Medicine downloaded from https://www.dovepress.com/ by 118.70.13.36 on 22-Aug-2020
For personal use only.
Number of times this article has been viewed
This article was published in the following Dove Press journal: International Journal of General Medicine
Dovepress
Kanda et al
therapeutic decisions based on integration of the information derived from multiple hemodynamic parameters.4–6
The colloid–crystalloid controversy refers to the debate on the relative merits and detriments of resuscitation from hypovolemia. Colloid is frequently used for fluid resuscita-tion perioperatively. It is generally accepted that colloid has a higher plasma-expanding property than crystalloid as it remains in the intravascular compartment.7 Lobo et al
reported that 68%, 21%, and 16% of the infused volumes of normal saline, 30 kDa colloid, and 130 kDa colloid, respec-tively, escape from the intravascular to the extravascular space at the end of a 1-hour infusion.8 Despite the theoretical
advantages, concerns have been raised regarding the use of synthetic colloid for fluid resuscitation. Colloid use is associated with higher morbidity and mortality, especially in patients with sepsis, although the underlying mechanism is not yet known.9–12 In such cases, crystalloid may be the
only option for fluid resuscitation. Thus, it is important to determine the comparability of crystalloid with colloid in terms of the plasma-expanding effect. Previous studies compared the plasma-expanding potency between crystalloid and colloid.11,13–17 These studies revealed an inconsistent
volume ratio of crystalloid vs colloid, ranging from 1.1 to 5, to achieve the same effect.11,13–17 In these studies, the
plasma-expanding effect was compared based on either the amount of fluid given or static parameters such as central venous pres-sure and pulmonary artery wedge prespres-sure. These hydrostatic parameters, however, may be less sensitive for detecting fluid responsiveness.18,19
Stroke volume variability (SVV) is a dynamic parameter that reflects intravascular fluid status and is frequently used in the perioperative period to assess fluid responsiveness. SVV represents the variability of estimated stroke volume during a mechanical ventilation cycle and is calculated by an arterial pulse contour analysis using a specially designed monitoring system (Vigileo-FloTrac™ system; Edwards Lifesciences Corp, Irvine, CA, USA). SVV is considered more reliable for predicting fluid responsiveness compared to static parameters.20,21 SVV, however, is not considered to be
sensitive for detecting fluid overload. In addition, it remains unclear whether SVV differentially responds depending on the solution type.
Left ventricular end-diastolic volume (LVEDV) is another parameter that reflects the ventricular preload. Studies report conflicting results regarding the sensitivity of LVEDV for predicting fluid responsiveness.2 These conflicting results
might be due to the technical limitations of two-dimensional echocardiography for accurately measuring left ventricular
(LV) volume.2 In the present study, three-dimensional
transesophageal echocardiography (3D-TEE) was therefore used to measure LV volumes, as volumetric analysis by real-time 3D-TEE is more accurate than two-dimensional TEE.22
We hypothesized that SVV and LVEDV differentially respond to a fluid bolus depending on the solution type. The present study was conducted to compare the effects of crystalloid and colloid bolus on SVV and LVEDV. The aim of this clinical trial was to investigate changes in LVEDV and SVV after fluid infusion of crystalloid or colloid using 3D-TEE and the Vigileo-FloTrac system.
Materials and methods
The study was a single-center, prospective, randomized study. The study protocol was approved by the Asahikawa Medical University Research Ethics Committee and registered as a clinical trial (UMIN000014227). Written informed consent was obtained from all patients. Consecu-tive patients with arteriosclerosis obliterans undergoing a scheduled arterial bypass procedure on a lower extremity were enrolled. Patients with arrhythmia, significant LV systolic dysfunction (LV ejection fraction ,50%), or con-traindications for TEE probe insertion were excluded from the study.
The patients were randomly assigned to receive a 500 mL infusion of hydroxyethyl starch (HES; HES group) or saline (Saline group). Randomization was performed using a random number table. Standardized perioperative care was provided to all patients. An arterial line was placed in the radial artery and connected to a Vigileo-FloTrac system (software version 3.02, Edwards Lifesciences Corp, Irvine, CA, USA). General anesthesia was performed using target-controlled intravenous infusion of propofol (effect site concentration 2.0–4.0 g/mL) and continuous infusion of remifentanil (0.2–0.3 g/kg/min). Depth of anesthesia was controlled to maintain a bispectral index between 40 and 60. Rocuronium was administered to facilitate endotra-cheal intubation and to provide adequate muscle relaxation during surgery when necessary. Phenylephrine (50 µg) was administered if necessary to maintain a mean arterial pressure .50 mmHg. In such case, the hemodynamic data were recorded at least 5 minutes after the phenylephrine administration to minimize the drug effect. Patients were mechanically ventilated with a tidal volume set between 8 and 10 mL/kg to achieve normocapnia, and positive end-expiratory pressure was applied at 5 cm H2O. A real-time 3D-TEE probe (X7-2t, Philips Medical Systems Japan,
International Journal of General Medicine downloaded from https://www.dovepress.com/ by 118.70.13.36 on 22-Aug-2020
Dovepress Stroke volume variability and left ventricular volume
Tokyo, Japan) was placed in the mid-esophageal position for LV volumetry. We confirmed hemodynamic stabiliza-tion ∼20 minutes after induction of the general anesthesia, and then performed the first (baseline) measurements. Study solution, 500 mL of either crystalloid or colloid, was administered via a dedicated peripheral venous line over 30 minutes. Normal saline and 6% HES solution with a molecular weight of 70 kDa and molar substitution ratio of 0.55 (Fresenius Kabi Japan, Tokyo, Japan) were used as the crystalloid and colloid solution, respectively. We performed a second measurement at the end of the infusion.
Vital signs (heart rate, and systolic and diastolic blood pressure) and hemodynamic parameters derived from the pulse contour analysis (SVV) were recorded as baseline before fluid infusion. Simultaneously, a full-volume 3D-TEE dataset was obtained to measure the LVEDV, left ventricular end-systolic volume, stroke volume, and LV ejection fraction
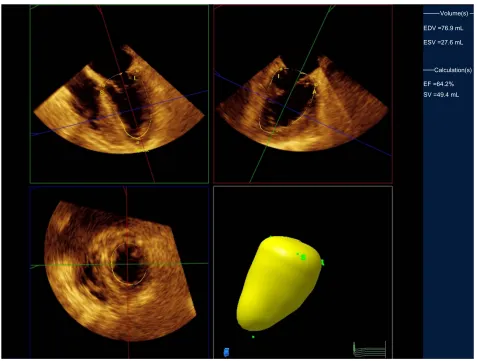
using quantitative analysis software (QLAB, Philips Medi-cal Systems Japan; Figure 1). Cardiac output with 3D-TEE was calculated as the stroke volume multiplied by the heart rate. These measurements were repeated after infusion of the study solution. Data collection and LV volumetry were performed by investigators blinded to the type of solution infused.
Sample size was estimated from preliminary examination of the change in SVV. A power analysis using G*Power ( software version 3.1.7; University of Düsseldorf, Düsseldorf, Germany) indicated that a minimum of ten patients would be needed for a β=0.1 and α=0.05. Statistical analysis was performed using Prism (software version 5.01; GraphPad Software, La Jolla, CA, USA). Patient characteristics between the groups were compared using Student’s t-test for continuous data and the chi-square test for categorical data. The hemodynamic parameters and LV volumetric data
Volume(s)
Calculation(s) EDV =76.9 mL
EF =64.2% ESV =27.6 mL
SV =49.4 mL
Figure 1 Measurement of LV end-diastolic volume.
Notes: After setting five points (S: Septal, L: Lateral, A: Anterior, I: Inferior, Apex), the system automatically tracks the complete LV endocardial borders to calculate the LV volume. Top two panels represent orthogonal two-dimensional views of the left ventricle with the yellow lines tracing the endocardial borders. Lower left panel presents the short-axis view. Lower right panel is a three-dimensional reconstruction.
Abbreviations: LV, left ventricular; EDV, end-diastolic volume; ESV, end-systolic volume; EF, ejection fraction; SV, stroke volume.
International Journal of General Medicine downloaded from https://www.dovepress.com/ by 118.70.13.36 on 22-Aug-2020
Dovepress
Kanda et al
Table 1 Patient characteristics
Saline group (n=11)
HES group (n=11)
P-value
Age (years) 71.2±8.2 71.5±13.6 ns
Height (cm) 161±8.6 160±12.1 ns
Weight (kg) 58.3±12.8 58.4±11.5 ns
Men/women (n) 7/4 9/2 ns
Hypertension (n) 10 8 ns
Coronary artery disease (n) 2 1 ns
Diabetes mellitus (n) 4 2 ns
Medication (n)
ccB 8 7 ns
arB 5 4 ns
Diuretic 1 1 ns
aspirin 2 1 ns
Sulfonylurea 3 2 ns
Note: Data are shown as mean ± sD.
Abbreviations: HES, hydroxyethyl starch; NS, not significant; CCB, calcium channel blocker; ARB, angiotensin receptor blocker; SD, standard deviation.
Table 2 Effect of fluid loading on hemodynamics, SVV, and LV
volume
Saline group (n=11)
HES group (n=11) Pre Post Pre Post
Vital signs
Heart rate (bpm) 66±16 62±12 69±13 64±12 Systolic BP (mmHg) 107±16 120±26 104±20 118±21* Diastolic BP (mmHg) 51±9 55±14 52±12 54±11 Pulse contour analysis
SVV (%) 14.3±3.9 8.8±3.1** 14.7±2.6 6.9±2.7** Volumetric analysis
LVEDV (mL) 88.8±17.3 91.4±17.6 87.1±24.0 99.9±27.2** LVESV (mL) 37.2±7.1 37.9±7.9 36.5±14.2 38.2±12.9 Stroke volume (mL) 51.6±13.4 54.1±12.8 50.6±12.5 61.6±19.1** Cardiac output (L/min) 3.4±1.1 3.3±1.0 3.5±1.1 3.9±1.3* Ejection fraction (%) 57.7±7.0 58.6±6.4 58.7±7.5 61.7±8.5 Notes: Data are shown as mean ± sD. *P,0.05 vs baseline; **P,0.01 vs baseline. Abbreviations: SVV, stroke volume variability; LV, left ventricular; HES, hydroxyethyl starch; BP, blood pressure; LVEDV, left ventricular end-diastolic volume; LVESV, left ventricular end-systolic volume; SD, standard deviation.
were compared using a paired t-test. A P-value of ,0.05 was considered statistically significant.
Results
A total of 26 consecutive patients were enrolled, four of whom were excluded for the following reasons: atrial fibrillation in two, LV systolic dysfunction in one, and inadequate echocar-diography imaging in one. As a result, 22 patients (eleven in the HES group and eleven in the Saline group) were analyzed. The patient backgrounds are summarized in Table 1. There were no significant differences between the groups. Eight patients (four in each group) received phenylephrine during fluid infusion in each group, and the total phenylephrine dose did not differ significantly between groups (HES group, 75±25 µg; Saline group, 88±25 µg; P.0.05).
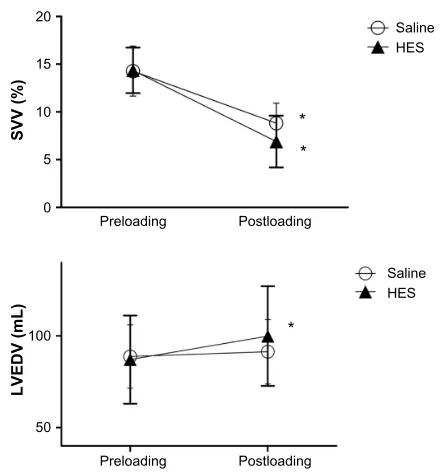
Vital signs, arterial pulse contour parameters, and LV volumes before and after fluid loading are summarized in Table 2. The baseline hemodynamics did not differ significantly between the groups. SVV significantly decreased after the infusion in both groups (HES group, 14.4%±2.4% to 6.9%±2.7%, P,0.001; Saline group, 14.3%±3.9% to 8.8%±3.1%, P,0.001; Figure 2). LVEDV significantly increased after the infusion in the HES group (87.1±24.0 mL to 99.9±27.2 mL, P,0.001) but not in the Saline group (88.8±17.3 mL to 91.4±17.6 mL, P.0.05; Fig-ure 2). Stroke volume significantly increased after the infusion in the HES groups (50.6±12.5 mL to 61.6±19.1 mL, P,0.01) but not in the Saline group (51.6±13.4 mL to 54.1±12.8 mL,
P.0.05). Cardiac output measured by 3D-TEE significantly increased after infusion in the HES group (3.5±1.1 L/min to 3.9±1.3 L/min, P,0.05), but there was no change in cardiac
output after fluid loading in the Saline group (3.4±1.1 L/min to 3.3±1.0 L/min, P.0.05).
Discussion
The aim of the present study was to determine whether the SVV response pattern differed following a 500 mL bolus
20
15
SVV (%
)
10
5
0
Preloading Postloading
Saline HES
LVEDV (mL)
100
50
Preloading Postloading
Saline
* * *
HES
Figure 2 Changes in the SVV and LVEDV following fluid loading.
Notes: SVV significantly decreased in both groups after fluid loading. LVEDV significantly increased in the HES group, but there was no change in the Saline group.
Data are shown as mean ± sD. *P,0.001 vs baseline.
Abbreviations: SVV, stroke volume variability; LVEDV, left ventricular end-diastolic volume; HES, hydroxyethyl starch; SD, standard deviation.
International Journal of General Medicine downloaded from https://www.dovepress.com/ by 118.70.13.36 on 22-Aug-2020
Dovepress Stroke volume variability and left ventricular volume
infusion of crystalloid or colloid over 30 minutes. Mean SVV before fluid bolus was .13% in both groups. Therefore, most of the patients were considered to be fluid responsive, indicating that fluid therapy should result in increased cardiac output.23 The SVV significantly decreased after fluid bolus
infusion in both the HES group and Saline group.
Colloid infusion was associated with significant increases in systolic blood pressure, LVEDV, stroke volume, and car-diac output.
Ewaldsson and Hahn reported that infusion of 25 mL/kg acetated Ringer’s solution over 30 minutes increases the plasma volume by 30% at the end of the infusion, and there-after, plasma volume remains 15%–20% higher.24 Similarly,
in our study, a large part of the infused crystalloid remained in the intravascular space immediately after bolus infusion provoked a similar decrease in the SVV.
Fluid responsiveness, as reflected by the high SVV, is explained by the status of the LV according to the Frank– Starling law.25 In this scheme, the LV functions at the steep
portion of the Frank–Starling curve if the patient is fluid responsive. In these cases, fluid therapy results in increased LV volume and therefore stroke volume. In fact, Kungys et al reported associated changes in SVV, LVEDV, and cardiac output according to changes in circulatory blood volume under conditions of acute normovolemic hemodilution.26
In the present study, however, crystalloid infusion was associated with a significant decrease in SVV without an increase in LVEDV. This phenomenon is inconsistent with the current concept of fluid responsiveness as described earlier, in which the fluid therapy is associated with both a decrease in SVV and an increase in the LV preload. Although the exact mechanism underlying this phenomenon is unclear, we speculate that a decrease in SVV occurs prior to the increase in LVEDV following infusion of a fluid bolus. Our data suggest that although colloid has a greater plasma-expanding effect than crystalloid, these two solutions can be considered to be equivalent if fluid therapy is guided by SVV. Furthermore, the greater plasma-expanding effect of colloid can be distinguished by the change in LVEDV but not in SVV. In our study, SVV and LVEDV were measured at only two time points, and the changes in LVEDV and SVV along the longer time course were not compared between the two types of fluids.
There are some limitations in our study. First, the sample was not large enough because it was conducted as a pilot study. Thereby, some evaluation items, in particular, cardiac output measured with the Vigileo-FloTrac system, might differentially respond with a larger sample size. Second, we evaluated the
hemodynamic parameters under certain conditions in which the loading dose and observational duration were limited. Changing the loading dose or measurement points may yield novel findings. Extensive surveys are needed to minimize these limitations. Finally, the European Medicines Agency and the US Food and Drug Administration have issued warnings regarding the use of HES for volume expansion in critically ill patients. The use of HES in these patients is associated with an increased risk of mortality and renal failure. In our study, all patients were stable, and there were no complications associated with the colloid infusion. This study revealed that colloid has a greater volume- expanding effect, as evidenced by the change in the LVEDV, but the risk–benefit ratio of colloid infusion should always be carefully considered.
Conclusion
The authors compared the effect of a bolus infusion of crys-talloid and colloid on SVV and LV volume. SVV similarly responded to a fluid bolus of either crystalloid or colloid. On the other hand, colloid infusion was associated with sig-nificant increases in systolic blood pressure, LVEDV, stroke volume, and cardiac output. Further studies are required to elucidate the differences between the effect of a bolus infu-sion of crystalloid and colloid on SVV and LVEDV over time with respect to goal-directed fluid therapy.
Author contributions
All authors contributed toward data analysis, drafting and critically revising the paper and agree to be accountable for all aspects of the work.
Disclosure
The authors report no conflicts of interest in this work.
References
1. Meng L, Tran NP, Alexander BS, et al. The impact of phenylephrine, ephedrine, and increased preload on third-generation Vigileo-FloTrac and esophageal Doppler cardiac output measurements. Anesth Analg. 2011;113(4):751–757.
2. Bendjelid K, Romand JA. Fluid responsiveness in mechanically ventilated patients: a review of indices used in intensive care. Intensive Care Med. 2003;29(3):352–360.
3. Smorenberg A, Ince C, Groeneveld AJ. Dose and type of crystalloid fluid therapy in adult hospitalized patients. Perioper Med (Lond). 2013; 2(1):17.
4. Davies SJ, Minhas S, Wilson RJ, Yates D, Howell SJ. Comparison of stroke volume and fluid responsiveness measurements in commonly used technologies for goal-directed therapy. J Clin Anesth. 2013;25(6): 466–474.
5. Mayer J, Boldt J, Mengistu AM, Röhm KD, Suttner S. Goal-directed intraoperative therapy based on autocalibrated arterial pressure waveform analysis reduces hospital stay in high-risk surgical patients: a randomized, controlled trial. Crit Care. 2010;14(1):R18.
International Journal of General Medicine downloaded from https://www.dovepress.com/ by 118.70.13.36 on 22-Aug-2020
International Journal of General Medicine
Publish your work in this journal
Submit your manuscript here:http://www.dovepress.com/international-journal-of-general-medicine-journal
The International Journal of General Medicine is an international, peer-reviewed open-access journal that focuses on general and internal medicine, pathogenesis, epidemiology, diagnosis, monitoring and treat-ment protocols. The journal is characterized by the rapid reporting of reviews, original research and clinical studies across all disease areas.
A key focus is the elucidation of disease processes and management protocols resulting in improved outcomes for the patient. The manu-script management system is completely online and includes a very quick and fair peer-review system. Visit http://www.dovepress.com/ testimonials.php to read real quotes from published authors.
Dovepress
Dove
press
Kanda et al
6. Benes J, Chytra I, Altmann P, et al. Intraoperative fluid optimization using stroke volume variation in high risk surgical patients: results of prospective randomized study. Crit Care. 2010;14:R118.
7. Myburgh JA, Mythen MG. Resuscitation fluids. N Engl J Med. 2013; 369(13):1243–1251.
8. Lobo DN, Stanga Z, Aloysius MM, et al. Effect of volume loading with 1 liter intravenous infusions of 0.9% saline, 4% succinylated gelatine (Gelofusine) and 6% hydroxyethyl starch (Voluven) on blood volume and endocrine responses: a randomized, three-way crossover study in healthy volunteers. Crit Care Med. 2010;38(2):464–470.
9. Mutter TC, Ruth CA, Dart AB. Hydroxyethyl starch (HES) versus other fluid therapies: effects on kidney function. Cochrane Databases Syst Rev. 2013;7:CD007594.
10. Bagshaw SM, Chawla LS. Hydroxyethyl starch for fluid resuscitation in critically ill patients. Can J Anesth. 2013;60(7):709–713.
11. Perner A, Haase N, Guttormsen AB, et al; 6S Trial Group; Scandinavian Critical Care Trials Group. Hydroxyethyl starch 130/0.42 versus Ringer’s acetate in severe sepsis. N Engl J Med. 2012;367:124–134. 12. Myburgh JA, Finfer S, Bellomo R, et al; CHEST Investigators;
Australian and New Zealand Intensive Care Society Clinical Trials Group. Hydroxyethyl starch or saline for fluid resuscitation in intensive care. N Engl J Med. 2012;367(20):1901–1911.
13. Bayer O, Reinhart K, Kohl M, et al. Effects of fluid resuscitation with synthetic colloids or crystalloids alone on shock reversal, fluid bal-ance, and patient outcomes in patients with severe sepsis: a prospective sequential analysis. Crit Care Med. 2012;40(9):2543–2551.
14. Guidet B, Martinet O, Boulain T, et al. Assessment of hemodynamic efficacy and safety of 6% hydroxyethyl starch 130/0.4 vs 0.9% NaCl fluid replacement in patients with severe sepsis: the CRYSTMAS study.
Crit Care. 2012;16(3):R94.
15. Finfer S, Bellomo R, Boyce N, et al. A comparison of albumin and saline for fluid resuscitation in the intensive care unit. N Engl J Med. 2004;350:2247–2256.
16. Younes RN, Yin KC, Amino CJ, Itinoshe M, Rocha e Silva M, Birolini D. Use of pentastarch in the treatment of patients with hemorrhagic hypovolemia: randomized phase II study in the emergency room. World J Surg. 1998;22(1):2–5.
17. Jacob M, Chappell D, Hofmann-Kiefer K, et al. The intravascular volume effect of Ringer’s lactate is below 20%: a prospective study in humans. Crit Care. 2012;16(3):R86.
18. Marik PE, Cavallazzi R. Does the central venous pressure predict fluid responsiveness? An updated meta-analysis and a plea for some common sense. Crit Care Med. 2013;41(7):1774–1781.
19. Jones AE, Shapiro NI, Trzeciak S, et al. Lactate clearance vs central venous oxygen saturation as goals of early sepsis therapy: a randomized clinical trial. JAMA. 2010;303(8):739–746.
20. Lahner D, Kabon B, Marschalek C, et al. Evaluation of stroke volume variation obtained by arterial pulse contour analysis to predict fluid responsiveness intraoperatively. Br J Anaesth. 2009;103:346–351. 21. Mailloux PT, Friderici J, Freda B, McGee WT. Establishing goals
of volume management in critically ill patients with renal failure.
J Nephrol. 2012;25(6):962–968.
22. Jacobs LD, Salgo IS, Goonewardena S, et al. Rapid online quantification of left ventricular volume from real-time three-dimensional echocar-diographic data. Eur Heart J. 2006;27:460–468.
23. Vieillard-Baron A, Chergui K, Rabiller A, et al. Superior vena cava collapsibility as a gauge of volume status in ventilated septic patients.
Intensive Care Med. 2004;30:1734–1739.
24. Ewaldsson CA, Hahn RG. Kinetics and extravascular retention of acetated Ringer’s solution during isoflurane or propofol anesthesia for thyroid surgery. Anesthesiology. 2005;103:460–469.
25. Michard F. Changes in arterial pressure during mechanical ventilation.
Anesthesiology. 2005;103:419–428.
26. Kungys G, Rose DD, Fleming NW. Stroke volume variation during acute normovolemic hemodilution. Anesth Analg. 2009;109:1823–1830.
International Journal of General Medicine downloaded from https://www.dovepress.com/ by 118.70.13.36 on 22-Aug-2020