Available online: https://edupediapublications.org/journals/index.php/IJR/ P a g e | 4263
Power Quality Improvement Using UPQC for Wind Farm
Generation System
G.Krishnaiah
M.Tech (Digital Systems and Computer Electronic)
Abstract: This project proposes a compensation strategy based on a particular CUPS device, the Unified Power Quality Compensator (UPQC). The control strategy of the Unified Power Quality Compensator device is to regulate the voltage in the Wind Farm, mitigate voltage fluctuations at grid side, manages active and reactive power in the series and shunt converters of the Unified Power Quality Compensator, and the exchange of power between converters through UPQC DC-Link. Simulations results show the effectiveness of the proposed compensation strategy for the enhancement of Power Quality and Wind Farm stability. In this project, a new compensation strategy implemented using an UPQC type compensator was presented, to connect SCIG based wind farms to weak distribution power grid. The simulation results show a good performance in the rejection of power fluctuation due to “tower shadow effect” and the regulation of voltage due to a sudden load connection. So, the effectiveness of the proposed compensation approach is demonstrated in the study case.
Keyword: Wind Energy, UPQC, voltage fluctuation, weak Grid
I. INTRODUCTION
The location of generation facilities for wind energy is determined by wind energy resource availability, often far from high voltage (HV) power transmission grids and major consumption centers [1]. In case of facilities with medium power ratings, the WF is connected through medium voltage (MV) distribution headlines. A situation commonly found in such scheme is that the power generated is comparable to the transport power capacity of the power grid to which the WF is connected, also known as weak grid connection.
The main feature of this type of connections is the increased voltage regulation sensitivity to changes in load [2]. So, the system’s ability to regulate voltage at the point of common coupling (PCC) to the electrical system is a key factor for the successful operation of the WF. Also, is well known that given the random nature of wind
resources, the WF generates fluctuating electric power. These fluctuations have a negative impact on stability and power quality in electric power systems. [3] Moreover, in exploitation of wind resources, turbines employing squirrel cage induction generators (SCIG) have been used since the beginnings. The operation of SCIG demands reactive power, usually provided from the mains and/or by local generation in capacitor banks [4], [5]. In the event that changes occur in its mechanical speed, i.e. due to wind disturbances, so will the WF active (reactive) power injected (demanded) into the power grid, leading to variations of WF terminal voltage because of system impedance.
Available online: https://edupediapublications.org/journals/index.php/IJR/ P a g e | 4264 In recent years, the technological development of
high power electronics devices has led to implementation of electronic equipment suited for electric power systems, with fast response compared to the line frequency. These active compensators allow great flexibility in:
a) Controlling the power flow in transmission systems using Flexible AC Transmission System (FACTS) devices, and
b) Enhancing the power quality in distribution systems employing Custom Power System (CUPS) devices [6] [9]. The use of these active compensators to improve integration of wind energy in weak grids is the approach adopted in this work.
In this paper we propose and analyse a compensation strategy using an UPQC, for the case of SCIG–based WF, connected to a weak distribution power grid. This system is taken from a real case [7].
II. RELATED WORK
The first electricity generating wind turbine, was a battery charging machine installed in July 1887 by Scottish academic James Blyth to light his holiday home in Marykirk, Scotland. The first utility grid connected wind turbine to operate in the UK was built by Jhon Brown & company in 1951 in the Orkney Islands. Today, 2012 Danish Vestas is the world’s biggest wind turbine manufacturer. The world’s first wind farm consists of 20 wind turbines rated at 30KW each was installed on the shoulder of crotched mountain in Southern New Hampshire in December, 1980.
As of February 2012, the Walney wind farm in UK is the largest offshore wind farm in the world at 367MW. The London array (630MW) is the largest project under construction.
III. SYSTEM DESCRIPTION AND
MODELLING A. System description
Fig.1 depicts the power system under consideration in this study.The WF is composed by 36 wind turbines using squirrel cage induction generators, adding up to 21.6MW electric power. Each turbine
has attached fixed reactive compensation capacitor banks (175kVAr), and is connected to the power grid via 630KVA 0.69/33Kv transformer. This system is taken from [7], and represents a real case.
Fig1.Study case power system
B. Turbine rotor and associated disturbances model
The power that can be extracted from a wind turbine is determined by the following expression:
P =1
2. ρ. π. R 2. ϑ3. C
p……1
Where ρ is air density, R the radius of the swept area, v the wind speed, and CP the power coefficient. For the considered turbines (600kW) the values are R = 31.2 m, = 1.225 kg/m3 and CP calculation is taken from [8].Then, a complete model of the WF is obtained by turbine aggregation; this implies that the whole WF can be modeled by only one equivalent wind turbine, whose power is the arithmetic sum of the power generated by each turbine according to the following equation:
PT= ∑i=1..xPi… ..…..2
Available online: https://edupediapublications.org/journals/index.php/IJR/ P a g e | 4265 3.N rotor for the three–bladed wind turbine, while
its amplitude depends on the geometry of the tower. In our case we have considered a mean wind speed of 12m/s and the amplitude modulation of 15%.
C. Model of induction generator
For the squirrel cage induction generator the model available in Matlab/Simulink SimPower Systems libraries is used. It consists of a fourth–order state– space electrical model and a second–order mechanical model [5].
D. Dynamic compensator model
The dynamic compensation of voltage variations is performed by injecting voltage in series and active– reactive power in the MV6 (PCC) busbar; this is accomplished by using a unified type compensator UPQC [9]. In Fig.2 we see the basic outline of this compensator; the busbars and impedances numbering is referred to Fig.1.
The operation is based on the generation of three phase voltages, using electronic converters either voltage source type (VSI–Voltage Source Inverter) or current source type (CSI–Current Source Inverter). VSI converters are preferred because of lower DC link losses and faster response in the system than CSI [9]. The shunt converter of UPQC is responsible for injecting current at PCC, while the series converter generates voltages between PCC and U1, as illustrated in the phasor diagram of Fig.3.
Fig. 2. Block diagram of UPQC
An important feature of this compensator is the operation of both VSI converters (series and shunt) sharing the same DC–bus, which enables the active power exchange between them. We have developed
a simulation model for the UPQC based on the ideas taken from [10].
Fig 3. Phasor diagram of UPQC
Since switching control of converters is out of the scope of this work, and considering that higher order harmonics generated by VSI converters are outside the bandwidth of significance in the simulation study, the converters are modelled using ideal controlled voltage sources.
IV. UPQC CONTROL STRATEGY
A. Series Connected Converter
To balance the voltages at the load bus by injecting negative and zero sequence voltages to compensate for those present in the source. To isolate the load bus from harmonics present
in the source voltages, by injecting the harmonic voltages
To regulate the magnitude of the load bus voltage by injecting the required active and reactive components (at fundamental frequency) depending on the power factor on the source side
To control the power factor at the input port of the UPQC (where the source is connected. Note that the power factor at the output port of the UPQC (connected to the load) is controlled by the shunt converter.
Available online: https://edupediapublications.org/journals/index.php/IJR/ P a g e | 4266
B. Shunt Connected Converter
To balance the source currents by injecting negative and zero sequence components required by the load.
The compensate for the harmonics in the load current by injecting the required harmonic currents
To control the power factor by injecting the required reactive current (at fundamental frequency)
To regulate the DC bus voltage.
Above Fig. 5 shows a block diagram of the shunt converter controller. This controller generates both voltages commands Ed_shuc (t)*and Eq_shuc (t)*
based on power fluctuations ∆P and ∆Q respectively. Such deviations are calculated subtracting the mean power from the instantaneous power measured in PCC.
Fig.5 Shunt Compensator Controllers
The mean values of active and reactive power are obtained by low–pass filtering, and the bandwidths of such filters are chosen so that the power fluctuation components selected for compensation, fall into the flicker band as stated in IEC61000-4-15 standard.
In turn, Ed_shuc(t)* also contains the control action
for the DC–bus voltage loop. This control loop will not interact with the fluctuating power compensation, because its components are lower in frequency than the flicker–band. The powers Pshuc(t) and Qshuc(t) are calculated in the rotating
reference frame, as follows:
Pshuc(t) = 3/2*VdPCC(t)*IdshuC(t)
Qshuc(t) = -3/2*VdPCC(t)*IqshuC(t) …….. (3)
Ignoring PCC voltage variation, these equations
can be written as follows:
PshuC(t) = K′p*Id_shuC(t)
QshuC(t) = K′q*Iq_shuC(t) …….. (4)
Taking in consideration that the shunt converter is
based on a VSI, we need to generate adequate
voltages to obtain the currents. This is achieved
using the VSI model proposed, leading to a linear
relationship between the generated power and the
controller voltages. The resultant equations are:
PshuC(t) = K′′p*Ed_shuC¥(t)
QshuC(t) = K′′q*Eq_shuC¥ (t) ……. (5)
P and Q control loops comprise proportional
controllers, while DC–bus loop, a PI controller.
Fig.6 Power Buffer Concepts
Available online: https://edupediapublications.org/journals/index.php/IJR/ P a g e | 4267 the bandwidth of significance in the simulation
study, the converters are modelled using ideal controlled voltage sources.
The control of the UPQC, will be implemented in a rotating frame dq0 using Park’s transformation. For the calculations, the Park Transform be used which is proportional to Direct quadrature zero
with a ratio.
Fig.7 Power Stage Compensator model AC Side
Because of this, it is usual to describe the Park Transform as qd0 to 0. These equations are the "shortcut" for the Clark and Park Transformations, instead of use both matrices with just one is enough. Throughout the document, qd0 Transformation will be called Park Transform, although it could be known as Clarke-Park Transformation.
Park Transformation with an angle Ө of a vector either (xabcå R) is defined as
xqd0 = T(Ө)*xabc
With
………….(6)
Then it could be said that the vector xqd0is the
vector xabcin dq0 on the angle Ө reference. As a
change of basis matrix T (Ө) is invertible. So, it's
true that Xabc = T-1(Ө)xqd0
………..(7)
With
………..(8)
Where fi=a,b,c represents either phase voltage or currents, and fi=d,q,0 represents that magnitudes transformed to the dq0 space. This transformation allows the alignment of a rotating reference frame with the positive sequence of the PCC voltages space vector. To accomplish this, a reference angle Ө synchronized with the PCC positive sequence fundamental voltage space vector is calculated using a Phase Locked Loop (PLL) system. In this work, an “instantaneous power theory” based PLL has been implemented. Under balance steady-state conditions, voltage and currents vectors in this synchronous reference frame are constant quantities. This feature is useful for analysis and decoupled control.
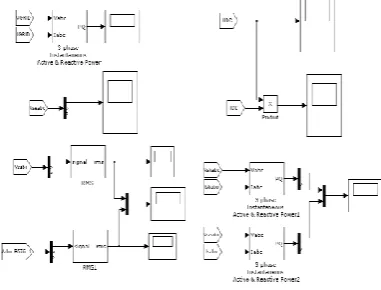
V. RESULTS & DISCUSSIONS
Available online: https://edupediapublications.org/journals/index.php/IJR/ P a g e | 4268 Fig.8 Simulation (MAT Lab) Circuits
A. Compensation of voltage fluctuation
Fig. 9(a) Active and reactive power of grid side
Fig.9 (b) PCC voltage
Fig. 9(c) WF terminal voltage
Simulation results for 0 < t < 4 are shown in Fig.9. (a, b,c). At t = 0.5′′ begins the cyclical power pulsation produced by the tower shadow effect. As
was mentioned, the tower shadow produces variation in torque, and hence in the active and reactive WF generated power. For nominal wind speed condition, the power fluctuation frequency is f = 3.4Hz and the amplitude of the resulting voltage variation at PCC expressed as a percentage is:
∆U
Urated= 1.50%... (9)
At t = 3.0′′ the active and reactive power pulsations are attenuated because the P and Q controllers come into action. The amplitude of the PCC voltage fluctuation is reduced from its original value of 1.6% (without compensation) to this new value:
∆U
Urated= 0.18%... (10)
B. Voltage regulation
Simulation results for 0 < t <8 are shown in Fig.10.(a,b,c,d),the UPQC is also operated to maintain the WF terminal voltage constant, rejecting PCC voltage variations, due to events like sudden connection or disconnection of loads, power system faults, etc.
VI. CONCLUSION
In this project, a new compensation strategy implemented using an UPQC type compensator was presented, to connect SCIG based wind farms to weak distribution power grid. The proposed compensation scheme enhances the system power quality, exploiting fully DC–bus energy storage and active power sharing between UPQC converters, features not present in DVR and D- STATCOM compensators. The simulation results show a good performance in the rejection of power fluctuation due to “tower shadow effect” and the regulation of voltage due to a sudden load connection. So, the effectiveness of the proposed compensation approach is demonstrated in the study case.
REFERENCES
Available online: https://edupediapublications.org/journals/index.php/IJR/ P a g e | 4269 [2] P.Ledesma, J. Usaola, J.L. Rodriguez
“Transient stability of a fixed speed wind farm” Renewable Energy 28, 2003 pp.1341–1355
[3] P. Rosas “Dynamic influences of wind power on the power system”. Technical report RISØR-1408. Ørsted Institute. March 2003.
[4] R.C. Dugan, M.F. Mc Granahan, S. Santoso, H.W. Beaty “Electrical Power Systems Quality” 2nd Edition McGraw–Hill, 2002. ISBN 0-07-138622-X
[5] P. Kundur “Power System Stability and Control” McGraw-Hill, 1994.ISBN 0-07-035958-X
[6] N. G. Hingorani y L. Gyugyi. Understanding FACTS”.IEEE Press; 2000.
[7] Z. Saad-Saoud, M.L. Lisboa, J.B. Ekanayake, N. Jenkins and G. Strbac “Application of STATCOM’s to wind farms” IEE Proc. Gen. Trans.Distrib. vol. 145, No. 5; Sept. 1998
[8] T. Burton, D. Sharpe, N. Jenkins, E. Bossanyi “Wind Energy Handbook” John Wiley & Sons, 2001.ISBN 0-471-48997-2.
[9] A. Ghosh, G. Ledwich “Power Quality Enhancement Using Custom Power Devices” Kluwer Academic Publisher, 2002. ISBN 1-4020-7180-9
[10] C. Schauder, H. Mehta “Vector analysis and control of advanced staticVAR compensators” IEE PROCEEDINGS-C, Vol.140, No.4, July 1993.
[11] E.M. Sasso, G.G. Sotelo, A.A. Ferreira, E.H. Watanabe, M. Aredes,P.G. Barbosa, “Investigac¸ ˜ao dos Modelos de Circuitos de SincronismoTrif´asicos Baseados na Teoria das Potˆencias Real e Imaginaria Instantˆaneas (p–PLL e q–PLL)”, In: Proc. (CDROM) of the CBA 2002 – XIV Congress Brasileiro de Automatic, pp. 480-485, Natal RN, Brasil, 1-4, Sep. 2002
[12] International Electro technical
Commission “INTERNATIONAL
STANDARDIEC 61000-4-15: Electromagnetic compatibility (EMC) Part 4: Testing and measurement techniques Section 15: Flicker meter
Functional and design specifications.” Edition 1.1 2003
[13] H. Akagi, E. H. Watanabe, M. Aredes “Instantaneous power theory andapplications to power conditioning”, John Wiley & Sons, 2007.ISBN978-0-470164
BioData