DOI : https://doi.org/10.32628/IJSRCSEIT
Framework for Sentimental Analysis of Twitter Data
B. U. Anubharathi1, Aishwarya V2, S. Aparna2, S. Divyaalakshmi2
1Assistant Professor(SS), Department of Computer Science and Engineering, Rajalakshmi Engineering College,
Thandalam,Tamil Nadu, India
2Department of Computer Science, Rajalakshmi Engineering College(Anna university),Thandalam,Tamil Nadu,
India ABSTRACT
Twitter like Micro-blogging sites has become a wide space for individuals or organizations across the globe to express their views and experience in the form of tweets. The surge of data can be processed using Data mining to obtain further understanding about the public opinions. sentimental analysis is used here to search needs by detecting opinions or emotions from the twitter data. Our results show the cleaned texts of individual tweets using R. Sentimental analysis of any keyword that is given by user is processed. Sentimental analysis used here is helpful in binary classification of tweets i.e. Classification of tweets into positive and negative. Consolidated to this we also analyse Multiple sentiments of the tweets. We likewise break down most extreme recurrence of catchphrase utilized in the tweets and its users. Trending hashtags according to location using location ID and pattern match technique is utilized in finding the recurrence of hashtags utilized in a tweet of explicit end client.
Keywords: Datamining; Social media; Twitter ; Sentimental analysis; Twitter APIs
I. INTRODUCTION
“Social media” has emerged as an efficient communication tool, and is increasingly used by every individual to share their feelings towards products, events or issues that impact their daily life. Social media technically refers to social networking sites such as Facebook, YouTube for sharing views on blogs and Twitter. Conventional surveys have been used to research public responses to obesity, cancer and bioterrorist attacks, but time & resources constraints are seen prevailing in such methods. Social media platforms like Twitter allow end users to easily collaborate and share information. This
interaction between billions of users makes social media an interesting place for mining data patterns of interest .
A)SOCIAL MEDIA -The idea of Web 2.0 have given support to a group of Internet-based applications that lets end users to create and share content; these applications have been characterized as types of
“Social Media” . The most popular social media platforms that are highly used include Facebook, Twitter, LinkedIn, Pinterest, and Google Plus , each focusing on different forms of communication . Pinterest is for sharing gifs and mages. LinkedIn is completely a business-oriented networking service. Facebook is seen as a social network while Twitter is an information network.
An earthquake reporting system based on tweets was successfully built. The resulted system identified 96% of earthquakes with an intensity of 3 or above on the Japan Meteorological Agency (JMA) seismic intensity scale, and the alerts provided were faster than the
JMA’s.
B) TWITTER - Twitter’s data have attracted huge number of research interest in different domains. Twitter is known as a source of breaking news and other high-value information.
Many examples suggest that Twitter data can be of much importance for predicting real world outcomes in different fields. Communication on Twitter is was not created by the poster.
Twitter users “follow” each other on the platform,
with new messages from each user automatically
being distributed to his/her “followers”. The system
provides standard default settings to set so the user can follow any other any user unless his/her profile is
‘private’. In this scenario, an initial request for approval is required. The “followers” concept is an
important aspect in the Twitter community that it purely determines the information being distributed .
C)TWITTER API’S FOR EXTRACTION -Twitter contents and network relations can be retrieved
through Twitter’s API. We use R programming to process and analyse the data. We use library
“twitteR” for accessing Twitter APIs . We use an “ROAuth” interface specification allowing users to authenticate to the server. “RCurl” Provides functions to allow one to make general HTTP requests and to fetch URIs, get & post forms.
Likewise this also process the results returned by the Web server.
D) SENTIMENT ANALYSIS - Literary data can be extensively arranged into two fundamental classes, opinions and facts. Sentiment analysis, otherwise called "opinion mining" is an opinion-related Natural Language Processing (NLP) strategy, which is ordinarily used to characterize the extremity (positive or negative) of content. Different methodologies are utilized for sentiment analysis, including lexicographical examination and machine learning techniques. Opinions can be comparative or regular. Standard conclusions of regular opinions are regularly alluded to just as "suppositions". In a near conclusion, at least two substances are looked at as far as their likenesses or contrasts; more often than not utilizing similar or superlative descriptors or verb modifiers gave one of the first investigations of sentiment analysis for Twitter information, utilizing AI calculations to classify message assumption and utilizing far off supervision and preparing information comprising of Twitter messages with emojis, which are utilized as loud marks. Sentiment analysis has been broadly utilized in the therapeutic area, fundamentally to process medical records in web. Different applications incorporate mining and recovering individual health data and emotions, for example, medicate audits, messages with respect to hearing misfortune, and individual health data. Different examinations have connected sentimental analysis to investigate the effects of messages identified with suicide goal, infertility treatments and disease.
II. METHODS AND MATERIAL
the R Foundation for Statistical Computing. The R language is broadly utilized among analysts and information excavators for creating factual programming and information investigation. Surveys, data mining overviews, and studies of databases show generous increments in fame as of late. The capacities of R are reached out through client made bundles, which permit particular measurable systems, graphical gadgets, import/trade abilities, tools like knitr, Sweave and so on.
The different packages used for sentiment analysis are
1. twitteR – twitteR is a R bundle which gives access to the Twitter API. Most usefulness of the API is upheld, with an inclination towards API calls that are increasingly valuable in information
examination rather than every day
communication.
2. stringr – A steady, basic and simple to utilize set of wrappers around the awesome 'stringi' bundle. All functions and argument names (and positions) are predictable, all functions manage "NA's" and zero length vectors similarly, and the yield from one function is anything but difficult to sustain into the contribution of another.
3. ROAuth – Gives an interface to the OAuth 1.0 detail enabling clients to verify by means of OAuth to their preferred server.
4. RCurl – A wrapper for 'libcurl' Provides attachment associations. Moreover, the basic execution is hearty and broad, supporting FTP/FTPS/TFTP (transfers and downloads),
SSL/HTTPS, telnet and furthermore underpins diverts, verification, and so on.
5. ggplot2 – A framework for 'definitively' making designs, in light of "The Grammar of Graphics". You give the information, tell 'ggplot2' how to outline to style, what graphical natives to utilize, and it deals with the subtleties.
6. reshape – Adaptably rebuild and total information utilizing
only two functions: cast and melt
7. tm – A structure for content mining applications inside R.
8. Wordcloud – Usefulness to make beautiful word mists, picture contrasts and comparability among records, and maintain a strategic distance from over-plotting in dissipate plots with content. 9. plyr – A lot of instruments that takes care of a
typical arrangement of issues: you have to separate a major issue into reasonable pieces, work on each piece and afterward put every one of the pieces back together. For instance, you should need to fit a model to each spatial area or time point in your examination, condense information by boards or breakdown high-dimensional clusters to more straightforward synopsis insights. The advancement of 'plyr' has been liberally bolstered by 'Becton Dickinson'. 10. e1071 – Functions for inactive class investigation,
brief time Fourier change, fluffy grouping, bolster vector machines, most brief way calculation, packed away bunching, innocent Bayes classifier.
III. IMPLEMENTATION
EXTRACTING TWEETS
–
CLEANING TWEETS
–
The tweets are cleaned using tm (Text Mining)
package in the backend coding which removes
all the URLs, Stop words , which is done in
context
–
based data mining (Andrea Vanzo and
Danilo Croce,2016).
PROCESSING TWEETS
–
1. To obtain the Tweets (Varsha Sahayak Vijay Shete Apashabi Pathan,2015) based on a particular Topic.
2. To obtain the Tweets based on language.
3. Perform region-based search for Tweets, fetch data to know the trending topics from the locality.
4. Perform sentiment analysis (Mohammed Issa M.A1-Kharusi Abubakar Usman Awwalu, 2012) on keyword-based search for tweets, fetch data to give an output which is very specific and gives us the result stating the polarity of the Tweet generated i.e., whether the Tweet is positive/ negative or Neutral (Chenguang Kong, 2018). Take the help of pie chart, histogram and bar chart to show the result. Word cloud is created for the cleaned tweets.
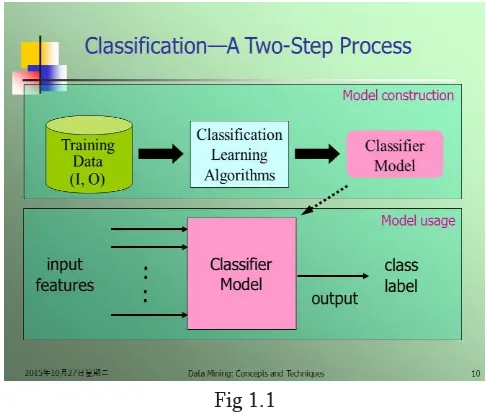
(1) CLASSIFICATION – Classification is an
information mining function that allots things in a gathering to target classifications or classes. The objective of grouping is to precisely anticipate the objective class for each case in the data. Classification starts with an data set collection in which the class assignments are known. An order demonstrate that predicts credit hazard could be created dependent on watched information for some advance candidates over some undefined time frame. Combined to the verifiable credit rating , the information may follow work history, home possession or rental, number and investment types, etc.
Fig 1.1 (2) CLUSTERING & REGRESSION –
Clustering is an unsupervised AI strategy that
endeavors to reveal the normal groupings and
measurable disseminations of information. There
are various grouping strategies, for example,
K-implies or Hierarchical Clustering. Regularly, a
proportion of separation from point to point is
utilized to discover which classification a point
ought to have a place with similarly as with
K-implies. Progressive bunching tries to develop or
separate arrangements of groups dependent on
the info data. This enables the client to utilize
the arrangements of groups that best achieve
their motivation.
Regression is an information mining system used
to anticipate a scope of numeric qualities
(likewise called nonstop qualities), given a
specific dataset. Regression is utilized over
various enterprises for business and advertising
arranging, monetary gauging , ecological
demonstrating and investigation of trends. The
least complex and most established type of
relapse is direct relapse used to evaluate a
connection between two factors.
Fig. 2.2
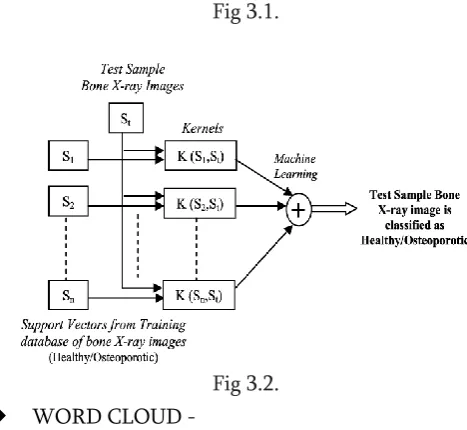
(3) SUPPORT VECTOR MACHINE –
A Support Vector Machine is a distinguishing
classifier defined as a dividing hyperplane. It can
even be labelled as training data , a
supervised learning method . The algorithm produces anoptimal hyperplane which classifies into
particular groups . In 2-dimensional area ,this
hyperplane divide the lines of a plane in two
various parts , where each class place in either
sides.
Fig 3.1.
Fig 3.2.
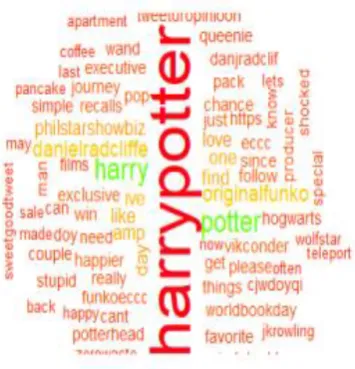
WORD CLOUD -
A word cloud (Shubham S.Deshmukh ,2017) can be a helpful apparatus when you have to feature the most ordinarily
referred to words in a content utilizing a
perception, component rich and with a GUI . Library“word cloud” package is used to create word clouds using the words of higher frequencies , identify differences and resemblance between documents.
Fig 5.1.2
SENTIMENTAL ANALYSIS PIE CHART –
(4) Pie chart is a depiction of statistics in a circular form, which divides itself into numerous slices to show the proportionality of the quantity it represents. Here , the sentimental analysis (Ankita Gupta,2017) of different catchphrases or keywords are obtained and displayed as pie chart.
GGPlot2 – Ggplot2 is a package that is used for presenting pie chart of sentimentally analysed data. R package ggplot2 was developed from
Wilkinson’s writings. It follows designing principles of Edward Tufte. Pie charts are formed by changing a bar chart using polar coordinates. In the ggplot2 , the below components are used :
• Data
• Faceting
• Position Adjustments
• Aesthetic Mapping
• Geometric Objects
• Statistical Transformations
• Coordinate System
Fig 5.2.2
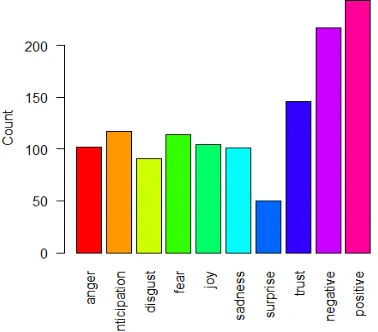
HISTOGRAM OF SENTIMENT ANALYSIS –
A histogram is an exact portrayal of the
dispersion of numerical information.
Histograms
give a harsh sensing of the density of the
fundamental dissemination of the information,
and
regularly
for
thickness
estimation:
measuring the probability density function of the
basic variable.
Fig.5.3.2
Fig.5.3.3
DISPLAY OF SENTIMENTAL ANALYSIS
USING BAR CHART
Bar charts are the graphical representation of the variables measured using rectangular bars. They are plotted either in a vertical or horizontal manner. Bar charts compare distinct variables. Here the different sentiments of the catchphrases are analysed and plotted in the form of bar charts.
Fig.5.4.1
Fig.5.4.2
5. Trace the users twitter content for calculating maximum usage of catchphrase using clustering technique.
IV.RESULTS AND DISCUSSION
All the twitter data obtained are the result of the data mining from twitter using R. These data can be stored in the form of data frame. This data frame helps us to store the tweets retrieved in an excel sheet format . These files store the retrieved tweets and the sentimentally analysed data , which shows the created date of tweets, cleaned data and the positive , negative and neutral classification of tweets.
TABLEI
TABLEII
Figures and Tables
The table and figures provided here are the obtained sentimental analysis results of an end user given catchphrases , which indeed shows that a data can be extracted even through a keyword in data mining . Sentimental analysis is proceeded in the above mentioned procedures and these figures are produced as a result of it.
.
Figure 1. Word cloud formed through sentimental analysis
Figure 2. pie chart formed through sentimental analysis of catchphrase ”Nipah virus”
V.CONCLUSION
Our analysis gives the development of social media platforms has altered the way people perceive and share information, with specific individuals and enterprise, allowing to broadcast views from any far away or remote location through mobile devices and Internet. The distinct tweets is expected to provide more exact representation of events than the traditional surveys. The collection and consolidation of such social media data can lead to better decision making. The outcomes derived provides end users the sentiment analysis of twitter data related to the Lecturer, Department Of Computer Science,
Amrita Vishwa Vidyapeetham, Mysore
Campus, Sentiment analysis of twitter data based on user based behaviour, 2015.
[2]. Study and Analysis of Data mining Algorithms for Healthcare Decision Support System Monali Dey, Siddharth Swarup Rautaray Computer School of KIIT University, Bhubaneswar ,India,2014
[3]. International Journal of Innovative Research in Science, Engineering and Technology (An ISO 3297: 2007 Certified Organization) Vol. 5, Issue 8, August 2016 Copyright to IJIRSET DOI:10.15680/IJIRSET.2016.0508032 14538 A Survey of Health Care Prediction Using Data Mining Sujatha R 1 , Sumathy R 2 , Anitha Nithya R 3 Assistant Professor, Dept. of Computer Science Engineering, Sri Krishna College of Technology, Coimbatore, India. [4]. Chuan-Jun Su and Jorge A.Quan Yon,
“Sentiment Analysis and Information Diffusion
On Social Media:The case of the Zika virus,”
International Journal of Information and Education Technology ,Sentiment Analysis and Information Diffusion on Social Media: The Case of the Zika Virus, 2018.
[5]. Chenfei Sun ; Qingzhong Li ; Lizhen Cui ; Hui Li ; Yuliang Shi, Heterogeneous network-based chronic disease progression mining, 2018 [6]. Erin Hea-Jin Kim Yoo Kyung Jeong, Yuyoung
Kang, Min Song, Department of Library and Information Science, Yonsei University, Korea, Topic based content and Sentimental Analysis of Ebola virus on Twitter and in the News, 2015.
[7]. Sunil Kumar and Maninder Singh, Big Data Analytics for healthcare Industry , 2018.
[8]. Prof. GVNKV Subbarao1 , Prof.MD
Sameeruddin Khan2 , K.VIJAY KUMAR3 1,2,3 CSE Department, Sree Dattha Institute of Engineering & Science, Case Study on Data Mining Application in Health Care Monitoring Systems, May 2016.
[9]. Pieter Noordhuis, Micheal Heijkoop, Alexander Lazovik, Mining Twitter in the cloud : A case study, 2010.
[10]. Apoor V Agarwal Jasnee t Singh Sabharwal2 Columbia University, NY,U.S.A.(2) Guru Gobind Singh Indraprastha University, New Delhi, India, End-to-End sentiment Analysis of Twitter Data, 2012.
[11]. Chenguang Kong Department of Computer Science, Georgia State University, Atlanta, GA 30309, USA Guangchun Luo School of Computer Science and Engineering, University of Electronic Science and Technology of China, Chengdu 610054, China Ling Tian School of Computer Science and Engineering, University of Electronic Science and Technology of China,
Chengdu 610054, China Xiaojun Cao
Disseminating authorized content via data analysis in opportunistic social networks,2018.
[12]. HENFENG LEI, SHUANGYUANYANG, HAN
LIU,(Member,IEEE), SABA
ASLAM,(Member,IEEE), JINYU LIU,
HALEFOM TEKLE, EMMANUEL BUGINGO,
AND DEFU ZHANG, (Member,IEEE)
University of science and Technology, Hong Kong, Mining of Nutritional Ingredients in Food for Disease Analysis, 2018.
[13]. Andrea Vanzo and Danilo Croce and Roberto Basili Department of Enterprise Engineering University of Roma Tor VergataVia del Politecnico 1,00133 Roma Italy, Context based model for Sentimental Analysis in Twitter, 2016.
[14]. Ankita Gupta, Jyotika Pruthi, Neha Sahu, Ankita Gupta, Student, Dept. Of Computer Science THE NORTHCAP UNIVERSITY, Sector 23A Gurgaon, Haryana(122017), INDIA, Sentimental analysis of tweets using Machine Learning Approach, 2017.
[15]. Shubham S.Deshmukh, Harshal Joshi, Pranali Pandhare, Aniket M.Junghare 1,2,3,4BE in Computer engg. ZCOER, Pune, Maharashtra, India, Twitter data Analysis using R, International Journal of Science, Engineering and Technology Research(IJSETR)Volume 6,Issue 4, April 2017,ISSN:2278 – 7798, 2017. [16]. Varsha Sahayak Vijay Shete Apashabi Pathan
BE (IT) BE (IT) ME(Computer)Department of Information Technology, Savitribai Phule Pune University, Pune, India, Sentiment Analysis of Twitter Data International Journal of
Innovative Research in Advanced
Engineering(IJIRAE) Issue 1, Volume 2, 2015. [17]. Chenguang Kong Ling Tian School of
(Computer Science and Engineering, University of Electronic Science and Technology of China,
Chengdu 610054, China Xiaojun Cao
Department of Computer science, Georgia state
University, Atlanta, GA 30309,USA,
Disseminating authorized content via data analysis in opportunistic social networks, 2018. [18]. James Spencer and Gulden Uchyigit. School of
Computing , Engineering and Mathematics University of Brighton,Brighton,BN2 4GJ.2014 International Conference on Information
Technology and
Multimedia(ICIMU).November 18-20,
2014,Putrajaya,Malaysia, Sentimentor: Sentiment Analysis of Twitter Data, 2014. [19]. Zoubida Alaoui Mdaghri, Mourad El Yadari,
Abdelillah Benyoussef, Abdellah El Kenz Faculty of Science Rabat Morocco, Rabat ,Study and analysis of Data Mining for Healthcare, 2016.
[20]. Mohammed Issa M.A1-Kharusi Abubakar Usman Jamilu Awwalu, Development of a Smart Environment for sentimental analysis, Data analysis and New Knowledge Mining, 2012.
Cite this article as :
B. U. Anubharathi, Aishwarya V, S. Aparna, S. Divyaalakshmi, "Framework for Sentimental Analysis of Twitter Data", International Journal of Scientific Research in Computer Science, Engineering and Information Technology (IJSRCSEIT), ISSN : 2456-3307, Volume 5 Issue 2, pp. 345-354, March-April
2019. Available at doi :
https://doi.org/10.32628/CSEIT195258