Infection and Drug Resistance 2018:11 1283–1297
Infection and Drug Resistance
Dovepress
submit your manuscript | www.dovepress.com 1283
O R I G I N A L R E S E A R C H
open access to scientific and medical research
Open Access Full Text Article
Trough concentration of itraconazole and its
relationship with efficacy and safety: a systematic
review and meta-analysis
Jingru Zhang1,2
Yiwei Liu1
Xiaolu Nie1
Yuncui Yu1
Jian Gu3
Libo Zhao1
1Clinical Research Center, Beijing Children’s Hospital, Capital Medical
University, Beijing, China; 2Department
of Pharmacy Administration and Clinical Pharmacy, Peking University School of Pharmaceutical Sciences,
Beijing, China; 3Department of
Pharmacy, Peking University People’s Hospital, Beijing, China
Objectives: The optimum trough concentration of itraconazole for clinical response and safty
is controversial. The objective of this systematic review and meta-analysis was to determine the optimum trough concentration of itraconazole and evaluate its relationship with efficacy and safety.
Methods: We searched PubMed, EMBASE, Web of Science, the Cochrane Library,
Clinical-Trials.gov, and three Chinese literature databases (CNKI, WanFang, and CBM). We included observational studies that compared clinical outcomes below or above the trough concentra-tion cut-off value which we set as 0.25, 0.5, and 1.0 mg/L. The efficacy outcomes were rate of successful treatment, rate of prophylaxis failure and invasive fungal infection (IFI)-related mortality. The safety outcomes included incidents of hepatotoxicity and other adverse events.
Results: The study included a total of 29 studies involving 2,346 patients. Our meta-analysis
showed that compared with itraconazole trough concentrations (Ctrough) of ≥0.25 mg/L, levels of
<0.25 mg/L significantly increased the incidence of IFI for prophylaxis (RR =3.279, 95% confidence interval [CI] 1.73–6.206). Moreover, the success rate of treatment decreased significantly at a cut-off level of 0.5 mg/L (RR =0.396, 95% CI 0.176–0.889). An itraconazole trough level of 1.0 mg/L was associated with hepatotoxicity and other adverse events in a review of many studies.
Conclusion: An itraconazole trough concentration of 0.25 mg/L should be considered as the
lower threshold for prophylaxis, and a target concentration of 0.5 mg/L should be the lower limit for effective treatment. A trough level of 1.0 mg/L is associated with increased hepatotoxicity and other adverse events (using High Performance Liquid Chromatography [HPLC]).
Keywords: itraconazole, trough concentration, efficacy, safety, meta-analysis
Introduction
Fungal infections exact a significant toll on human health and often compromise the clinical outcomes of patients. Prevalently, invasive fungal infection (IFI) is a leading cause of morbidity and mortality among neutropenic patients after intensive chemo-therapy or hematopoietic stem cell transplantation, as well as in other
immunocompro-mised populations.1–3 Itraconazole is a first-generation triazole antifungal agent with
broad-spectrum antifungal activity. In clinical practice, it is commonly used for fungal pathogen infections, such as Candida spp., Cryptococcus neoformans, and Aspergillus
spp.4 Itraconazole is often recommended as primary therapy for IFI5–9 and as antifungal
prophylaxis in immunocompromised patients.10–12 Due to variable and unpredictable oral
bioavailability and drug–drug interaction, a satisfactory pharmacokinetics profile can-not be developed with itraconazole in some conditions, making it difficult to determine
the optimal dosing regimen.13 Hence, therapeutic drug monitoring (TDM), a technique
Correspondence: Libo Zhao Clinical Research Center, Beijing Children’s Hospital, Capital Medical University, 56 Nanlishi Road, Xicheng District, Beijing 100045, China Tel +86 136 8132 4810 Email [email protected]
Journal name: Infection and Drug Resistance Article Designation: ORIGINAL RESEARCH Year: 2018
Volume: 11
Running head verso: Zhang et al
Running head recto: Relationship of itraconazole trough concentration with efficacy and safety DOI: http://dx.doi.org/10.2147/IDR.S170706
Infection and Drug Resistance downloaded from https://www.dovepress.com/ by 118.70.13.36 on 22-Aug-2020
For personal use only.
Dovepress Zhang et al
that timely and appropriately guides drug dosage
modifica-tions, is suggested to optimize the treatment.14 Itraconazole
trough concentration (Ctrough) is a strong biomarker for drug
exposure,15 but most guidelines do not explicitly recommend
an optimum trough concentration.
To our knowledge, there have been no randomized controlled trials on the target trough level, so there is no conclusive evidence on the relationship between the optimum trough concentration of itraconazole and its efficacy or safety. However, numerous observational studies have concluded minimum itraconazole level cut-off values, including
0.25,16,17 0.5,18,19 and 1.0 mg/L.20A 2014 guideline from
the British society for medical mycology recommended an itraconazole trough concentration of 0.5–1.0 mg/L to prevent
and treat IFI,21 which was based on some observational
studies22–30 and a previous meta-analysis in 2003.31 This
guideline also proposed an increased incidence of toxicity at higher itraconazole concentrations citing two studies which
quantified itraconazole concentrations.32,33
Evidence for itraconazole target and critical trough concentrations described in these studies however, remains controversial and has significant limitations. For example, most of the observational studies which contributed to the aforementioned guideline were published more than 20 years ago. These studies often had no clear inclusion/exclusion
criteria. Furthermore, the meta-analysis in the guideline31 has
drawbacks such as lack of standardized outcome definitions among included studies, no detailed itraconazole concen-tration data, no well-established methodology to perform quality assessment and subgroup analysis to explore the heterogeneity. More importantly, the previous and other
meta-analyses34,35 were all focused on the evidence of anti-mycoses
efficacy or prophylaxis IFIs, rather than on the relationship between itraconazole concentration and efficacy or safety. Therefore, further evaluation of available literature is indi-cated to provide consistent recommendations for optimizing trough concentration. The objective of this systematic review and meta-analysis was to evaluate the relationship between the reported itraconazole trough concentration and the effi-cacy/safety of itraconazole.
Methods
Data sources
We performed this meta-analysis according to the Cochrane Handbook for Systematic Reviews and the Meta-analysis
of Observational Studies in Epidemiology guidelines.36 Two
reviewers independently searched PubMed, EMBASE, Web of Science, the Cochrane Library, ClinicalTrials.gov, and
three Chinese literature databases (CNKI, WanFang, and CBM) from inception until October 2017. We also examined reference lists of retrieved articles and related reviews. We used the search terms “itraconazole” and “concentration”. We set no restrictions on language or study design.
Study selection
Two reviewers (JZ and YL) independently conducted initial screening and assessed titles, abstracts, and citations in greater detail. We included studies if: i) it was an observa-tional study; ii) itraconazole was used for treatment or pro-phylaxis; iii) TDM was performed; iv) trough concentrations at steady state were reported for included patients; v) suffi-cient data about rate of treatment success, rate of prophylaxis failure, mortality or incidence of itraconazole-related adverse events (eg, hepatotoxicity) were reported; vi) sample size
was ≥10 patients; and (vii) full text of the publication was
available. The same reviewers retrieved and assessed the full text of potentially relevant articles using the same criteria. Disagreements were resolved through discussion.
Our exclusion criteria included: i) data came from simu-lated patients or pharmacokinetic models rather than from real patients; ii) concentrations were not troughs; iii) concen-trations were not measured at steady state; iv) concenconcen-trations were measured by bioassay.
Cut-off value establishment
Previous studies37–39 showed the MIC90 (MIC at which
90% of isolates were inhibited) of itraconazole for most yeasts and molds was between 0.25 and 1.0 mg/L. Some studies had shown a target itraconazole trough
concentra-tion of 0.25 mg/L.16,17 A guideline21 and other observational
studies18,19 suggested 0.5–1.0 mg/L as itraconazole trough
concentration. Patients with Ctrough of 1.0 mg/L were
associ-ated with a high level of clinical response according to Kim
et al’s 2014 study20 and others.40 Therefore, we established
the stepwise cut-off values for itraconazole efficacy and safety as 0.25, 0.5, and 1.0 mg/L.
Data extraction and outcomes
The efficacy outcomes included were: IFI-related mortal-ity, treatment success, and prophylaxis failure. Prophylaxis failure was evaluated by the incidence of IFIs, wherein, a high-risk ratio (RR) meant a high treatment success rate or prophylaxis failure rate. The major safety outcomes were hepatotoxicity and occurrence of adverse events. The pooled analysis for treatment success included only treatment stud-ies, while the analysis for prophylaxis failure included only
Infection and Drug Resistance downloaded from https://www.dovepress.com/ by 118.70.13.36 on 22-Aug-2020
Dovepress Relationship of itraconazole trough concentration with efficacy and safety
prophylaxis studies, and the analysis of side effects included all studies.
Two authors extracted data independently (JZ and YL) and resolved any disagreements by discussion or by a third inves-tigator (XN). We extracted study characteristics, participants’ baseline characteristics, methods for measuring itraconazole concentration, type of trough concentration (initial, mean or maximum), cut-off value of itraconazole trough concentra-tion, and pre-specified study outcomes of efficacy and safety from each study under review. If the study already contained a cut-off value, we considered patient groups below the pre-defined cut-off value as the intervention group, and those above the pre-defined cut-off value as the control. If studies contained no control group, we collected them into a single arm comparison. When individual patient data were available, we used all our pre-defined cut-off values to divide patients into two groups in the same way and extracted the number of events. When the trough concentration was measured multiple times for each patient, we used the mean value of multiple measurements, and we only used the median value when the mean was not available. If neither mean nor median was available, we used the reported trough concentration for that patient in the article. If there were multiple data for the same outcome in an article, we chose the outcome data measured at Day 14 considering itraconazole accumulates slowly and generally reaches concentrations steadily after
7–15 days of dosing.41,42
Quality assessment
Two independent reviewers (JZ and YL) completed the assessment. We applied the Newcastle–Ottawa Quality Assessment Scale to assess the quality of the included studies
with control,43 and used a star system (maximum of nine stars)
to evaluate the methodological quality of each study. For observational studies without control, we applied a modified version of the Scale that does not evaluate the comparability
part, and possible scores ranged from 0 to 6.44 Higher scores
indicated better quality. We resolved any disagreements between the reviewers through discussion. A third reviewer (XN) was available to settle any disputes.
Data analysis
We performed all analyses using the Open Meta-Analyst
software (Tufts Medical Center, Boston, MA, USA). The I2
statistic was used to assess heterogeneity among studies. I2
values over 25%, 50%, and 75% represented low, moderate,
and considerable heterogeneity, respectively.45 To assess
variations between studies in addition to sampling error within
studies, we selected the fixed-effects model if I2<50%, and the
random-effects model when I2≥50%. The DerSimonian–Laird
or the Mantel–Haenszel method was used to calculate the PR or RR and 95% confidence interval (CI) for each study. The 95% CI of outcome among distinct groups did not overlap,
showing that outcomes were statistically significant. P<0.05
was considered statistically significant.
Subgroup analyses
To explore the heterogeneity among different studies, we performed a subgroup analysis when more than two stud-ies were included in the analysis of each cut-off level. For the treatment outcome, studies were stratified by: i) studies reporting single drug therapy compared with studies includ-ing patients on combination therapy (at least some patients on combination therapy); ii) studies located in Asian countries compared with in non-Asian countries. For the prophylaxis outcome, studies were stratified by location in Asian countries or European countries, or in America and Australia.
Sensitivity analysis
We performed sensitivity analysis to examine whether a single study substantially influenced the core results. We excluded each study and evaluated its effect on the sum-mary estimates and heterogeneity of the main analysis, then reported the results for sensitivity analysis if the conclusions differed.
Results
Literature searches and study inclusion
The literature selection process is summarized in Figure 1. A total of 7,007 articles were initially identified. After initial screening, 68 full-text, potentially relevant articles were selected, 39 studies were excluded owing to inadequate clinical outcomes data, concentration was not a trough or at steady-state, or itraconazole alone, or measured by bioassay, among other reasons. Ultimately, 29 articles involving 2,346 patients were included for meta-analysis.16–19,22–24,30,46–65
Study characteristics
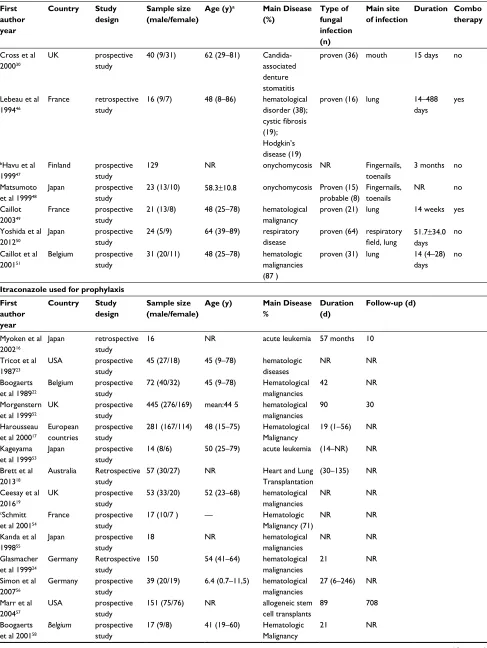
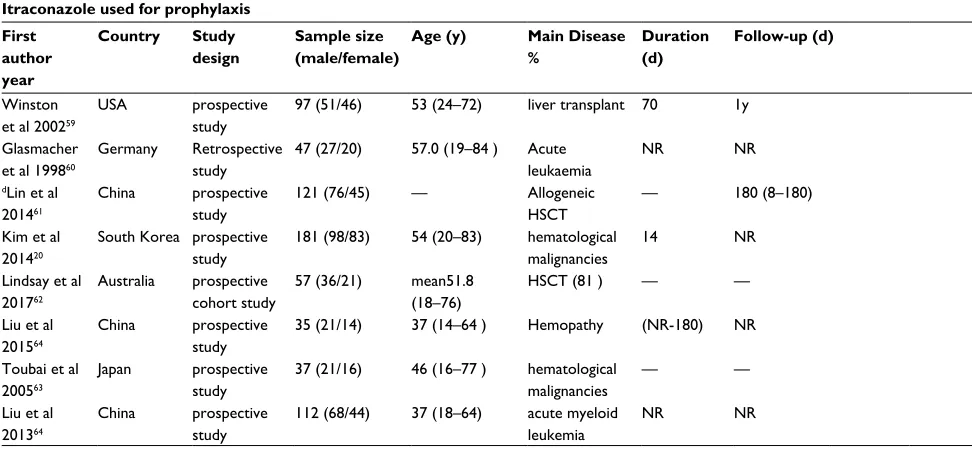
A summary of descriptions of included studies is reported in Table 1. Of these 29 studies, seven studies used itracon-azole for treatment30,46–51 and 22 studies used itraconazole for
prophylaxis.16–19,22–24,52–65 Fourteen were conducted in
Euro-pean countries, six were in Japan,16,48,50,53,55,63 three were in China,61,64,65 three were in America,23,57,59 two in Australia,18,62
and one in South Korea.20 Among these, two studies were
con-ducted in children who used itraconazole for prophylaxis.54,56
Infection and Drug Resistance downloaded from https://www.dovepress.com/ by 118.70.13.36 on 22-Aug-2020
Dovepress Zhang et al
Figure 1 Flow chart of study selection.
Abbreviations: TDM, therapeutic drug monitoring; PK, pharmacokinetic. 7,007 potentially relevant articles identified from database
PubMed (n=2094) EMBASE (n=1233) Cochrane library (n=225) Web of Science (n=3058)
Duplicate articles (n=2,550)
Articles excluded through screening title and abstract (n=4,217)
Clinical trials.gov (n=21)
WanFang (n=128) CBM (n=115)
Potentially relevant refrences (n=4,457)
Articles retrieved and screened in detail (n=261)
Full-text of potentially relevant articles (n=68)
Observational studies included in meta-analysis (n=29)
Articles excluded through screening full-text (n=193) Inadequate outcome data (n=13)
Sample size less than 10 (n=4) TDM was not performed (n=54) Interaction with other drugs (n=23)
PK characteristics of healthy volunteers (n=25) Reviews, case reports, letters (n=34)
Other reasons (n=40)
Articles excluded from the meta analysis (n=39) Only adverse events were reported (n=7) Concentration was not a trough or at steady-state or itracinazole alone (n=7)
Reviews (n=3)
Concentration measured by bioassay (n=8) Inadequate clinical data or other reasons (n=14) CNKI (n=154)
Infection and Drug Resistance downloaded from https://www.dovepress.com/ by 118.70.13.36 on 22-Aug-2020
Dovepress Relationship of itraconazole trough concentration with efficacy and safety
(Continued)
Table 1 Characteristics of included studies
Itraconazole used for treatment First author year Country Study design Sample size (male/female)
Age (y)a Main Disease
(%) Type of fungal infection (n) Main site of infection
Duration Combo therapy
Cross et al 200030
UK prospective
study
40 (9/31) 62 (29–81) Candida-associated denture stomatitis
proven (36) mouth 15 days no
Lebeau et al 199446
France retrospective study
16 (9/7) 48 (8–86) hematological
disorder (38); cystic fibrosis (19); Hodgkin’s disease (19)
proven (16) lung 14–488
days
yes
bHavu et al 199947
Finland prospective study
129 NR onychomycosis NR Fingernails,
toenails
3 months no
Matsumoto et al 199948
Japan prospective study
23 (13/10) 58.3±10.8 onychomycosis Proven (15) probable (8) Fingernails, toenails NR no Caillot 200349 France prospective study
21 (13/8) 48 (25–78) hematological malignancy
proven (21) lung 14 weeks yes
Yoshida et al 201250
Japan prospective study
24 (5/9) 64 (39–89) respiratory
disease
proven (64) respiratory
field, lung 51.7±34.0 days no
Caillot et al 200151
Belgium prospective study
31 (20/11) 48 (25–78) hematologic malignancies (87 )
proven (31) lung 14 (4–28) days
no
Itraconazole used for prophylaxis First author year Country Study design Sample size (male/female)
Age (y) Main Disease %
Duration (d)
Follow-up (d)
Myoken et al 200216
Japan retrospective study
16 NR acute leukemia 57 months 10
Tricot et al 198723
USA prospective
study
45 (27/18) 45 (9–78) hematologic
diseases
NR NR
Boogaerts et al 198922
Belgium prospective study
72 (40/32) 45 (9–78) Hematological malignancies
42 NR
Morgenstern et al 199952
UK prospective
study
445 (276/169) mean:44·5 hematological
malignancies
90 30
Harousseau et al 200017
European countries
prospective study
281 (167/114) 48 (15–75) Hematological
Malignancy
19 (1–56) NR
Kageyama et al 199953
Japan prospective study
14 (8/6) 50 (25–79) acute leukemia (14–NR) NR
Brett et al 201318
Australia Retrospective study
57 (30/27) NR Heart and Lung
Transplantation
(30–135) NR
Ceesay et al 201619
UK prospective
study
53 (33/20) 52 (23–68) hematological
malignancies
NR NR
cSchmitt et al 200154
France prospective study
17 (10/7 ) — Hematologic
Malignancy (71)
NR NR
Kanda et al 199855
Japan prospective study
18 NR hematological
malignancies
NR NR
Glasmacher et al 199924
Germany Retrospective
study
150 54 (41–64) hematological
malignancies
21 NR
Simon et al 200756
Germany prospective
study
39 (20/19) 6.4 (0.7–11,5) hematological malignancies
27 (6–246) NR
Marr et al 200457
USA prospective
study
151 (75/76) NR allogeneic stem
cell transplants
89 708
Boogaerts et al 200158
Belgium prospective study
17 (9/8) 41 (19–60) Hematologic Malignancy
21 NR
Infection and Drug Resistance downloaded from https://www.dovepress.com/ by 118.70.13.36 on 22-Aug-2020
Dovepress Zhang et al
Ten studies used serum samples,16,20,24,30,52,57,60–62,64 while the other 15 used plasma samples.17,18,20,22,23,46–49,51,55,56,58,59,63 The remainder did not report whether serum or plasma sample was used. All the included studies measured itraconazole concentrations by HPLC.
Evaluation of efficacy
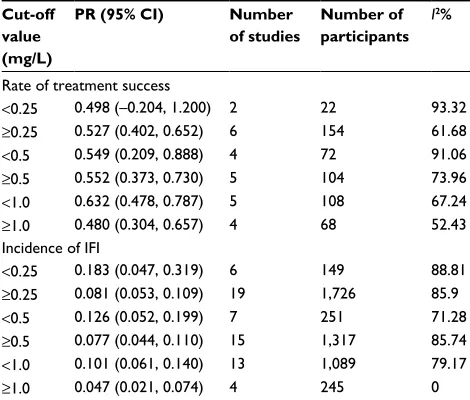
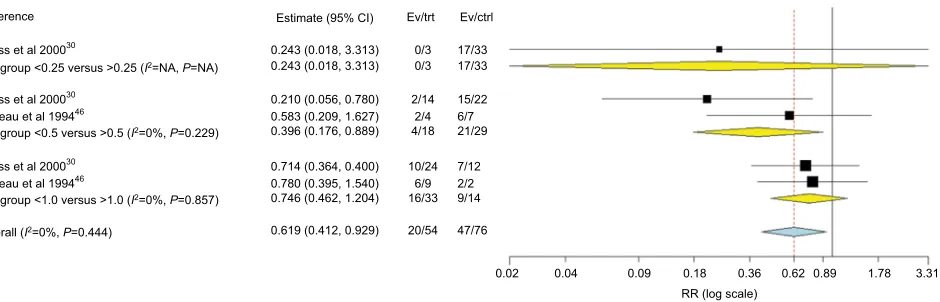
Table 2 displays a summary of outcomes for each study, and Tables 3–7 exhibit summaries of meta-analysis and subgroup analysis and sensitivity analysis for efficacy. Figures 2 and 3 and Figures S1–S10 show forest plots.
Our meta-analysis demonstrated there were no significant differences at all cut-off values for efficacy (without control arm) (Table 3). In comparing efficacy, including studies with control arm, we found a significant difference at the cut-off
level of 0.25 mg/L for incidence of IFI (RR =3.279, 95% CI
1.73–6.206) (Table 4 and Figure 2). For treatment success, our meta-analysis based on two studies, showed that the success rate decreased at a cut-off level of 0.5 mg/L (RR
=0.396, 95% CI 0.176–0.889) (Table 4, Figure 3). Only one
study contributed data for IFI-related mortality so we were
unable to pool the data.60
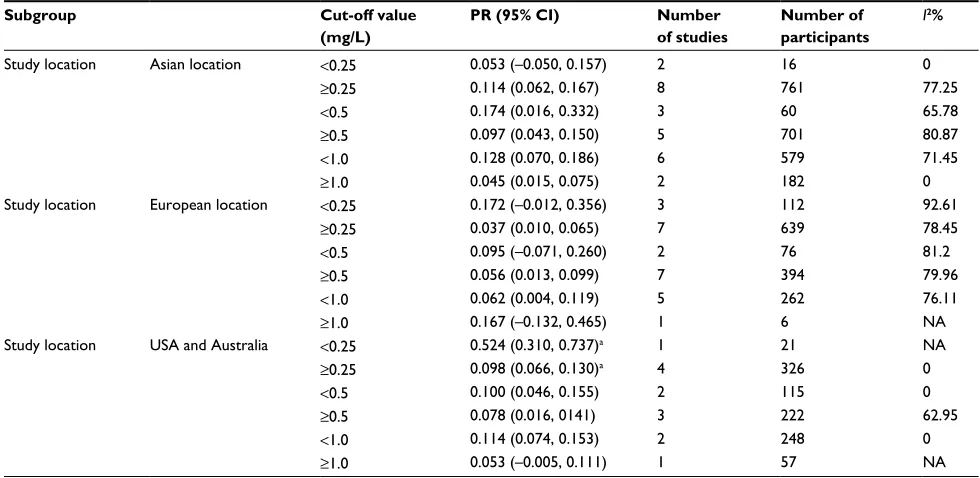
Subgroup analysis showed that the rate of prophylaxis failure significantly increased at a cut-off level of <0.25 mg/L
in USA + Australia subgroup patients (PR =0.524, 95% CI
0.310–0.737) compared with other concentration regimens. There were no significant differences at other cut-off levels (Tables 5–7).
Sensitivity analysis
We identified moderate to considerable inter-study heterogeneity during some of the meta-analyses, so we used a random-effects
model when I2≥50% and the source of heterogeneity assessed
in subgroup analysis according to combination therapy and study location (Tables 5–7). The heterogeneity we observed may also be due to diseases, itraconazole dose, sample size, age, and/or the criteria used for assessment – these factors led us to also conduct sensitivity analysis. The trial by Caillot et al in 2001 with relatively small sample size or including complete and partial responders for outcome was omitted and analyzed again to test the stability of the final pooled results.51 The results showed that, in ≥0.25 mg/L and ≥1.0 mg/L, I2 was significantly decreased to less than 50%. When we removed another study with relatively small sample size or proven
and possible IFI, there was a decline to less than 50% of I2
in <0.5 mg/L range group.63 Though I2 decreased, the 95%
CI did not change significantly, demonstrating that the meta-analysis results were robust. Sensitivity meta-analysis results were summarized in Tables S1 and S2.
Evaluation of safety
Due to different reported safety outcomes and variable definitions of hepatotoxicity, we could not pool the data to perform a meta-analysis. In general, itraconazole was well tolerated in most patients.
Regarding treatment, Miller66 reported that two of 13
patients with itraconazole Ctrough <0.25 mg/L had adverse
Table 1 (Continued)
Itraconazole used for prophylaxis First
author year
Country Study design
Sample size (male/female)
Age (y) Main Disease %
Duration (d)
Follow-up (d)
Winston et al 200259
USA prospective
study
97 (51/46) 53 (24–72) liver transplant 70 1y
Glasmacher et al 199860
Germany Retrospective
study
47 (27/20) 57.0 (19–84 ) Acute leukaemia
NR NR
dLin et al 201461
China prospective study
121 (76/45) — Allogeneic
HSCT
— 180 (8–180)
Kim et al 201420
South Korea prospective
study
181 (98/83) 54 (20–83) hematological malignancies
14 NR
Lindsay et al 201762
Australia prospective cohort study
57 (36/21) mean51.8
(18–76)
HSCT (81 ) — —
Liu et al 201564
China prospective study
35 (21/14) 37 (14–64 ) Hemopathy (NR-180) NR
Toubai et al 200563
Japan prospective study
37 (21/16) 46 (16–77 ) hematological
malignancies
— —
Liu et al 201364
China prospective study
112 (68/44) 37 (18–64) acute myeloid
leukemia
NR NR
Notes: NR, not reported; HSCT, hematopoietic stem cell transplantation. aage was represented as median (interquartile range) or mean±SD. bContinuous treatment with
itraconazole 200 mg once daily for 3 months were considered for this articl. cTen patients in group 1 (aged 1.7 to 4.9 years; median, 1 year); and seven in group 2 (aged 6.2
to 14.3 years; median, 10 years). dThe median age was 27.70 (12.2–52.9) years in the long-term arm and 23.60 (12.5–55.6) years in the short-term arm. The median duration
of administration was 90 days (range, 4–96 days) in the long-term arm and 32 days (range, 9–35 days) in the short-term arm.
Infection and Drug Resistance downloaded from https://www.dovepress.com/ by 118.70.13.36 on 22-Aug-2020
Dovepress Relationship of itraconazole trough concentration with efficacy and safety
Table 2 Outcomes and results of included studies
Itraconazole used for treatment First author year Type of
Ctrough
Cut-off value Reported outcome Definition of treatment success
Cross et al 200030 initial all treatment success mycologically cured patients and non-cured
patients Lebeau et al 199446 mean 0.5,1.0 treatment success
liver function disorders
respond to therapy (recovery or improvement)
Havu et al 199947 mean ≥0.25, <0.5, <1.0 treatment success responders and non-responders Matsumoto et al
199948
mean <0.25, <0.5,>1.0 treatment success adverse events significant improvement and improvement
Caillot 200349 mean ≥0.25, ≥0.5, <1.0 treatment success adverse events complete or partial response Yoshida et al 201250 mean ≥0.25, ≥0.5, ≥1.0 treatment success liver dysfunction and
other adverse events
Improvement (response)
Caillot et al 200151 median ≥0.25, ≥0.5, ≥1.0 treatment success adverse events
complete or partial response
Itraconazole used for prophylaxis First author year Type of
Ctrough
Cut-off value Reported outcome Definition of occurrence of IFI
Myoken et al 200216 mean 0.25 occurrence of IFI Positive cultures
Tricot et al 198723 mean 0.25 occurrence of IFI Positive cultures
Boogaerts et al 198922 mean 0.25 Incidence of proven and suspected IFI Positive cultures Morgenstern et al
199952
mean 0.25,0.5 proven fungal infections clinical/radiological and mycological evidence,
positive cultures Harousseau et al
200017
mean 0.25 occurrence of IFI
adverse events
positive cultures
Kageyama et al 199953 initial all occurrence of IFI NR
Brett et al 201318 initial 0.5 breakthrough IFI EORTC/MSG, positive cultures
Ceesay et al 201619 median 0.5 occurrence of IFI EORTC/MSG, proven and probable IFI
cSchmitt et al 200154 mean 1.0 occurrence of IFI NR
Kanda et al 199855 mean ≥0.25, <0.5, <1.0 pulmonary aspergillus infection diagnosed by a computed tomography scan of
the chest and by the detection of aspergillus antigen.
Glasmacher et al 199924
initial ≥0.25, ≥0.5, <1.0 occurrence of IFI clinical or radiological signs of infection, positive culture, include proven or highly suspected invasive fungal infections
Simon et al 200756 mean ≥0.25, ≥0.5, <1.0 breakthrough IFI NR
Marr et al 200457 median ≥0.25, ≥0.5, <1.0 occurrence of IFI EORTC/MSG, proven and probable IFI Boogaerts et al 200158 mean ≥0.25, ≥0.5, <1.0 occurrence of IFI
abnormal AST/ALT value
NR
Winston et al 200259 mean ≥0.25, <0.5, <1.0 occurrence of IFI liver function disorders
EORTC/MSG, positive cultures, proven
Glasmacher et al 199860
median ≥0.25, ≥0.5, <1.0 IFI-related mortality
occurrence of IFI hepatotoxicity and other adverse events
proven invasive fungal infection
(1) Histological and/or microbiological proof (2) Radiological evidence and microbiological isolation of a fungus
dLin et al 201461 mean ≥0.25, ≥0.5, <1.0 Breakthrough IFI liver dysfunction and other adverse events
EORTC/MSG, Breakthrough IFI (proven, probable, and possible) .
Kim et al 201420 mean ≥0.25, ≥0.5, ≥1.0 Breakthrough IFI hepatotoxicity and other
adverse events
Breakthrough fungal infections, probable or proven
Lindsay et al 201762 mean ≥0.25, ≥0.5, ≥1.0 occurrence of IFI liver function disorders EORTC/MSG, Possible or probable IFI
Liu et al 201564 mean ≥0.25, ≥0.5, <1.0 occurrence of IFI elevated
aminotransferase value
NR
Toubai et al 200563 mean ≥0.25, ≥0.5, <1.0 occurrence of IFI adverse events clinical symptoms and positive cultures (proven
and possible)
Liu et al 201364 mean ≥0.25, ≥0.5, <1.0 occurrence of IFI adverse events confirmed diagnosis, clinical diagnosis, suspected diagnosis
Abbrevations: Ctrough, trough concentration; NR, not reported; EORTC-MSG, European Organization for Research and Treatment of Cancer/Invasive Fungal Infections
Cooperative Group and the National Institute of Allergy and Infectious Diseases Mycoses Study Group.
Infection and Drug Resistance downloaded from https://www.dovepress.com/ by 118.70.13.36 on 22-Aug-2020
Dovepress Zhang et al
events grade 3 or 4 related to study treatment. Matsumoto
et al48 found patients with C
trough <0.25 mg/L experienced
mild diarrhea (one case), mild drug eruption (one case), and
abnormal GOT and GPT (one case). Lebeau et al46 reported
that two patients presented with liver function disorders with concentration 0.25–0.5 mg/L and 0.5–1.0 mg/L, respectively.
Nine patients (43%) with Ctrough 0.5–1.0 mg/L experienced
severe adverse events in Caillot’s study.49 Among these nine
cases, there was only one severe reaction definitely related to itraconazole treatment. In a study including a concentration more than 1.0 mg/L, researchers observed adverse events such as liver dysfunction in four patients and heart failure in five of a total of 24 patients in Yoshida et al’s study.50 In another
trial,51 only two events were considered definitely related
to the treatment: rash in one patient and rigors during drug administration in another. Thirteen patients (42%) experienced
adverse events possibly related to treatment. Together, these numbers are substantial in terms of adverse events results.
Regarding prophylaxis, of 97 patients on itraconazole
with Ctrough 0.25–0.5 mg/L, three patients had abnormal
liver function tests possibly related to itraconazole, but no patients were removed from the study because of concerns about hepatotoxicity from itraconazole according to Winston
and Busuttil.59 In addition, we discovered from Toubai et al’s
study,63 that there were no other obvious side effects caused by
prophylactic itraconazole administration. For Ctrough 0.5–1.0
mg/L, Boogaerts et al58 reported three cases of abnormal rise
in AST/ALT levels in 17 patients. Serious adverse events were
reported in 26 (9%) patients in Harousseau et al’s study.17
Glasmacher et al,60 in their study, claimed that there were
no severe adverse effects (necessitating an interruption of prophylaxis) clearly attributable to itraconazole, especially
no severe hepatotoxicity events. Lin et al’s study61 showed
that drug-related adverse events occurred in 19 (15.7%) of the patients involved, including 15 with gastrointestinal disorders (12.4%), two with abnormal liver function (1.65%), one with hypokalemia (1/121), and one with hydrothorax (0.8%). In Liu’s study there were 16 patients who withdrew from the study due to adverse reactions, including three
cases of elevated aminotransferase.65 Adverse events were
observed in as many as 42 patients (14.1%) in Liu et al’s study (transaminase elevation in two patients, drug withdrawal
in 16, heart dysfunction in one).64 For C
trough≥1.0 mg/L, in
Lindsay et al’s research, there were eleven mild derangements of liver function tests and two moderate raised bilirubin in
57 patients.62 Meanwhile, Kim et al’s study20 showed adverse
events in 67 patients (32.8 %); specifically, hepatotoxicity
(n=39, 19.1 %) and nephrotoxicity (n=8, 3.9 %) were
common in this study and seven patients discontinued itraconazole therapy due to toxicity.
Table 3 Summary of meta-analysis for efficacy (without control
arm)
Cut-off value (mg/L)
PR (95% CI) Number of studies
Number of participants
I2%
Rate of treatment success
<0.25 0.498 (–0.204, 1.200) 2 22 93.32 ≥0.25 0.527 (0.402, 0.652) 6 154 61.68 <0.5 0.549 (0.209, 0.888) 4 72 91.06
≥0.5 0.552 (0.373, 0.730) 5 104 73.96
<1.0 0.632 (0.478, 0.787) 5 108 67.24
≥1.0 0.480 (0.304, 0.657) 4 68 52.43
Incidence of IFI
<0.25 0.183 (0.047, 0.319) 6 149 88.81 ≥0.25 0.081 (0.053, 0.109) 19 1,726 85.9 <0.5 0.126 (0.052, 0.199) 7 251 71.28
≥0.5 0.077 (0.044, 0.110) 15 1,317 85.74
<1.0 0.101 (0.061, 0.140) 13 1,089 79.17
≥1.0 0.047 (0.021, 0.074) 4 245 0
Abbreviations: CI, confidence interval; IFI, invasive fungal infection
Table 4 Summary of meta-analysis for efficacy (with control arm)
Cut-off value (mg/L) RR (95% CI) Number of studies
Number of participants in experimental group
Number of participants in control group
I2%
Rate of treatment success
<0.25 vs ≥0.25 0.243 (0.018, 3.313) 1 3 33 NA
<0.5 vs ≥0.5 0.396 (0.176, 0.889)a 2 18 29 0
<1.0 vs ≥1.0 0.746 (0.462, 1.204) 2 33 14 0
Incidence of IFI
<0.25 vs ≥0.25 3.279 (1.732, 6.206)a 6 149 419 0
<0.5 vs ≥0.5 1.214 (0.485, 3.306) 4 101 145 0
<1.0 vs ≥1.0 0.203 (0.026, 2.034) 2 20 7 0
Note: aStatistically significant difference.
Abbreviations: CI, confidence interval; IFI, invasive fungal infection; NA, not applicable.
Infection and Drug Resistance downloaded from https://www.dovepress.com/ by 118.70.13.36 on 22-Aug-2020
Dovepress Relationship of itraconazole trough concentration with efficacy and safety
Table 5 Summary of subgroup analysis for treatment success (without control arm)
Subgroup Cut-off value
(mg/L)
PR (95% CI) Number of studies
Number of participants
I2%
Combination therapy
Yes <0.25 NA NA NA NA
≥0.25 0.605 (0.439, 0.770) 2 32 0
<0.5 0.500 (0.010, 0.990) 1 4 NA
≥0.5 0.682 (0.356, 1.008) 2 28 73.57
<1.0 0.570 (0.395, 0.746) 2 30 0
≥1.0 0.833 (0.412, 1.255) 1 2 NA
Combination therapy
No <0.25 0.498 (–0.204, 1.200) 2 22 93.32
≥0.25 0.493 (0.332, 0.653) 4 122 71.41
<0.5 0.559 (0.166, 0.952) 3 68 94.02
≥0.5 0.476 (0.264, 0.688) 3 76 74.12
<1.0 0.654 (0.427, 0.881) 3 78 81.13
≥1.0 0.414 (0.277, 0.550) 3 66 23.57
Study location Asian
location <0.25
0.842 (0.678, 1.006) 1 19 NA
≥0.25 0.435 (0.232, 0.637) 1 23 NA
<0.5 0.842 (0.678, 1.006) 1 19 NA
≥0.5 0.435 (0.232, 0.637) 1 23 NA
<1.0 0.842 (0.678, 1.006) 1 19 NA
≥1.0 0.435 (0.232, 0.637) 1 23 NA
Study location Non-Asian
location <0.25
0.125 (–0.199, 0.449) 1 3 NA
≥0.25 0.546 (0.339, 0.692) 5 131 67.21
<0.5 0.438 (0.023, 0.854) 3 53 89.9
≥0.5 0.584 (0.359, 0.809) 4 81 79.33
<1.0 0.572 (0.437, 0.706) 4 89 40.23
≥1.0 0.531 (0.249, 0.812) 3 45 68.29
Abbreviations: CI, confidence interval; NA, .
Table 6 Summary of subgroup analysis for prophylaxis failure (without control arm)
Subgroup Cut-off value
(mg/L)
PR (95% CI) Number of studies
Number of participants
I2%
Study location Asian location <0.25 0.053 (–0.050, 0.157) 2 16 0
≥0.25 0.114 (0.062, 0.167) 8 761 77.25
<0.5 0.174 (0.016, 0.332) 3 60 65.78
≥0.5 0.097 (0.043, 0.150) 5 701 80.87
<1.0 0.128 (0.070, 0.186) 6 579 71.45
≥1.0 0.045 (0.015, 0.075) 2 182 0
Study location European location <0.25 0.172 (–0.012, 0.356) 3 112 92.61
≥0.25 0.037 (0.010, 0.065) 7 639 78.45
<0.5 0.095 (–0.071, 0.260) 2 76 81.2
≥0.5 0.056 (0.013, 0.099) 7 394 79.96
<1.0 0.062 (0.004, 0.119) 5 262 76.11
≥1.0 0.167 (–0.132, 0.465) 1 6 NA
Study location USA and Australia <0.25 0.524 (0.310, 0.737)a 1 21 NA
≥0.25 0.098 (0.066, 0.130)a 4 326 0
<0.5 0.100 (0.046, 0.155) 2 115 0
≥0.5 0.078 (0.016, 0141) 3 222 62.95
<1.0 0.114 (0.074, 0.153) 2 248 0
≥1.0 0.053 (–0.005, 0.111) 1 57 NA
Note: aThere is significant difference in <0.25 vs other concentration groups in USA and Australia group.
Abbreviations: CI, confidence interval; NA, .
Infection and Drug Resistance downloaded from https://www.dovepress.com/ by 118.70.13.36 on 22-Aug-2020
Dovepress Zhang et al
Considering the myriad and prevalence of adverse effects in all these studies, an itraconazole trough level of 1.0 mg/L is associated with increased hepatotoxicity and other adverse events.
Evaluation when using the bioassay
method
Due to the variation in measurements of blood itracon-azole using bioassay (measures both itraconitracon-azole and hydroxy-itraconazole) vs HPLC (which measures itracon-azole separately), it seems that concentrations measured by bioassay are 5-fold higher compared with HPLC/mass
spectrometry.67 Few studies have incorporated bioassay, so we
excluded these studies from our meta-analysis. Accordingly, we have not identified any recommendations on itraconazole trough level measured by bioassay.
For treatment, Tucker et al68 reported a trough concentration
of 6.5±4.2 mg/L in 28 responders and 4.0±3.2 mg/L in eleven
non-responders. Another, Sharkey et al’s study, noted no elevations in hepatic enzyme values compared to baseline values in eight patients where two were <2 mg/L and the other six were >5 mg/L.27 Galgiani et al69 found 61 responded to itraconazole treatment in 97 patients with 6–8 mg/L and two adverse events could have been caused by itraconazole including
Table 7 Summary of subgroup analysis for prophylaxis failure (with control arm)
Cut-off value (mg/L)
Subgroup RR (95% CI) Number of
studies
Number of participants in experimental group
Number of participants in control group
I2%
<0.25 vs ≥0.25 Study location Asian location 1.252 (0.086, 18.259) 2 12 16 0
European location 0.225 (0.092, 0.549) 3 386 112 0
USA 0.364 (0.138, 0.961) 1 212 21 NA
<0.5 vs ≥0.5 Study location Asian location 0.750 (0.017, 32.676) 1 7 5 NA
European location 1.046 (0.385, 2.845) 2 76 126 0
Australia 5.526 (0.309, 98.923) 1 18 14 NA
Abbreviations: CI, confidence interval; NA, not applicable.
Figure 2 Meta-analysis for prophylaxis failure rate (trough concentration of <0.25 mg/L comparison with ≥0.25 mg/L, RR <1 favors Ctrough<0.25 mg/L).
Abbreviations: CI, confidence interval; ctrl, control group; Ev, events; trt, treatment group. Reference
0/10 11/21 16/31 1/24 2/57
30/149 0/6
0.01 0.03 0.07 0.14 0.28 0.71 0.42 2.84 7.09 14.18 28.37 70.92141.84 283.68 0/6
4/21 3/37 0/125 5/224
12/419
RR (log scale) 0/6
Estimate (95% CI) Ev/trt Ev/ctrl
Myoken (2002)16 0.636 (0.014, 28.551) 2.750 (1.041, 7.265) 6.366 (2.042, 19.845) 15.120 (0.634, 360.585)
3.279 (1.732, 6.206) 1.572 (0.313, 7.894) 1.000 (0.023, 43.700) Tricot (1987)23
Boogaerts (1989)22 Morgenstern (1999)52 Harousseau (2000)17 Kageyama (1999)53
Overall (I2=0%, P=0.519)
Figure 3 Meta-analysis for treatment success rate (trough concentration < cut-off value comparison with ≥ cut-off value, RR <1 favors ≥ cut-off value).
Abbreviations: CI, confidence interval; ctrl, control group; Ev, events; trt, treatment group. Reference Estimate (95% CI) Ev/trt Ev/ctrl
0/3 17/33 17/33 0/3
2/14 15/22 6/7 21/29
7/12 2/2 9/14
47/76
RR (log scale)
0.02 0.04 0.09 0.18 0.36 0.62 0.89 1.78 3.31 2/4
4/18
10/24 6/9 16/33
20/54 0.243 (0.018, 3.313) 0.243 (0.018, 3.313)
0.210 (0.056, 0.780) 0.583 (0.209, 1.627) 0.396 (0.176, 0.889)
0.714 (0.364, 0.400) 0.780 (0.395, 1.540) 0.746 (0.462, 1.204)
0.619 (0.412, 0.929) Cross et al 200030
Cross et al 200030
Lebeau et al 199446
Subgroup <0.25 versus >0.25 (I2=NA, P=NA)
Subgroup <0.5 versus >0.5 (I2=0%, P=0.229)
Cross et al 200030
Lebeau et al 199446
Subgroup <1.0 versus >1.0 (I2=0%, P=0.857)
Overall (I2=0%, P=0.444)
Infection and Drug Resistance downloaded from https://www.dovepress.com/ by 118.70.13.36 on 22-Aug-2020
Dovepress Relationship of itraconazole trough concentration with efficacy and safety
one case of elevated liver enzyme levels and one hypokalemia cased. Denning et al’s study25determined that trough levels <2.5 mg/L in three responders and one non-responder, 2.5–5 mg/L in two responders and one non-responder, 5–10 mg/L in two responders; and finally >10 mg/L in three responders.
For prophylaxis, according to Lestner et al’s study,32 at
Ctrough <17.1 mg/L, 47 (31%) patients developed
itraconazole-related toxicity; at Ctrough ≥17.1 mg/L, 55 (86%) patients
developed toxicity. Wheat et al70 reported that, in their
study, 39 of 42 patients with 6.8 mg/L achieved successful suppression, but 37 patients (88%) experienced grade 3 or 4 (severe or life-threatening) adverse events. One patient was removed from the trial entirely because of itraconazole. In addition, no patient receiving prophylaxis developed invasive aspergillosis and withdrew from the trial due to side effects, nor were toxicities attributed to rising cyclosporine levels associated with itraconazole (Patterson et al: 0.5 mg/L,
six patients; 3.5 mg/L, six patients).71 Denning’s study
also exhibited that patients with serum concentrations of 8 mg/L tended to have better clinical outcomes when using
itraconazole for primary treatment of invasive aspergillosis.72
Quality assessment
Using a 9-point scoring system, most studies we analyzed scored between 7 and 9. In a 6-point scoring system, most studies scored between 4 and 6. The result showed that most studies did well in sample selection and comparability but failed in outcome due to short or inadequate follow-ups. Assessment of study-specific quality scores from the New-castle–Ottawa Scale system is summarized in Table 8.
Discussion
As an antifungal agent, itraconazole has been widely used for the treatment of deep mycoses and prophylaxis of IFIs in patients with profound and prolonged neutropenia, bone marrow transplant recipients, solid organ transplant recipients, and other immunocompromised populations. Although many studies have analyzed itraconazole’s efficacy compared with other antifungal drugs, researchers, so far, have drawn no definitive conclusions on the optimum trough concentration for treatment. Itraconazole exhibits high inter- and intra-patient variability in the pharmacokinetic profile following oral and intravenous doses, so TDM is suggested
to optimize the efficacy and avoid toxicity.21 Considering the
lower power of individual observational studies and clinical needs, we conducted this systematic review and meta-analysis to provide a more reliable and explicit recommendation on the optimum trough concentration of itraconazole, with less random errors and more precise estimates.
To our knowledge, this is the first meta-analysis focusing on the relationship between itraconazole trough level and the efficacy/safety. After pooling available data from 29 included articles, the meta-analysis revealed that an itraconazole trough concentration of 0.25 mg/L is associated with successful prophylaxis of IFI. This conclusion differs from the 0.5–1.0 mg/L threshold that some publications have
suggested, likely due to their limited study subjects.73,74 We
conducted a subgroup analysis by study location, thereby demonstrating that the rate of prophylaxis failure significantly increased at a cut-off level of <0.25 mg/L in USA + Australia subgroup patients compared with other concentration regimens. However, subgroup analysis results of the Asia and Europe subgroup were different and insignificant, suggesting a possibility that the concentration–efficacy relationship follows a different profile among different ethnicities. We recognize that the study number was limited and sample size was small in our meta-analysis, therefore further studies are needed to verify the differences in different ethnicities.
Our meta-analysis also demonstrated that a target value of 0.5 mg/L increased treatment success. It is similar to the guideline which recommends itraconazole trough concentration of 0.5–1.0 mg/L as it pertains to treatment of
IFIs.21 We divided our subgroups into combination therapy
and study location. First, itraconazole inhibits CYP3A4, which leads to a number of clinically relevant drug–drug interactions. Combination therapy with amphotericin B or
other drugs may change the profile of drug exposure,14,75
which might explain why the combination therapy subgroup did not show significance at the 0.5 mg/L cut-off level. Second, each cut-off value of Asian location subgroup differed significantly. As there is only one study in every concentration group, we regard these subgroup analysis results as likely to be unreliable. Notably, the small number and size of included studies for treatment success limits the utility of this metric.30,46
During our meta-analysis, we observed heterogeneity in the results, some of which persisted even in subgroup analysis by combination therapy and study location. Never-theless, sensitivity analysis resulted in a dramatic decrease
in I2 through removing method (Table S1 and S2). These
results revealed that sample size and the criteria used for assessment could be the sources of heterogeneity. It is also possible that differences in disease, itraconazole dose, age and/or duration of disease or follow-up may be responsible for the heterogeneity we observed. Hence, future studies are needed to explore further causalities. However, though
I2 decreased, the 95% CI of each cut-off value only changed
insignificantly, indicating the robustness.
Infection and Drug Resistance downloaded from https://www.dovepress.com/ by 118.70.13.36 on 22-Aug-2020
Dovepress Zhang et al
There are too little study-contributed data for IFI-related mortality for us to have effectively pooled data in our review.60 The clinical outcomes and definitions of safety in studies were various, wherein some studies reported adverse events
grade 3 or 4,66 some reported liver function disorders with
different criteria,46,50 some reported adverse reactions related
to itraconazole treatment,51,60 and various trials reported the
adverse events and abnormal laboratory examination values
without consistent standards.17,48,58 Thus we could not combine
results to forge a comprehensive meta-analysis. Most patients treated with itraconazole are already immunocompromised and undergoing chemotherapy, which each involves conditions with many adverse effects. The relationship between treatment and adverse events remains unclear, and most guidelines indicate
an increased incidence of toxicity at higher itraconazole concentrations without explicitly recommending an optimum
trough concentration for safety.21,73 After reviewing many
studies, we offer 1.0 mg/L as the cut-off value that is associated with increased hepatotoxicity and other adverse events. To fully elucidate this issue, further studies are needed.
Our meta-analysis and review has the following strengths. First, it is the first to focus on the relationship of itraconazole trough concentration with efficacy and safety, providing certain reference significance to clinical practice. Second, our meta-analysis compared commonly used cut-off levels in a single analysis for individual cut-off levels. Finally, we included Japanese articles in this meta-analysis to maximize the reliability considering the prevalence of the research in Table 8 Quality of studies included in the meta-analysis
Study Newcastle–Ottawa Quality Assessment Scale (cohort study) Score
Selection Comparability Outcome
Q1 Q2 Q3 Q4 Q5 Q6 Q7 Q8
Studies with control
Cross et al 200030 ☆ ☆ ☆ ☆ ☆☆ ☆ – – 7
Lebeau et al 199446 ☆ ☆ ☆ ☆ ☆☆ ☆ ☆ ☆ 9
Myoken et al 200216 ☆ ☆ ☆ ☆ –– ☆ ☆ ☆ 7
Tricot et al 198723 ☆ ☆ ☆ ☆ ☆☆ ☆ – – 7
Boogaerts et al 198922 ☆ ☆ ☆ ☆ ☆– ☆ – – 6
Morgenstern et al 199952 ☆ ☆ ☆ ☆ ☆☆ ☆ ☆ ☆ 9
Harousseau et al 200017 ☆ ☆ ☆ ☆ ☆☆ ☆ – – 7
Kageyama et al 199953 ☆ ☆ ☆ ☆ ☆☆ ☆ – – 7
Brett et al 201318 ☆ ☆ ☆ ☆ ☆☆ ☆ – – 7
Ceesay et al 201619 ☆ ☆ ☆ ☆ ☆☆ ☆ – – 7
Schmitt et al 200154 ☆ ☆ ☆ ☆ ☆☆ ☆ – – 7
Studies without control
Havu et al 199947 ☆ / ☆ ☆ / ☆ ☆ ☆ 6
Matsumoto et al 199948 ☆ / ☆ ☆ / ☆ ☆ ☆ 6
Caillot 200349 ☆ / ☆ ☆ / ☆ ☆ ☆ 6
Yoshida et al 201250 ☆ / ☆ ☆ / ☆ ☆ ☆ 6
Caillot et al 200151 ☆ / ☆ ☆ / ☆ – – 4
Kanda et al 199855 ☆ / ☆ ☆ / ☆ – – 4
Glasmacher et al 199924 ☆ / ☆ ☆ / ☆ – – 4
Simon et al 200756 ☆ / ☆ ☆ / ☆ – – 4
Marr et al 200457 ☆ / ☆ ☆ / ☆ ☆ ☆ 6
Boogaerts et al 200158 ☆ / ☆ ☆ / ☆ – – 4
Winston et al 200259 ☆ / ☆ ☆ / ☆ ☆ ☆ 6
Glasmacher et al 199860 ☆ / ☆ ☆ / ☆ – – 4
Lin et al 201461 ☆ / ☆ ☆ / ☆ ☆ ☆ 6
Kim et al 201420 ☆ / ☆ ☆ / ☆ – – 4
Lindsay et al 201762 ☆ / ☆ ☆ / ☆ ☆ ☆ 6
Liu et al 201564 ☆ / ☆ ☆ / ☆ – – 4
Toubai et al 200563 ☆ / ☆ ☆ / ☆ ☆ ☆ 6
Liu et al 201364 ☆ / ☆ ☆ / ☆ – – 4
Notes: The data is presented using the Newcastle-Ottawa Quality Assessment Scale, ‘’☆’’, represents the score; “–” the item(question) has no score; “/”, not applicable.
Q1: the exposed cohort was truly or somewhat representative? Q2: the non-exposed cohort was drawn from the same community as the exposed cohort? Q3: exposure was ascertained by secure record or structured interview? Q4: outcome of interest was not present at start of study? Q5: on the basis of the design or analysis, cohorts had comparability? (controls for the most important factor? controls for any additional factor?) Q6: outcome was independent blind assessment or record linkage? Q7: follow-up was long enough for outcomes to occur? Q8: follow-up of cohorts was adequate? A study can be awarded a maximum of one star for each numbered item within the selection and outcome categories. A maximum of two stars can be given for comparability.
Abbreviation: Q, question.
Infection and Drug Resistance downloaded from https://www.dovepress.com/ by 118.70.13.36 on 22-Aug-2020
Dovepress Relationship of itraconazole trough concentration with efficacy and safety
Japan, while most English language reviews have not done this until now.
We acknowledge the following limitations to our work. First, the number of studies and sample sizes were relatively small, leading to potentially insufficient power to detect mild differences. Second, we were unable to perform subgroup analysis for the pediatric population because we only identified two studies designed for children. Besides, we could not analyze the influences of different pathogen and infection locations on the results. Third, the use of observational studies in a meta-analysis is prone to biases and confounding factors inherent in the original studies. Finally, although our subgroup analysis and sensitivity analyses explained some heterogeneity in the results, there is a clear need for further study.
Conclusion
In conclusion, our meta-analysis of published studies dem-onstrates that 0.25 mg/L is the lower threshold of the target itraconazole trough concentration during prophylaxis of fun-gal infections. Additionally, the target 0.5 mg/L is the lower limit for successful treatment. We have deduced that a trough level of 1.0 mg/L is associated with substantially increased hepatotoxicity and other adverse events (using HPLC).
Acknowledgment
This work was supported by the National Science and Technology Major Project “Creation of major new drugs” (number 2017ZX09304029).
Disclosure
The authors report no conflicts of interest in this work.
References
1. Chamilos G, Luna M, Lewis RE, et al. Invasive fungal infections in patients with hematologic malignancies in a tertiary care cancer center: an autopsy study over a 15-year period (1989-2003). Haematologica. 2006;91(7):986–989.
2. Slobbe L, Polinder S, Doorduijn JK, et al. Outcome and medical costs of patients with invasive aspergillosis and acute myelogenous leukemia-myelodysplastic syndrome treated with intensive chemotherapy: an observational study. Clin Infect Dis. 2008;47(12):1507–1512. 3. Neofytos D, Horn D, Anaissie E, et al. Epidemiology and outcome of
invasive fungal infection in adult hematopoietic stem cell transplant recipients: analysis of Multicenter Prospective Antifungal Therapy (PATH) Alliance registry. Clin Infect Dis. 2009;48(3):265–273. 4. Slain D, Rogers PD, Cleary JD, Chapman SW. Intravenous itraconazole.
Ann Pharmacother. 2001;35(6):720–729.
5. Ullmann AJ, Akova M, Herbrecht R, et al. ESCMID* guideline for the diagnosis and management of Candida diseases 2012: adults with haematological malignancies and after haematopoietic stem cell transplantation (HCT). Clin Microbiol Infect. 2012;18 Suppl 7:53–67. 6. Lortholary O, Petrikkos G, Akova M, et al. ESCMID* guideline for the diagnosis and management of Candida diseases 2012: patients with HIV infection or AIDS. Clin Microbiol Infect. 2012;18 Suppl 7:68–77.
7. Hope WW, Castagnola E, Groll AH, et al. ESCMID* guideline for the diagnosis and management of Candida diseases 2012: prevention and management of invasive infections in neonates and children caused by Candida spp. Clin Microbiol Infect. 2012;18 Suppl 7:38–52. 8. Walsh TJ, Anaissie EJ, Denning DW, et al. Treatment of aspergillosis:
clinical practice guidelines of the Infectious Diseases Society of America. Clin Infect Dis. 2008;46(3):327–360.
9. Limper AH, Knox KS, Sarosi GA, et al. An official American Thoracic Society statement: Treatment of fungal infections in adult pulmonary and critical care patients. Am J Respir Crit Care Med. 2011;183(1): 96–128.
10. Pappas PG, Kauffman CA, Andes DR, et al. Clinical Practice Guideline for the Management of Candidiasis: 2016 Update by the Infectious Diseases Society of America. Clin Infect Dis. 2016;62(4):409–417. 11. Patterson TF, Thompson GR, Denning DW, et al. Practice Guidelines
for the Diagnosis and Management of Aspergillosis: 2016 Update by the Infectious Diseases Society of America. Clin Infect Dis. 2016;63(4):e1–e60.
12. Maertens J, Marchetti O, Herbrecht R, et al. European guidelines for antifungal management in leukemia and hematopoietic stem cell trans-plant recipients: summary of the ECIL 3--2009 update. Bone Marrow Transplant. 2011;46(5):709–718.
13. Allegra S, Fatiguso G, de Francia S, et al. Pharmacokinetic evaluation of oral itraconazole for antifungal prophylaxis in children. Clin Exp Pharmacol Physiol. 2017;44(11):1083–1088.
14. Morgan J, Wannemuehler KA, Marr KA, et al. Incidence of invasive aspergillosis following hematopoietic stem cell and solid organ trans-plantation: interim results of a prospective multicenter surveillance program. Med Mycol. 2005;43 Suppl 1:49–58.
15. Yamagishi Y, Hamada Y, Hagihara M, Mikamo H. Population phar-macokinetics of itraconazole in Japanese patients with invasive fungal peritonitis. Jpn J Antibiot. 2013;66(3):159–168.
16. Myoken Y, Sugata T, Kyo T, Fujihara M, Mikami Y. Itraconazole pro-phylaxis for invasive gingival aspergillosis in neutropenic patients with acute leukemia. J Periodontol. 2002;73(1):33–38.
17. Harousseau JL, Dekker AW, Stamatoullas-Bastard A, et al. Itraconazole oral solution for primary prophylaxis of fungal infections in patients with hematological malignancy and profound neutropenia: a randomized, double-blind, double-placebo, multicenter trial comparing itraconazole and amphotericin B. Antimicrob Agents Chemother. 2000;44(7):1887–1893. 18. Brett J, Chong O, Graham GG, et al. Antifungal use and therapeutic
monitoring of plasma concentrations of itraconazole in heart and lung transplantation patients. Ther Drug Monit. 2013;35(1):133–136. 19. Ceesay MM, Couchman L, Smith M, Wade J, Flanagan RJ, Pagliuca
A. Triazole antifungals used for prophylaxis and treatment of invasive fungal disease in adult haematology patients: Trough serum concentra-tions in relation to outcome. Med Mycol. 2016;54(7):691–698. 20. Kim JS, Cheong JW, Kim YK, et al. The relationship between the success
rate of empirical antifungal therapy with intravenous itraconazole and clinical parameters, including plasma levels of itraconazole, in immunocompromised patients receiving itraconazole oral solution as prophylaxis: a multicenter, prospective, open-label, observational study in Korea. Ann Hematol. 2014;93(1):33–42.
21. Ashbee HR, Barnes RA, Johnson EM, Richardson MD, Gorton R, Hope WW. Therapeutic drug monitoring (TDM) of antifungal agents: guidelines from the British Society for Medical Mycology. J Antimicrob Chemother. 2014;69(5):1162–1176.
22. Boogaerts MA, Verhoef GE, Zachee P, Demuynck H, Verbist L, de Beule K. Antifungal prophylaxis with itraconazole in prolonged neutropenia: correlation with plasma levels. Mycoses. 1989;32 Suppl 1:103–108. 23. Tricot G, Joosten E, Boogaerts MA, Vande Pitte J, Cauwenbergh G.
Ketoconazole vs. itraconazole for antifungal prophylaxis in patients with severe granulocytopenia: preliminary results of two nonrandomized studies. Rev Infect Dis. 1987;9 Suppl 1:S94–99.
24. Glasmacher A, Hahn C, Leutner C, et al. Breakthrough invasive fungal infections in neutropenic patients after prophylaxis with itraconazole. Mycoses. 1999;42(7-8):443–451.
Infection and Drug Resistance downloaded from https://www.dovepress.com/ by 118.70.13.36 on 22-Aug-2020