Implementation and Performance evaluation of Better Accuracy And
Risk Handling In Cost Estimation Using Assessment Values
Renu Goswami
1
, Ajay Kumar Sharma
2
M.Tech Scholar1, Associate Professor2Geetanjali Institute of Technical Studies, Udaipur, Rajasthan
Abstract—Among its various process of software development, cost estimation financial decisions with their usages for the featured development. Primary goal is towards getting the accuracy and optimality in estimation. Our work[15] is dealing with study of various cost models along with the well known Constructive Cost Model. There are several different models available for the estimation of software project. One of the most popular cost estimation models is COCOMO. In intermediate COCOMO, software estimation is done based on scaling of fifteen cost drivers from very low to extra high.
Our work[15] formulated the factor using estimated monetary value (EAV) for considering the impact of risk in cost estimation as a quantitative approach. The EAV process is concerned with analyzing, identifying and responding to particular risks in its overall lifecycle. It actually applies the tolerance limits along with the uncertainties to the prior estimation. Here in this paper we are trying to give the implementation details of the work[15] along with evaluation of the performance on the basis of the statistics noted when different projects with different KLOC was tested.
Keywords— Software Engineering, Cost Estimation, COCOMO, Risk Assessment, Estimated Assessment Value (EAV),Result Evaluation, Implementation;
I. INTRODUCTION
As the software firms needs a concrete policy to decide the cost of the software product. Cost estimation needs to be accurate enough and should also meet the company expenditure demand as well as customer requirements. As we have already proposed a novel assessment value based methodology for software cost estimation in our work[15], in this work we are trying to analyse the proposed method on various performance factors. We are trying to evaluate the performance of the proposed work[15].
s
oftware development lifecycle is one of the important models applied for getting the quality development ofsoftware’s.It includes the various process used to measure the resources, development time, requirements analysis, project evaluation and scheduling, cost calculation etc. Among them the cost estimation is the indirect measure for predicting the cost of the project. Such estimation depends upon the environment and the other derivative which affects the cost of product or project. Product having some previous knowledge about their features is easy to predict with their cost but for additional efforts cost needs to be added into it[15].
The existing estimation models serve the purpose of managing the tradeoffs between the client and the developer. A firm needs to analyse the things in earlier phases that what is easily deliverable to the client at affordable prices [1]. Thus to design effective and efficient cost estimation models some of the enlisted points are:
x Identifies the critical cost drivers
x Apply the proper scaling factor required for variations in the cost drivers.
x Correlate the project with the previously developed
features and codes
x Evaluate the problems and cost derivatives which raise the costs
x Apply the budget constraints and their impact towards development and organization policies
x Incorporate the critical features in an iterative manner.
While designing the new cost model, critical analysis should be performed based on the features. These impact analysis will be able to predict the financial burdensome on the client and their respective market. Traditionally the COCOMO model is totally based on the cost derivers which were extended later with the number of attributes and size of the project. Among all the drivers the most important measure is its size units into Kilo lines of code (KLOC). A function point (FP) is one of the well known empirical measurement model for size prediction. This model might get affected with the size, development environment and the complexity of the complete project or product. Some of the dependent quantifiable entities of FP estimation for size are[15]:
x No. of Inputs x No. of Outputs x No. of Enquires x No. of Files x No. of Interfaces
Constructive Cost Model (COCOMO)
Barry W Boehm in 1981[2] developed a effective model named as Constructive Cost model. It is an algorithmic cost model. Algorithmic cost model is developed based on relating the current project to previous projects. It is based on historical information [3]. Cocomo is based on size of the project. The size of the project may vary depending upon the function points. Types of COCOMO Models[15]:
Intermediate COCOMO
x It is used for medium sized projects.
x The cost drivers are intermediate to basic and advanced
Cocomo.
x Cost drivers depend upon product reliability, database size, execution and storage.[2]
COCOMO II
In way to achieve better accuracy towards estimation of the resources the extended model of COCOMO II is suggested in 1995. It overcomes the cost calculation problems associated with the no sequential rapid developments. Mainly the model is parted into three major areas[15]:
x Application composition is used for projects having rapid development requirements and richness with GUI interfaces.
x Early design phase is applied to get an overview of the
design pictures and done by considering the architectural perspectives.
x Post architectural designing is used to validate the given design on the users constructs.
In COCOMO II the constant value b is replaced by 5 scale factors. [5]
Effort (E) is calculated as follows
E = a * (KDSI) sf * π (EM)
Where a is constant, sf is scaling factor, EM is Effort
Multiplier (7 for Early design, 17 for Post architecture).
II. RESEARCH MOTIVATION
Project development starts with considering all the factors discussed at the time of requirement gathering. Later on the systematic SDLC process is formally applied for undergoing development task. Initially the lifecycle architecture is prepared to have accurate information on the cost driver inputs. Primary COCOMO was not able to cover the post architectural elements of the projects which were later on extended with COCOMO-II. This model considers the current hypothesis about the most effective and dynamic attributes of development stages based on subsequent data
analysis. This analysis deals with the relationships of point’s
objects, function points and the line of codes. The same process is applicable for the various languages and composition systems, enabling flexibility in the choice of sizing parameters[15].
The data analysis involves the dynamic handling of various attributes which is suggested only by the COCOMO II like reliability, granularity, reusability, quality, schedule constraints, risk, overruns, resource management, change handling etc. This model presents a broader view of prior and posterior factors which affects the estimation[15].
III. RELATED WORK
During the last few years various approaches had been suggested for improving the traditional approaches of cost estimation. The aim is focusing towards getting more accurate results in the form of effective estimations. Among them some of the article which supports this research to be carrying forwards is taken here as surveyed papers[15].
In the paper [8] focus is made over improving the accuracy of schedule, effort and cost estimates. The estimation techniques can primarily be subdivided into two major categories: formal methods (parametric models such as
COCOMO) and expert-judgment based methods. This
research focuses on this question by analyzing when formal
estimation methods are more useful than expert-based
estimation given specific software quality requirements. Quality attributes such as usability, maintainability or portability are different in nature. They all have a particular influence on the software and system architecture and subsequently on the effort, schedule and cost necessary to develop the particular system. As the need for high quality software increases, it becomes more and more important to analyze the influence of quality requirements on costs. The goal is to more accurately predict the costs originating from high quality requirements. It is first important to understand those implications so that the inclusion of quality costs into project estimates will allow software companies to make better predictions. This will avoid big cost overruns because of unrealistic expectations and allow companies to justify quality costs towards their customers.
The cost, effort estimates of software projects done by the various companies. Out of those the effective model selections have to be made by getting the MRE (Mean Relative Error).
The paper [9] have administered the historical data to COCOMO 81, COCOMOII model and identified that the stellar predicament is that no cost model gives the exact estimate of a software project. This is due to the fact that a lot of productivity factors are not contemplated in estimation process. Along with the other element of the cost estimation the reusability is figured out for reducing the cost of already developed modules. It also evaluates the impact of the object orientation such as inheritance and polymorphism. It gives great return of investments using most of the legacy system reused by the developers. So further research exposure is in
“software Reuse” and Reuse software cost estimation model.
The paper also focuses on some of the reusable code study.
In this work [10], it is investigated the precision of size and cost drivers in the estimation of effort using Constructive Cost Model (COCOMO). All the factors applied to the cost derivative inputs will somewhere affect the certainty of output and the accuracy of the gross estimation. The size metrics can be used to represents the fuzzy data when the input fields are having unclear data for the defined attributes. It is always applied to the subjective category data with symmetrical triangles data and trapezoidal membership functions. This limitation can be resolved using Gaussian membership function along with previously selected COCOMO parameters. Apart from this improvement the paper also include the mechanism to join the benefits of both size and the cost attributes. While evaluating the proposed model of COCOMO we found that the suggested model is outperforming it and results were closer to the actual effort.
used to describe the layers in enterprises architectures and to for example show what applications are used in what business processes. This paper also presents a specialization of ArchiMate that handles project specific factors. The project specific meta-model elements are then combined with the regular ArchiMate meta-model classes to calculate the migration cost estimate. The combined meta-model contains the seventeen effort multipliers as well as the five scale factors in a combination. The meta-model differentiates between the three ArchiMate layers as well as the new project specific meta-model classes. Our study proposes a method combining expert estimation with the meta-model-based approach to raise the accuracy of estimation process. The integration was verified for the combination of different categories of projects which resulted relative error of only 10%.
The paper [12] analyses the process maturity (CMM) impacts on SDLC phases using some of the recently suggested attributes of COCOMO II. Analysis considers the 40 older projects with different maturity levels ranging from 1 to 4. Here the developed model is applied with the PRED and PMAT scale factors. It will also measure the prediction accuracy using the given PRED model. Finally the goal is to increase the strength of estimations in person per month. A common criterion for the evaluation of cost estimation models is the Relative Error (RE) or the Magnitude of Relative Error (MRE).The study showed that the proposed model (with the new PMAT rating values) yielded better estimates as
compared to the generic, constructive cost model II model’s
estimates.
Software metric and evaluation is base on measure of software factors which are typically related to the product, the process and the resources of software development. One of the greatest challenges for software developers is predicting the development effort for a software system based on some metrics for the last decades. One of the new approaches that called soft computing techniques may offer an unusual for this confront. This paper described an enhanced soft computing model for the estimation of software cost and time estimation [13]. The proposed model base on COCOMO II has two
input’s group from COCOMO II cost drivers and scale factors
and one output, effort estimation. This model covers those three fuzzy steps, fuzzification process, inference from fuzzy rules and defuzzification process. A result show that the values of MMRE (Mean of Magnitude of Relative Error) apply soft computing was considerably lower than MMRE applying by algorithmic models.
In the paper [14] a new fuzzy based estimation system is proposed using realistic models with higher accuracy and reduced estimation efforts. It also analyzes the role of fuzziness and applies the special two sided Gaussian function. Here the Gaussian function which gave superior transition from one interval to another. After applying the process the results are measured by means of applying COCOMO II and proposed model based on fuzzy logic to the NASA dataset and created an artificial dataset, it had been found that proposed model was performing better than ordinal COCOMO II and the achieved results were closer to the actual effort. The
relative error for proposed model using two-side Gaussian membership functions is lower than that of the error obtained using ordinal COCOMO II.
The paper [15] extends the fuzzy based estimation
process using two newly suggested metrics for COCOMO. The first model uses SLOC as input variable and the effort (E) is calculated and the second model uses FP approach. The proposed fuzzy models show better estimation capabilities compared to other reported models in the literature and better assist the project manager in computing the software required development effort. The validation results are carried out using Albrecht data set.
IV. PROBLEM IDENTIFIED
Recent studies had suggested that the estimation had always shows a varying nature due to dynamic factors. Risk is one of that factors which modifies the project development constraints like schedule, budget, operational and technical. The mitigation strategies are developed for handling them but their impact on the budget is never analyzed effectively. Thus the risk must be quantized in smaller problems that are solved easily with less efforts and accuracy. Previously the estimated effort by the basic COCOMO and COCOMO II is not considering the change in expected condition. It should be compared with the all the previously measured estimates and from which the forecasted direction and the current position of estimates must be calculated. Briefly the problem is described as[15]:
“The risk factors are not present in basic COCOMO but with the later version COCOMO II, it is represented in the cost driver. This cost is evaluated once at the starting of the project and somewhere at the intermediate pivot points. There is no mechanism available which analyses the impact of dynamic risk evolutions on project factors. Partial values or smaller change could also be affected in cost measurement as it affects as a real time conditions[15].”
In absence of the risk handling in cost the estimation could not be measured accurately.
V. PROPOSED METHODOLOGY
estimation model was not capable of handling the factors of risk coming dynamically[15].
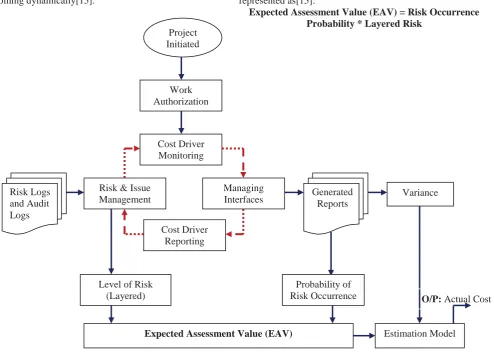
The process starts with initiation of the project arguments and the requirements. Later on the work and the task from which the risk can affects the system is validated in terms of authorization. Once the work is authorized the cost drivers are selected for monitoring their behaviour. Each factor or stage of SDLC is somewhere affected by the risk thus a risk management module is applied on the basis of The EAV process will specifically analyze, identify and respond to a particular situation and measure the impact of considering them into the cost. It actually applies the tolerance limits along with the uncertainties to the prior estimation. Here measuring the uncertainty at the initial stages of project lifecycle or estimation, some contingency plan might be developed. The process architecture of given model is shown below in figure 1.
some previous experiences with similar projects and types to get the impact in different situations. It will also handle the interfaces and reporting for change detection or dynamic evolution of requirements or any other entity. This process of analysing, identifying and responding to the appeared risk is having great importance in suggested EAV model. Here the objective is to measure impact of risk or level along with the
probability of its occurrences. The basic calculation of EAV is represented as[15]:
Expected Assessment Value (EAV) = Risk Occurrence Probability * Layered Risk
The above values can be treated according to situation like sometimes it was added to the project while it can also be subtracted from the overall profits. The complete expense difference with gained amount is considered to be baseline for project. It is the initial approved cost or profit structure for the project. While the risk is affecting the complete project thus the cost drivers are also revaluated to get more accuracy and reliability over the estimation process[15].
The dynamic risk based cost is measured as[15]:
Cost Driver [1 to m] = Driver Value [Scaling] + Risk with
Driver [EAV Value 1 to m]
The above mechanism is calculated for the cost factors having dynamic nature in both basic and COCOMO II. Now the final cost is given as[15]:
Estimated Cost=∑i=1 to n, m [Cost Drivers + EAV Value
(m)]* Variance (Person/Month Units)
In the above calculation we are also considering the variance factors which can be used in either cost form or in schedule form. It is measured by detecting the values which is
Expected Assessment Value (EAV)
Project Initiated
Work Authorization
Cost Driver Monitoring
Risk & Issue Management Risk Logs
and Audit Logs
Managing Interfaces
Cost Driver Reporting
Generated Reports
Level of Risk (Layered)
Probability of Risk Occurrence
Variance
O/P: Actual Cost
Estimation Model
going outside the baseline values. It deals with on time and budget delivery of project, thus if the SDLC is highly affected by dynamic risk then the variance will be higher and if the things are going as they were planned then variance is low[15].
Interpretation of Work
Since the Project Cost Variance is negative, this means the project is over-budget. Since Schedule Variance is negative, the project is behind schedule. This example project is in major trouble and corrective action needs to be taken to get it back on track. Estimated assessment values using cost variance and schedule variance will help you identify a project in trouble. It will also serve the purpose of effective risk management. Also by the above suggested model the estimation accuracy seems to be improved due to its complete nature covering the dynamic factors along with the adaptability using variance. The above equation also covers the various aspects of early and post architectures. As the estimation is making the individual cost factors multiplied with their EAV and variance, the output will be more precise and accurate cost[15].
Research Methodology
Considering the various aspects and the deriving primitives of cost estimation, we are using the normalization mechanism as research methodology. This selection was made on the basis of some questionnaires consisted on size of the product, schedule requirements and the effort measured. It also covers the product quality, reliability and maturity levels. By applying the normalization consistency is improved with better projection. It can be applied in three steps: first is to convert the data into equivalent sizes using reuse models. Second is to convert it into the logical countable units as source statements or SLOC. Third is to regroup the results based on their complexity and application types[15].
VI. EVALUATION PARAMETER
Cost Estimation Accuracy (CEA)
The cost estimation may vary due to changes in the requirements, staff size, and environment in which the software is being developed [4]. The calculation for cost estimation accuracy is given as follows[15]
Absolute error= (Epred - Eactual)
Percentage error= (Epred - Eactual)/Eactual
Relative error= 1/n ∑ (Epred - Eactual)/Eactual
Estimating Quality Factor (EQF)
The above results give a more accurate estimation of costs for future projects.[3] The cost estimation model now becomes more realistic. The EQF compares the actual realized value to different estimates that were made over time. Each estimated value is further weighted with the time the estimate
was valid, whereas the realized value is weighted with the total time of the project. The EQF can be expressed as[15]:
EQF= [Area under the Actual Value]
/
[Area between the Forecast and Actual Values]VII.IMPLEMENTATIONS DETAILS
The implementation phase involves in the actual construction and installation of a system. It is the process of converting design into an executable software system. In this phase we write, compile and test the software programs. The design must be translated into the code that actually performs the task. It may take several iterations of the model to produce a working program. Implementation also affects the testing and maintenance of the developed system. As programs get more complicated, testing and debugging alone may not be enough to produce reliable code. Instead, it is required to write programs in a manner that will ensure that errors are caught or avoided. Implementation includes user notification, user training, installation of hardware, installation of software onto production computers, and integration of the system into daily work processes.
Working of Application Screenshots
x Above snap of project includes the entry of the details
about the project for which the cost is estimated along with the mode of development and KLOC in the project entitled.
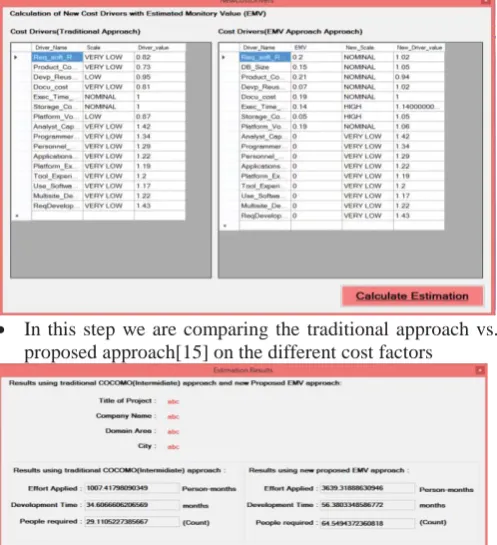
x In this step we are comparing the traditional approach vs. proposed approach[15] on the different cost factors
x
In this step we calculate and compare the efforts for traditional COCOMO and proposed approach[15].VIII.RESULT EVALUATION AND ANALYSIS
Cost estimation deals with accuracy and timely analysis of budget require for completing the project based on resources. If the estimation process is not giving accurate results then the organization may suffer from business drops of projects thus there must be some smooth and effective mechanism. With this work a novel estimated monetary based cost estimation model is suggested for getting better results. Previously the estimation model requires manual intervention causes high probability of error and incorrect decision. But with automatic execution of process the system is capable of achieving the accurate cost behind the applied estimation. It also includes the variance involve with the project. After implementing the solution now its time to prove the effectiveness of proposed model. Thus we require some attributes to be analysed and evaluated against various environmental conditions. These conditions are known as setups or test bed for measurement. We are passing the similar attributes to both the model i.e. traditional and the proposed and let them compare on single test shots. For evaluating different projects with variable SLOC was considered and then the attributes are analysed.
For evaluating the solution there were some hypothesis planned with implementation. These are
(i) An estimate of the total number of lines of new code to be developed
(ii) An estimate of the equivalent number of source lines of code (ESLOC) calculated using the reuse model
(iii)An estimate of the number of lines of code that have to be modified because of changes to the requirements.
These three estimates are added to give the total code size in KSLOC that you use in the effort computation formula. The final component in the estimates the number of lines of modified code and reflects the fact that software requirements always change.
The result is presented in the form of tables and graphs based on suitability of factors. Mainly the analysis starts just after the configuration and proceeds till the final results captured and compared with traditional model. We have to takes values from multiple executions of both the model so as to make the accurate and better predictions with the cost values.
Table 5.1: Configuration of Project with KSLOC
*VL-Very low, L-Low, N-Nominal
Table 5.2: Intermediate Calculation of EMV
S.
No Project ID Project Name
Type of
Project KSLOC
1 P_01 Online Shopping
Organic
10000 2 P_02 College ERP Solution 7500 3 P_03 Transport Management
System
5000
4 P_04 Inventory Management 8500
S N o
Cost Driver Name
Scaling
Prob. of Occur -rence
Impact
Level EMV
1 Analyst Capability
VL 0.22 0.92 0.20
2 Application Experience
L 0.17 0.48 0.15
3 Data base Size VL 0.18 0.55 0.21
4 Development reusability
L 0.23 0.21 0.07
5 Doc match to life cycle needs
VL 0.11 0.90 0.19
6 Execution time constraint
N 0.31 0.35 0.14
7 Multisite Development
N 0.10 0.30 0.05
8 Personal continuity
L 0.23 0.73 0.19
9 Platform Experience
VL 0.20 0.62 0
1 0
Product Volality
VL 0.23 0.56 0
1 1
Product Complexity
VL 0.12 1.16 0
1 2
Programmer's capabilities
VL 0.22 0.86 0
1 3
Storage Constraint
VL 0.57 0.08 0
1 4
Tool Experience
VL 0.15 0.73 0
1 5
Use of Software Tools
VII. CONCLUSION
Software estimation with intermediate COCOMO approach is done based on selecting values of 15 cost drivers which ranges from very low to extra high. This approach solely depends on the users experience because currently values of the cost drivers are directly selected and therefore it will be difficult to measure accurate estimation. So we refer the 15 cost drivers of intermediate COCOMO and come out with the quantitative estimation of scaling of all 15 cost drivers by adding an additional impact of risk associated with them[15]. By adding these dynamic values in the system through the estimated assessment value analysis, the accuracy of the estimation gets increased[15]. As a conclusion of the progress of work, we can say that with the proposed approach of analysing is technically feasible as the result evaluation shows and can leads to more accurate estimation than the traditional software development and estimation.
REFERENCES
[1] Module 11 Software Project Planning Version 2 CSE IIT, Kharagpur
[2] Robert W. Zmud Editor An Empirical Validation of Software Cost Estimation Models
[3] Cost Models For Future software life cycle processes: COCOMO 2.0, Barry Boehm, Bradford Clark, Ellis Horowitz and Chris westland, USC Center for Software Engineering, University of Southern California, Los Angeles
[4] The COCOMO II Suite of Software Estimation Models by Dr. Barry Boehm, University of Southern California
[5] 24th International Forum on COCOMO and Systems/Software Cost Modelling
[6] The influence of software quality requirements on the suitability of software cost estimation methods Marc Giombe, Ricardo Valerdi, Stefan Wagner
[7] Identifying the Importance of Software Reuse in COCOMO81, COCOMOII.
[8] By CH.V.M.K.Hari, Prof. Prasad Reddy P.V.G.D, J.N.V.R Swarup Kumar, G.SriRamGanesh, Dept of IT, Gitam University, Visakhapatnam, India. /International Journal on Computer Science and Engineering Vol.1(3), 2009, 142-147
[9] Improving the accuracy of effort estimation through Fuzzy set combination of size and cost drivers CH. SATYANANDA REDDY, KVSVN RAJU Department of Computer Science and Systems Engineering College of Engineering, Andhra University, Visakhapatnam, India WSEAS TRANSACTIONS on COMPUTERS
[10] Software Migration Project Cost Estimation using COCOMO II and Enterprise Architecture Modeling Alexander Hjalmarsson1, Matus Korman1 and Robert Lagerström1, 1 Royal Institute of Technology, Osquldas v. 10, 10044 Stockholm, Sweden.
[11] Impact of CMMI Based Software Process Maturityon
COCOMO II’s Effort Estimation Majed Al Yahya, Rodina
Ahmad, and Sai Lee Department of Software Engineering, University of Malaya, Malaysia. The International Arab Journal of Information Technology, Vol. 7, No. 2, April 2010
[12] Soft Computing Approach for Software Cost Estimation Iman Attarzadeh and Siew Hock Ow, Department of Software Engineering Faculty of Computer Science & Information Technology, University of Malaya, Kuala Lumpur, MALAYSIA, Soft Computing Approach for Software Cost Estimation
[13] A Novel Algorithmic Cost Estimation Model Based on Soft Computing Technique Iman Attarzadeh and Siew Hock Ow, Department of Software Engineering, Faculty of Computer Science and Information Technology, University of Malaya, 50603 Kuala Lumpur, Malaysia, Journal of Computer Science 6 (2): 117-125, 2010
[14] Software Effort Estimation Inspired by COCOMO and FP Models: A Fuzzy Logic Approach Alaa F. Sheta and Sultan Aljahdali, Computer Science Department, College of Computers and Information Technology Taif University, Taif, Saudi Arabia, (IJACSA) International Journal of Advanced Computer Science and Applications, Vol. 4, No. 11, 2013