Quantitative PCR provides a simple and
accessible method for quantitative microbiota
profiling
Ching JianID1, Panu Luukkonen2,3, Hannele Yki-Ja¨rvinen2,3, Anne Salonen1, Katri KorpelaID1*
1 Human Microbiome Research Program, Faculty of Medicine, University of Helsinki, Helsinki, Finland, 2 Minerva Foundation Institute for Medical Research, Helsinki, Finland, 3 Department of Medicine, University of Helsinki and Helsinki University Central Hospital, Helsinki, Finland
Abstract
The use of relative abundance data from next generation sequencing (NGS) can lead to misinterpretations of microbial community structures, as the increase of one taxon leads to the concurrent decrease of the other(s) in compositional data. Although different DNA- and cell-based methods as well as statistical approaches have been developed to overcome the compositionality problem, and the biological relevance of absolute bacterial abundances has been demonstrated, the human microbiome research has not yet adopted these meth-ods, likely due to feasibility issues. Here, we describe how quantitative PCR (qPCR) done in parallel to NGS library preparation provides an accurate estimation of absolute taxon abun-dances from NGS data and hence provides an attainable solution to compositionality in high-throughput microbiome analyses. The advantages and potential challenges of the method are also discussed.
Introduction
The use of relative abundance from next generation sequencing (NGS) data can lead to misin-terpretations of microbial community structures as due to compositionality, the relative abun-dances of the taxa being mutually dependent. This means that an increase of one taxon inevitably leads to the concurrent decrease of the other(s). Since the changes of components are mutually dependent, high false discovery rates occur when compositional data are analyzed using traditional statistical methods [1]. Correlation analysis of relative abundance data is strongly subject to a negative correlation bias and spurious associations [2]. Meanwhile, com-positionality particularly hampers the interpretation of microbial changes in longitudinal stud-ies, such as interventions. Without NGS-independent experiments as validation, it is
problematic to determine which taxon was truly affected by an intervention, i.e. to identify the actual target organism(s) for a specific treatment (Fig 1).
Contrary to the speculation that compositionality is dismissible in high complexity environ-ments [3], our simulations revealed that the compositionality effects may lead to extensive a1111111111 a1111111111 a1111111111 a1111111111 a1111111111 OPEN ACCESS
Citation: Jian C, Luukkonen P, Yki-Ja¨rvinen H, Salonen A, Korpela K (2020) Quantitative PCR provides a simple and accessible method for quantitative microbiota profiling. PLoS ONE 15(1): e0227285.https://doi.org/10.1371/journal. pone.0227285
Editor: Ivone Vaz-Moreira, Universidade Catolica Portuguesa, PORTUGAL
Received: August 30, 2019 Accepted: December 16, 2019 Published: January 15, 2020
Copyright:©2020 Jian et al. This is an open access article distributed under the terms of the
Creative Commons Attribution License, which permits unrestricted use, distribution, and reproduction in any medium, provided the original author and source are credited.
Data Availability Statement: All relevant data are within the paper and its Supporting Information files. The sequence files are available in the European nucleotide Archive (https://www.ebi.ac. uk/ena). Accession number: PRJEB35994. Funding: The work was funded by grants from the University of Helsinki (AS, KK, PL), the EU/EFPIA Innovative Medicines Initiative Joint Undertaking (EMIF grant no. 115372, HY-J), the EPoS (Elucidating Pathways of Steatohepatitis) consortium funded by the Horizon 2020
false positive findings in both complex microbial communities (e.g., gut) as well as samples with low diversity (e.g., vaginal swab) (S1andS2Figs). Sophisticated statistical methods have been developed in an effort to mitigate the effect of mutual dependence of component changes in compositional sequencing data [1–4]. However, unknown absolute abundances cannot be deduced from compositional data using statistical methods, yet recent studies have shown that absolute abundances of bacteria are biologically meaningful [5–7]. Taken together, relying solely on relative abundance results in false findings (Fig 1) as well as the omission of impor-tant information on the interactions of different taxa with each other and the host [8].
Absolute quantification of microbial abundances from NGS datasets (i.e. quantitative microbiome profiling) can be achieved by integrating cell-based or DNA-based methods into standard NGS workflows. Flow cytometry has been applied to complement amplicon sequenc-ing in an engineered freshwater ecosystem [9] and recently by Vandeputte et al. [6] for fecal samples. For DNA-based methods, spike-in bacteria [10], synthetic DNA [11] as well as quan-titative PCR (qPCR) have been employed to estimate NGS-derived absolute abundances of penile microbiota [7] and environmental fungi [12]. Recently, DNA yield was used to docu-ment quantitative variations in the fecal microbiota of numerous mammalian species as well as in human patients after fecal microbiota transplant [5], and to investigate microbiota devel-opment in premature infants [13]. Notwithstanding the variety of methods that have been introduced to overcome artefacts related to data compositionality, they have not been adopted for the human microbiome research. Of note, none of the clinical trials published during the past year (except the ones specifically addressing the compositionality problem [5,6]) utilized quantitative microbiome profiling. Here, we present how quantitative PCR (qPCR)-based bac-terial enumeration can be integrated to NGS pipelines to provide a feasible approach to esti-mate absolute abundances from NGS data, and hence promote the use of quantitative microbiome profiling in the field of human microbiome.
Materials and methods
Study subjects and fecal sample collection
The study used the samples derived from an intervention registered atClinicalTrials.govas NCT02133144. The study protocol was approved by the Medical Ethical Committees of the Hospital District of Helsinki and Uusimaa and Helsinki University Central Hospital. All
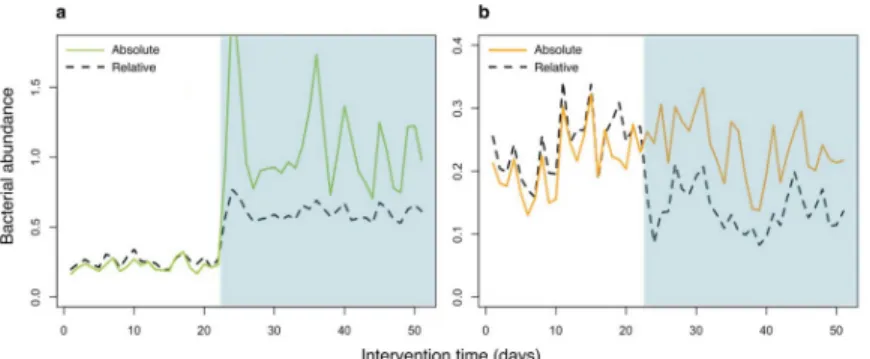
Fig 1. Compositionality leading to false positive discoveries. To demonstrate the effect of compositionality on interpretation of microbiome NGS data, an intervention was simulated where a single taxon increased in abundance. The simulation was conducted in absolute abundance, which was converted to relative abundance for data analysis. (a) The intervention (shaded area) increased a single taxon (green solid line), which remained true when converted to relative abundance (black dashed line). (b) Other taxa (a single taxon represented here by the orange solid line) were not affected by the intervention. However, the relative abundance (black dashed line) shows a negative impact of the intervention, due to the increase in relative abundance of the affected taxon in (a).
https://doi.org/10.1371/journal.pone.0227285.g001
Framework Program of the European Union under Grant Agreement 634413 (HY-J), Academy of Finland (KK, HY-J), Otto A. Malm (CJ), Sigrid Juselius (HY-J), EVO (HY-J), Finnish Medical (PL), Alfred Kordelin (PL), Paulo (AS and PL), Jalmari and Rauha Ahokas and Novo Nordisk (HY-J), Mary and Georg C. Ehnrooth (AS) as well as Biocodex Microbiota (AS) Foundations. The funders had no role in study design, data collection and analysis, decision to publish, or preparation of the manuscript.
Competing interests: The authors have declared that no competing interests exist.
volunteers provided an informed, written consent. The study cohort consisting of 38 adult human subjects has been described previously [14]. The trial aimed to study the metabolic effects of hypercaloric diets enriched in different macronutrients. The study protocol was approved by the Medical Ethical Committees of the Hospital District of Helsinki and Uusimaa and HUCH. For the current study, we additionally included follow-up samples collected after the trial, amounting to a total of 114 samples. Fecal samples were self-collected and stored at -20˚C, and then transferred to the long-term storage at -80˚C within 1 day.
Bacterial DNA extraction
Bacterial DNA was extracted from fecal samples using a modified version of repeated bead beating [15] that efficiently extracts bacterial DNA from both Gram-positive and -negative cocci [16]. Briefly, immediately after thawing, 0.125 g of feces were weighted and added into 2.0 ml screw-up tubes pre-filled with 0.25 g of 0.1 mm zirconia beads and 3 of 3 mm glass beads. Fecal samples were re-suspended to 0.5 ml of lysis buffer (500 mM NaCl, 50 mM Tris-HCL (pH 8), 50 mM EDTA, 4% SDS). Two successive rounds of 1-minute bead beating were done using a FastPrep1-24 instrument (MP Biomedicals, Santa Ana, CA, USA) at 5.5 m/s. The lysate fraction produced from the first round of bead beating was collected before the sec-ond round to minimize DNA shearing [15]. Each round of bead beating was followed by a 15-min incubation period at 95˚C to further enhance the lysis. After precipitation of DNA, the DNA was further purified by using the QIAamp DNA Mini Kit columns (Qiagen, Hilden, Germany). The purified DNA was quantified for DNA concentration using a Qubit1 fluorom-eter (Invitrogen, CA, USA) before storing at -20˚ C until further use. All the fecal samples were processed within 10 days.
16S rRNA gene sequencing
Illumina MiSeq paired-end sequencing of the hypervariable V3-V4 regions of the 16S rRNA gene (primers 341F/785R) was performed according to the manual from Illumina with a slight modification where dual index TrusSeq-tailed 1-step amplification [17] was used for library preparation. The detailed protocol for library preparation has been described [14]. The pooled libraries were sequenced with an Illumina MiSeq instrument using paired end 2×300 bp reads and a MiSeq v3 reagent kit with 5% PhiX as spike-in. The sequencing was carried out at the sequencing unit of the Institute for Molecular Medicine Finland (FIMM), Helsinki, Finland.
Sequencing data processing and analysis
The preprocessing was done in the R packagemare[18], utilizing USERACH for quality filter-ing, chimera removal, and taxonomic annotation [19]. Only the high-quality forward reads were used, as we have previously shown that this approach provides the most accurate results [13]. The forward reads were truncated to length of 150 bases withmare’s “ProcessReads” command. We used default settings for minimum quality score (2) and maximum expected errors (1). Reads with prevalence below 0.01% were removed, as they are likely to contain errors. To avoid potential biases in taxonomic annotation caused by OTU clustering [20], truncated, filtered and dereplicated reads were directly annotated using the Silva 115 database [21], restricted to gut-associated taxa as done in our previous studies [13,22].
Quantitative PCR
Quantification of total bacteria, specific taxa and butyrate production capacity was carried out by qPCR using a BioRad iCycler iQ thermal cycler system (BioRad, Hercules, CA) with HOT
FIREPol1EvaGreen1qPCR Mix Plus (Solis BioDyne, Tartu, Estonia). The 331F/797R prim-ers were chosen for the quantification of total bacteria, as the primprim-ers target the V3-V4 hyper-variable regions as in Illumina MiSeq. A list of primers and references used in the present study is summarized inS1 Table.
For bacterial enumeration, total bacteria,Clostridiumcluster XIVa and Bacteroidetes were quantified using 0.5 ng of fecal DNA, for the less abundantBifidobacteriumandE.coligroups 25 ng DNA/reaction was used. Detailed information on the PCR conditions has been
described previously [15,23]. Briefly, the thermal cycling conditions started with a DNA-dena-turation step at 95˚ C for 15 minutes, followed by 40 cycles of 1) denaDNA-dena-turation at 95˚ C for 15 seconds, 2) annealing at a primer-specific temperature (Annealing (˚C) inS1A Table) for 20 seconds, 3) extension at 72˚ C for 30 seconds and 4) an incubation step at a primer-specific temperature to detect the fluorescent data (Detection (˚C) inS1A Table). A melting curve analysis was carried out to ensure the specificity of the amplification products. The 10-log-fold standard curves ranging from 102to 107copies were produced using the full-length amplicons of 16S rRNA gene of appropriate reference organisms [23] (Ruminococcus productusfor Clos-tridiumcluster XIVa,Bacteroides fragilisfor Bacteroidetes,Bifidobacterium longumfor Bifido-bacterium/total bacteria, andEscherichia coli DSM 6897forE.coli) to convert the threshold cycle (Ct) values into the average estimates of target bacterial genomes present in 1 g of feces (copy numbers/g of wet feces) in each assay.
For quantification of butyrate production capacity of the microbiota, the butyryl-CoA:ace-tate CoA-transferase gene was quantified by qPCR as described [24], and the output values were converted based on comparative Ct method [25]. The results were correlated to the NGS-based abundance of the dominant butyrate-producing generaSubdoligranulum, Faecalibacter-ium,Anaerostipes,Butyrivibrio, andRoseburia/Eubacterium rectale[26,27].
All qPCR assays were performed in triplicate. Precautions were taken to ensure that the data from each triplicate fell within 0.5 threshold cycle (Ct), and clear outliers (>2 standard deviations) were removed before calculating average Ct of each sample. Melting curves and non-template controls were used to assess run reliability. There was no detectable amplifica-tion arising from non-template controls in any of the assays. The amplificaamplifica-tion efficiencies of all qPCR assays ranged from 91% to 98%.
Calculation of absolute abundance and copy-number correction
The sequencing reads assigned to different taxa in each sample were divided by the total num-ber of reads for the sample to obtain relative abundances of the taxa in each sample. The relative abundances obtained based on the sequencing reads were translated into total abundances by multiplying the relative abundance of each taxon by the total bacterial abundance in the sample. These figures were further corrected for 16S rRNA gene copy-number variation by dividing the abundance of a taxon by the number of 16S copies in its genome. For the copy-number correc-tion, we used the 16S copy number database rrnDB [28]. The process is depicted inFig 2.
Results and discussion
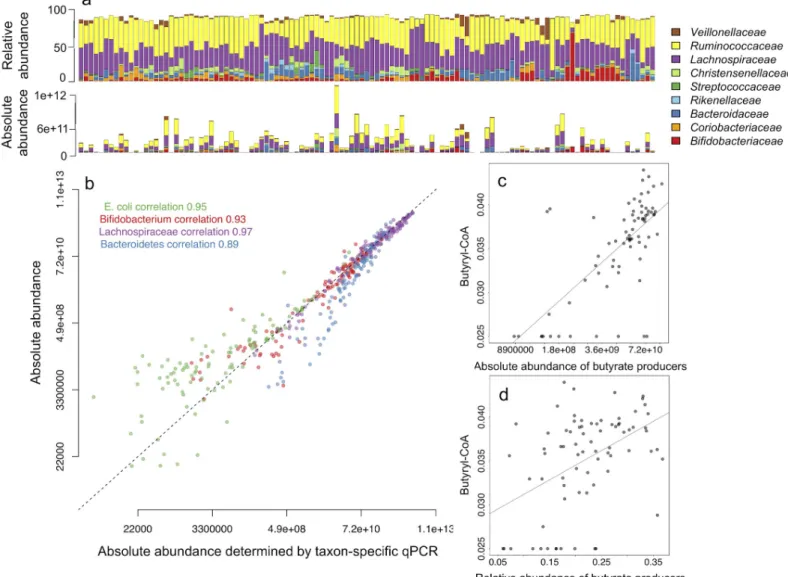
We quantified total bacteria using universal bacterial primers [29] by qPCR in 114 adult fecal DNA samples that have been analyzed for microbiota composition using Illumina MiSeq for 16S rRNA gene amplicon sequencing [14]. The qPCR threshold cycle (Ct) values were con-verted to the estimates of bacterial genomes present in 1 g of feces as a proxy of total bacterial counts. Absolute abundances of individual taxa can be estimated via multiplying the relative abundances of the NGS-detected taxa by total bacterial counts (Fig 3A). We validated the esti-mated absolute abundances of four representative taxa by qPCR using taxon-specific primers
(S1 Table) for the phylum Bacteroidetes,Clostridiumcluster XIVa (familyLachnospiraceae), genusBifidobacteriumandEscherichia colispecies using standard curve-based absolute quanti-fication. These four taxa were chosen for their representation of different taxonomic ranks and availability of primers and standards. We found near-perfect correlations between the esti-mated absolute abundances and qPCR abundances in all tested taxa (Fig 3B). By correlating the cumulative absolute abundance of butyrate-producing bacteria to the abundance of the butyryl-CoA:acetate CoA-transferase gene determined by qPCR [24], we show that qPCR-based quantitative microbiome profiling can also be used to more precisely estimate the abun-dances of specific microbiota functions (Fig 3C and 3D). The estimated absolute abundance of butyrate producers accounted for 47% of the variation in the qPCR-determined butyryl-CoA: acetate CoA-transferase gene abundance (p = 1.15e-11), while the relative abundance explained only 23% (p = 9.92e-06).
Fig 2. Workflow for implementation of qPCR-based quantitative microbiome profiling. All of these steps are included in R package mare [18]. https://doi.org/10.1371/journal.pone.0227285.g002
Importantly, qPCR-based quantitative microbiome profiling enjoys the following concep-tual and practical benefits over other approaches:
1. Cost-effectiveness and feasibility
qPCR is cost-effective and accessible as the laboratory settings, machinery and reagents are similar to those needed for preparing the NGS libraries. The same DNA extract serves as the starting material both for qPCR and NGS, making qPCR done in 96- or 384-format easy to implement in the workflow for high-throughput analysis of up to thousands of microbiome samples.
Fig 3. Relative microbiome profiles translated into quantitative microbiome profiles using qPCR. (a) Comparison of relative abundances and estimated absolute abundances of dominant bacterial families in 114 fecal samples. The top panel shows relative abundances based on 16S amplicon sequencing and the lower panels shows the estimated absolute abundances calculated by multiplying the relative abundances with total bacterial load, i.e. qPCR-based estimate of copies of 16S gene per 1 g of feces. (b) Correlation between the qPCR abundances (16S rRNA gene copies per g feces) and the estimated absolute abundances of four taxa representing species, genus, family and phylum levels. The dashed line shows the expected 1:1 correspondence. The correspondence decreases at the very low end of the abundance range, likely due to the relatively lower PCR amplification efficiency and increased stochasticity of the results for low abundance taxa in NGS [30]. The applied library preparation method (dual index TruSeq-tailed 1-step amplification [17]) causes a slight underestimation of Bacteroidetes abundance (unpublished data), explaining the
underestimation observed for this phylum compared to qPCR. (c) and (d) show the associations between the qPCR-determined abundance of the butyryl-CoA:acetate CoA-transferase gene and the (c) estimated absolute abundance and (d) relative abundance of butyrate producers detected in the NGS data.
2. Simplicity
qPCR is relatively simple to perform compared to flow cytometry that requires considerable expertise for reproducible results. In fact, flow cytometric enumeration of microbial cells was initially restricted to pure cultures [31] and still remains challenging when performed in complex matrices [32]. Also, no spikes, other exogenous controls, or complicated trans-formation/computation are needed in qPCR-based quantitative microbiome profiling. 3. Comparability to NGS
Unlike flow cytometry that counts cells, qPCR and NGS both target bacterial DNA, includ-ing extracellular DNA derived from lysed bacteria. Extracellular DNA can be intrinsic or result from the differential lysis of Gram-positive and negative bacteria during the common freeze-thawing prior to fecal DNA extraction. As the 16S profiles from the gut appear very different for intracellular and extracellular DNA [33], qPCR is expected to reflect the NGS-targeted community structure both quantitatively and qualitatively more closely than flow cytometry.
4. Applicability
qPCR-based quantitative microbiome profiling is applicable also for samples containing a substantial amount of host or non-bacterial DNA, in which bacterial density cannot be reli-ably estimated by total DNA yield [5]. Moreover, the qPCR-based method can be employed to study also non-bacterial communities where a universal marker gene is available, such as in fungi [12].
It should be noted that relative and absolute abundances based on 16S rRNA gene copies are a proxy for microbial density rather than exact numeration of cells, since 16S rRNA gene copy numbers vary among bacteria. It is, however, possible to computationally correct for 16S rRNA gene copy numberspost hocas we did for this dataset (Fig 2), if the 16S rRNA gene copy numbers of the taxa present in the samples are known. Other potential biases related to PCR-based methods include e.g. inadequate DNA extraction, presence of PCR inhibitors and primer coverage. Nevertheless, these factors play a similar role in the NGS itself [34]. The fact that the qPCR-based approach does not introduce additional biases to those already present in NGS workflows can be thus considered an advantage.
Since several universal bacterial primers have been designed and optimized specifically for qPCR or NGS, it is advisable to consider potential biases resulting from primer-specific ampli-fication efficiency for particular taxa [35] as well as differential primer coverage, when using different primer sets for qPCR and NGS. In this study, we chose a widely-used universal bacte-rial primer set optimized for qPCR [29] that similarly targets the V3-V4 hypervariable regions as the primer set used for Illumina MiSeq (S1A Table). The qPCR primers have slightly lower but sufficiently comparable coverage for the domain Bacteria compared to the primers for NGS. The coverage of both qPCR and NGS primer sets is highly comparable for the four taxa selected for taxon-specific qPCR (S1B Table), which provides reliable validation of the described method in this study. For future improvement of the herein presented approach, a qPCR assay utilizing exactly the same primer pair as for NGS could be optimized and validated.
One challenge in the cross-study comparability of qPCR-based quantitative microbiome profiling is the reliance on an external qPCR standard from a reference organism required to construct a standard curve. In theory, any typical taxon present in a microbial community of interest can be used as the reference organism for standard curve construction. However, the choice of reference organisms may induce differences in quantification results, as the qPCR amplification efficiencies of different reference organisms may differ [34].
For the statistical analysis of bacterial abundances, relative or absolute, the distribution of the data should be considered. Absolute abundances tend to be greatly right-skewed in distri-bution, so log-transformation will be useful if statistical methods that assume normal distribu-tion are used. As the abundances are essentially bacterial counts, it is advisable to use statistical tests appropriate for count data, such as generalized linear models with Poisson or negative binomial distribution. For rare taxa with a lot of zeros, zero-inflated models should be consid-ered. Importantly, the right model depends on the distribution of the abundances of a particu-lar taxon, and thus the same model may be not appropriate for all taxa. Notably, this is true also for the analysis of relative abundances. The R packagemare[18] can handle both types of data, automatically selecting the suitable statistical model for each taxon.
Conclusions
In conclusion, we caution against the analysis of microbiome NGS data solely relying on rela-tive abundance, since compositionality may skew biological inferences from microbiome stud-iesperour simulation data as well as the previously published studies. Although relative taxon abundance can be indicative, absolute quantification is necessary for obtaining a comprehen-sive understanding of the dynamics and interactions of the microbiome. To this end, we sug-gest qPCR-based quantitative microbiome profiling be integrated in standard NGS-based microbiome analysis.
Supporting information
S1 Fig. Selected results of a simulated intervention in a complex community (91 taxa).
(DOCX)
S2 Fig. Results of a simulated intervention in a simple community (10 taxa).
(DOCX)
S1 Table. List of primers used in this study.
(PDF)
S1 File. Raw data in spreadsheet format. This file contains the following data: simulated
intervention used inS1andS2Figs, total bacterial and taxon-specific qPCR, and qPCR of butyryl-CoA:acetate CoA-transferase gene.
(XLSX)
Acknowledgments
We thank Professor Willem de Vos for comments on the manuscript.
Author Contributions
Conceptualization: Katri Korpela.Formal analysis: Ching Jian, Katri Korpela. Funding acquisition: Anne Salonen.
Resources: Panu Luukkonen, Hannele Yki-Ja¨rvinen. Supervision: Anne Salonen.
Writing – original draft: Ching Jian.
References
1. Knight R, Vrbanac A, Taylor BC, Aksenov A, Callewaert C, Debelius J, et al. Best practices for analysing microbiomes. Nature reviews Microbiology. 2018; 16(7):410–22. Epub 2018/05/26.https://doi.org/10. 1038/s41579-018-0029-9PMID:29795328.
2. Gloor GB, Macklaim JM, Pawlowsky-Glahn V, Egozcue JJ. Microbiome Datasets Are Compositional: And This Is Not Optional. Frontiers in microbiology. 2017; 8:2224. Epub 2017/12/01.https://doi.org/10. 3389/fmicb.2017.02224PMID:29187837; PubMed Central PMCID: PMC5695134.
3. Tsilimigras MC, Fodor AA. Compositional data analysis of the microbiome: fundamentals, tools, and challenges. Annals of epidemiology. 2016; 26(5):330–5. Epub 2016/06/04.https://doi.org/10.1016/j. annepidem.2016.03.002PMID:27255738.
4. Morton JT, Marotz C, Washburne A, Silverman J, Zaramela LS, Edlund A, et al. Establishing microbial composition measurement standards with reference frames. Nat Commun. 2019; 10(1):2719. Epub 2019/06/22.https://doi.org/10.1038/s41467-019-10656-5PMID:31222023; PubMed Central PMCID: PMC6586903.
5. Contijoch EJ, Britton GJ, Yang C, Mogno I, Li Z, Ng R, et al. Gut microbiota density influences host physiology and is shaped by host and microbial factors. eLife. 2019;8. Epub 2019/01/23.https://doi.org/ 10.7554/eLife.40553PMID:30666957; PubMed Central PMCID: PMC6342524.
6. Vandeputte D, Kathagen G, D’Hoe K, Vieira-Silva S, Valles-Colomer M, Sabino J, et al. Quantitative microbiome profiling links gut community variation to microbial load. Nature. 2017; 551(7681):507–11. Epub 2017/11/17.https://doi.org/10.1038/nature24460PMID:29143816.
7. Liu CM, Hungate BA, Tobian AA, Ravel J, Prodger JL, Serwadda D, et al. Penile Microbiota and Female Partner Bacterial Vaginosis in Rakai, Uganda. mBio. 2015; 6(3):e00589. Epub 2015/06/18.https://doi. org/10.1128/mBio.00589-15PMID:26081632; PubMed Central PMCID: PMC4471566.
8. Lewis ZT, Totten SM, Smilowitz JT, Popovic M, Parker E, Lemay DG, et al. Maternal fucosyltransferase 2 status affects the gut bifidobacterial communities of breastfed infants. Microbiome. 2015; 3:13. Epub 2015/04/30.https://doi.org/10.1186/s40168-015-0071-zPMID:25922665; PubMed Central PMCID: PMC4412032.
9. Props R, Kerckhof FM, Rubbens P, De Vrieze J, Hernandez Sanabria E, Waegeman W, et al. Absolute quantification of microbial taxon abundances. The ISME journal. 2017; 11(2):584–7. Epub 2016/09/10. https://doi.org/10.1038/ismej.2016.117PMID:27612291; PubMed Central PMCID: PMC5270559. 10. Stammler F, Glasner J, Hiergeist A, Holler E, Weber D, Oefner PJ, et al. Adjusting microbiome profiles
for differences in microbial load by spike-in bacteria. Microbiome. 2016; 4(1):28. Epub 2016/06/23. https://doi.org/10.1186/s40168-016-0175-0PMID:27329048; PubMed Central PMCID: PMC4915049. 11. Tkacz A, Hortala M, Poole PS. Absolute quantitation of microbiota abundance in environmental
sam-ples. Microbiome. 2018; 6(1):110. Epub 2018/06/21.https://doi.org/10.1186/s40168-018-0491-7PMID: 29921326; PubMed Central PMCID: PMC6009823.
12. Dannemiller KC, Lang-Yona N, Yamamoto N, Rudich Y, Peccia J. Combining real-time PCR and next-generation DNA sequencing to provide quantitative comparisons of fungal aerosol populations. Atmo-spheric Environment. 2014; 84:113–21.https://doi.org/https://doi.org/10.1016/j.atmosenv.2013.11.036. 13. Korpela K, Blakstad EW, Moltu SJ, Strommen K, Nakstad B, Ronnestad AE, et al. Intestinal microbiota
development and gestational age in preterm neonates. Sci Rep. 2018; 8(1):2453. Epub 2018/02/08. https://doi.org/10.1038/s41598-018-20827-xPMID:29410448; PubMed Central PMCID:
PMC5802739.
14. Luukkonen PK, Sadevirta S, Zhou Y, Kayser B, Ali A, Ahonen L, et al. Saturated Fat Is More Metaboli-cally Harmful for the Human Liver Than Unsaturated Fat or Simple Sugars. Diabetes care. 2018; 41 (8):1732–9. Epub 2018/05/31.https://doi.org/10.2337/dc18-0071PMID:29844096.
15. Salonen A, Nikkila J, Jalanka-Tuovinen J, Immonen O, Rajilic-Stojanovic M, Kekkonen RA, et al. Com-parative analysis of fecal DNA extraction methods with phylogenetic microarray: effective recovery of bacterial and archaeal DNA using mechanical cell lysis. Journal of microbiological methods. 2010; 81 (2):127–34. Epub 2010/02/23.https://doi.org/10.1016/j.mimet.2010.02.007PMID:20171997. 16. Costea PI, Zeller G, Sunagawa S, Pelletier E, Alberti A, Levenez F, et al. Towards standards for human
fecal sample processing in metagenomic studies. Nature biotechnology. 2017; 35(11):1069–76. Epub 2017/10/03.https://doi.org/10.1038/nbt.3960PMID:28967887.
17. Raju SC, Lagstrom S, Ellonen P, de Vos WM, Eriksson JG, Weiderpass E, et al. Reproducibility and repeatability of six high-throughput 16S rDNA sequencing protocols for microbiota profiling. Journal of microbiological methods. 2018; 147:76–86. Epub 2018/03/23.https://doi.org/10.1016/j.mimet.2018.03. 003PMID:29563060.
18. Korpela K. mare: Microbiota Analysis in R Easily2016. Available from:https://github.com/katrikorpela/ mare.
19. Edgar RC. Search and clustering orders of magnitude faster than BLAST. Bioinformatics (Oxford, England). 2010; 26(19):2460–1. Epub 2010/08/17.https://doi.org/10.1093/bioinformatics/btq461PMID: 20709691.
20. Tikhonov M, Leach RW, Wingreen NS. Interpreting 16S metagenomic data without clustering to achieve sub-OTU resolution. The ISME journal. 2015; 9(1):68–80. Epub 2014/07/12.https://doi.org/10. 1038/ismej.2014.117PMID:25012900; PubMed Central PMCID: PMC4274427.
21. Quast C, Pruesse E, Yilmaz P, Gerken J, Schweer T, Yarza P, et al. The SILVA ribosomal RNA gene database project: improved data processing and web-based tools. Nucleic acids research. 2013; 41 (Database issue):D590–6. Epub 2012/11/30.https://doi.org/10.1093/nar/gks1219PMID:23193283; PubMed Central PMCID: PMC3531112.
22. Korpela K, Salonen A, Vepsalainen O, Suomalainen M, Kolmeder C, Varjosalo M, et al. Probiotic sup-plementation restores normal microbiota composition and function in antibiotic-treated and in caesar-ean-born infants. Microbiome. 2018; 6(1):182. Epub 2018/10/18. https://doi.org/10.1186/s40168-018-0567-4PMID:30326954; PubMed Central PMCID: PMC6192119.
23. Rinttila T, Kassinen A, Malinen E, Krogius L, Palva A. Development of an extensive set of 16S rDNA-tar-geted primers for quantification of pathogenic and indigenous bacteria in faecal samples by real-time PCR. Journal of applied microbiology. 2004; 97(6):1166–77. Epub 2004/11/18.https://doi.org/10.1111/ j.1365-2672.2004.02409.xPMID:15546407.
24. Louis P, Flint HJ. Development of a semiquantitative degenerate real-time pcr-based assay for estima-tion of numbers of butyryl-coenzyme A (CoA) CoA transferase genes in complex bacterial samples. Applied and environmental microbiology. 2007; 73(6):2009–12. Epub 2007/01/30.https://doi.org/10. 1128/AEM.02561-06PMID:17259367; PubMed Central PMCID: PMC1828812.
25. Schmittgen TD, Livak KJ. Analyzing real-time PCR data by the comparative C(T) method. Nature proto-cols. 2008; 3(6):1101–8. Epub 2008/06/13.https://doi.org/10.1038/nprot.2008.73PMID:18546601. 26. Louis P, Flint HJ. Formation of propionate and butyrate by the human colonic microbiota. Environ
Micro-biol. 2017; 19(1):29–41. Epub 2016/12/09.https://doi.org/10.1111/1462-2920.13589PMID:27928878. 27. Reichardt N, Vollmer M, Holtrop G, Farquharson FM, Wefers D, Bunzel M, et al. Specific
substrate-driven changes in human faecal microbiota composition contrast with functional redundancy in short-chain fatty acid production. The ISME journal. 2018; 12(2):610–22. Epub 2017/12/02.https://doi.org/10. 1038/ismej.2017.196PMID:29192904; PubMed Central PMCID: PMC5776475.
28. Stoddard SF, Smith BJ, Hein R, Roller BR, Schmidt TM. rrnDB: improved tools for interpreting rRNA gene abundance in bacteria and archaea and a new foundation for future development. Nucleic acids research. 2015; 43(Database issue):D593–8. Epub 2014/11/22.https://doi.org/10.1093/nar/gku1201 PMID:25414355; PubMed Central PMCID: PMC4383981.
29. Nadkarni MA, Martin FE, Jacques NA, Hunter N. Determination of bacterial load by real-time PCR using a broad-range (universal) probe and primers set. Microbiology (Reading, England). 2002; 148(Pt 1):257–66. Epub 2002/01/10.https://doi.org/10.1099/00221287-148-1-257PMID:11782518. 30. Gonzalez JM, Portillo MC, Belda-Ferre P, Mira A. Amplification by PCR artificially reduces the
propor-tion of the rare biosphere in microbial communities. PLoS ONE. 2012; 7(1):e29973. Epub 2012/01/19. https://doi.org/10.1371/journal.pone.0029973PMID:22253843; PubMed Central PMCID:
PMC3256211.
31. Czechowska K, Johnson DR, van der Meer JR. Use of flow cytometric methods for single-cell analysis in environmental microbiology. Current opinion in microbiology. 2008; 11(3):205–12. Epub 2008/06/20. https://doi.org/10.1016/j.mib.2008.04.006PMID:18562243.
32. Frossard A, Hammes F, Gessner MO. Flow Cytometric Assessment of Bacterial Abundance in Soils, Sediments and Sludge. Frontiers in microbiology. 2016; 7:903. Epub 2016/07/06.https://doi.org/10. 3389/fmicb.2016.00903PMID:27379043; PubMed Central PMCID: PMC4905975.
33. Qi C, Li Y, Yu RQ, Zhou SL, Wang XG, Le GW, et al. Composition and immuno-stimulatory properties of extracellular DNA from mouse gut flora. World Journal of Gastroenterology. 2017; 23(44):7830–9. https://doi.org/10.3748/wjg.v23.i44.7830PMID:29209124; PubMed Central PMCID: PMC5703912. 34. Bonk F, Popp D, Harms H, Centler F. PCR-based quantification of taxa-specific abundances in
micro-bial communities: Quantifying and avoiding common pitfalls. Journal of microbiological methods. 2018; 153:139–47. Epub 2018/09/30.https://doi.org/10.1016/j.mimet.2018.09.015PMID:30267718. 35. von Wintzingerode F, Gobel UB, Stackebrandt E. Determination of microbial diversity in environmental
samples: pitfalls of PCR-based rRNA analysis. FEMS microbiology reviews. 1997; 21(3):213–29. Epub 1998/02/06.https://doi.org/10.1111/j.1574-6976.1997.tb00351.xPMID:9451814.
![Fig 2. Workflow for implementation of qPCR-based quantitative microbiome profiling. All of these steps are included in R package mare [18].](https://thumb-us.123doks.com/thumbv2/123dok_us/11114797.2999678/5.918.71.847.98.763/workflow-implementation-based-quantitative-microbiome-profiling-included-package.webp)