Development of an Optimization Model for Design and Planning of a Decentralized District Energy System
Mohammad Sameti
A Thesis in the Department
of
Building, Civil, and Environmental Engineering
Presented in Partial Fulfillment of the Requirements For the Degree of
Doctor of Philosophy (Building Engineering) at Concordia University
Montreal, Quebec, Canada
July 2018
CONCORDIA UNIVERSITY
SCHOOL OF GRADUATE STUDIES
This is to certify that the thesis prepared By: Mohammad Sameti
Entitled: Development of an Optimization Model for Design and Planning of a Decentralized District Energy System
and submitted in partial fulfillment of the requirements for the degree of
Doctor Of Philosophy (Building Engineering)
complies with the regulations of the University and meets the accepted standards with respect to originality and quality.
Signed by the final examining committee:
Chair
Dr. Nizar Bouguila
External Examiner
Dr. Marco Perino
External to Program
Dr. Shahin Hashtrudi Zad
Examiner
Dr. Fuzhan Nasiri
Examiner
Dr. Radu Zmeureanu
Thesis Supervisor
Dr. Fariborz Haghighat
Approved by
Dr. Fariborz Haghighat,
Graduate Program Director
Friday, September 21,
2018
Dr. Amir Asif, Dean
iii
ABSTRACT
Development of an Optimization Model for Design and Planning of a Decentralized District Energy System
Mohammad Sameti, Ph.D. Concordia University, 2018
This dissertation reports the development of a optimization model to help designing a tri-generation system for a given newly-built district with its consumers to satisfy the heating, cooling, and hot water demands featuring 4th generation district energy characteristics. The aim is to find the best way to select the equipment among various candidates (capacities), the pipeline network among the buildings, and their electrical grid connections. The objective function includes the annualized overall capital and operation costs for the district along with the benefits of selling electricity to the grid. The distributed energy supply consists of heating, cooling, and power networks, different CHP technologies, solar array, chillers, auxiliary boilers, and thermal and electrical storage. The performance of the model was evaluated for designing two different case under various scenarios: (i) a combined heat and power design, and (ii) a combined cooling and power design both carried out for the new part of Suurstoffi district situated in Risch Rotkreuz, Switzerland with seven residential and office complexes. For the combined heat and power design, the scenarios are defined based on the existence or non-existence of the distribution network (both heat and electricity) and the effectiveness of the storage systems. Allowing heat exchange among the buildings leads to 25% reduction in the total annualized cost and 5% reduction in emission compared to the conventional districts. Simultaneous heat and electricity exchange results in a higher reduction equal to 40% of the base scenario. Adding storage systems opens up an opportunity to lower both costs and emission even more and turns the district to a net-zero energy and energy plus districts. For the combined cooling and power design, the effectiveness of the network is analyzed together with the potential of feeding absorption chillers using the heat from the solar and non-solar energy sources. More than 67% of CO2 emission reduction is achieved through the hybrid heat and solar-driven arrangement.
iv
ACKNOWLEDGMENTS
The doctoral journey is often described as an “independent research”, yet I would have never been able to reach the finishing line without the help and support of the most wonderful network of supervision committee, friends and family, to whom I am indebted with deepest gratitude. It is a great honor for me to have this opportunity to extend my appreciation and to acknowledge the contribution of the people who have helped me during this doctoral research.
First and foremost, I would like to express my deepest gratitude to my supervisor Prof. Fariborz Haghighat who has been very illuminating and supportive to me and provided excellent guidance and encouragement throughout the entire duration of my research. Without his continuous advice, constructive comments, and kind willingness to share his knowledge with me, I would not have reached where I am today with this work in its present form.
I am deeply indebted to my parents, my brother, Mahdi, my sister, Marsa, and her husband, Mohammad, for their patience, continuous support and encouragement. My deepest gratitude goes to my mother and father for their inspiration, encouragement, endless sacrifices and unconditional support. Without their love and understanding, I would not have been able to reach to where I am now.
I also would like to express my gratitude to Miss. Farinaz Haghighat for her valuable comments and suggestions.
Last but not least, I would also like to express my thanks to my friends and colleagues in energy and environment group for their unfailing support and expert advices.
v
TABLE OF CONTENTS
LIST OF FIGURES ... viii
LIST OF TABLES ... xi
SPECIAL SYMBOLS AND ABBREVIATIONS ... xiii
Chapter 1 Motivation ... 1
1.1 introduction ... 1
1.2 Why district energy systems? ... 2
1.3 Current status ... 5
1.4 Design consideration ... 9
1.5 Objective and contribution ...10
1.6 Organization of the current thesis ...11
1.7 Type of the current thesis ...12
Chapter 2 Optimization approaches in district heating and cooling thermal network ...13
2.1 Introduction ...13
2.2 Optimization in district energy systems ...13
2.3 Overview on the mathematical approach ...15
2.4 Recent optimization studies at district level ...17
2.4.1 Distributed integration ...18
2.4.2 Superstructures ...19
2.4.3 Operation and planning ...20
2.4.4 Subsystem building blocks ...21
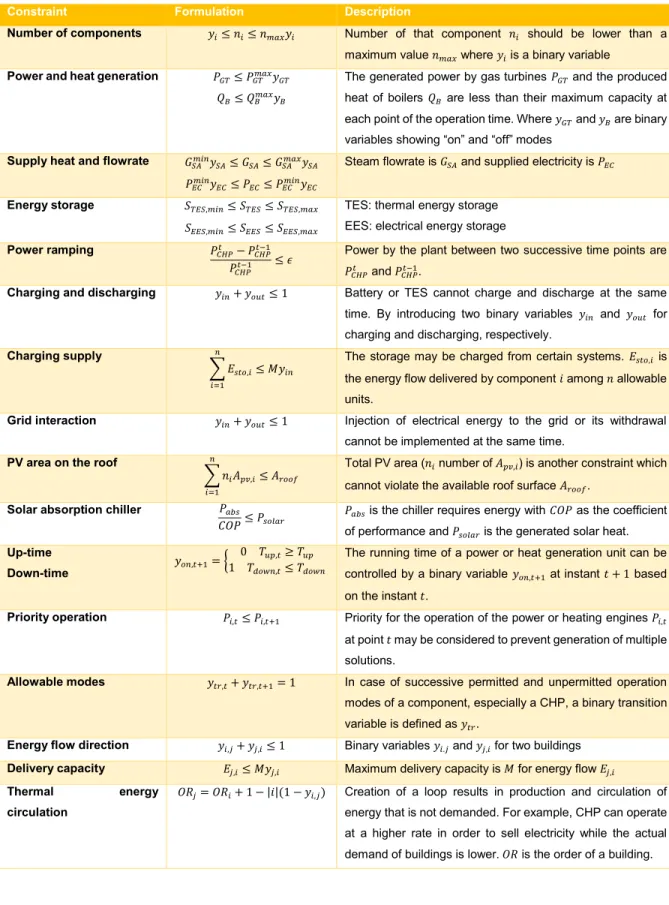
2.5 Formulation of constraints ...25
2.6 Smart grids and districts ...27
2.7 Optimization tools for solving district-level problems ...29
vi
Chapter 3 Optimization of 4th generation distributed district heating system: Design and
planning of combined heat and power ...32
3.1 Introduction ...32
3.2.1 Objective function ...33
3.2.2 Design and planning constraints ...36
3.3 Case study ...40
3.4 Computational results and discussion ...46
3.5 Conclusions ...59
Chapter 4 Integration of distributed energy storage into net-zero energy district systems: Optimum design and operation ...60
4.1 Introduction ...60
4.2 Methodology ...61
4.2.1 Optimization model ...65
4.3 Illustrative example ...68
4.3.1 Energy demand ...69
4.3.2 Electricity and fuel tariffs ...69
4.3.3 Available technologies...71
4.3.4 Available PV area and solar irradiation ...73
4.3.5 Setting of scenarios ...74
4.4 Results and discussions ...74
4.5 Conclusions ...84
Chapter 5 Hybrid solar and heat-driven district cooling system: a method for optimal integration and control strategy ...86
5.1 Introduction ...86
5.2 Model description ...87
5.2.1 Objectives definition ...89
5.2.2 System and component modeling ...91
vii
5.4 Case description and data ...98
5.6 Results and discussions ... 107
5.6.1 Enviro-economic analysis ... 108
5.6.2 Equipment selection and distribution configuration ... 109
5.6.3 Cost analysis ... 114
5.6.4 Energy supply and demand ... 115
5.7 Conclusions and future remarks ... 117
Chapter 6 Conclusions and future remarks ... 119
6.1 Conclusions ... 119
6.2 Future remarks ... 121
viii
LIST OF FIGURES
Figure 1.1: A typical schematics of a district energy system ... 2
Figure 1.2: Primary thermodynamic advantage of district energy systems ... 3
Figure 1.3: Global heat delivery into all district heating systems based on supply approach .... 6
Figure 1.4: Global heat delivery into all district heating systems based on fuel type ... 7
Figure 1.5: Trend for global specific CO2 emissions ... 8
Figure 1.6 Global specific CO2 emissions for several countries ... 9
Figure 2.1 Four main challenges faced by optimization at district level ...14
Figure 2.2 A framework for optimization at neighborhood level ...17
Figure 2.3 Classification of research papers in district optimization ...17
Figure 2.4 Classification of constraints in programming district energy optimization ...25
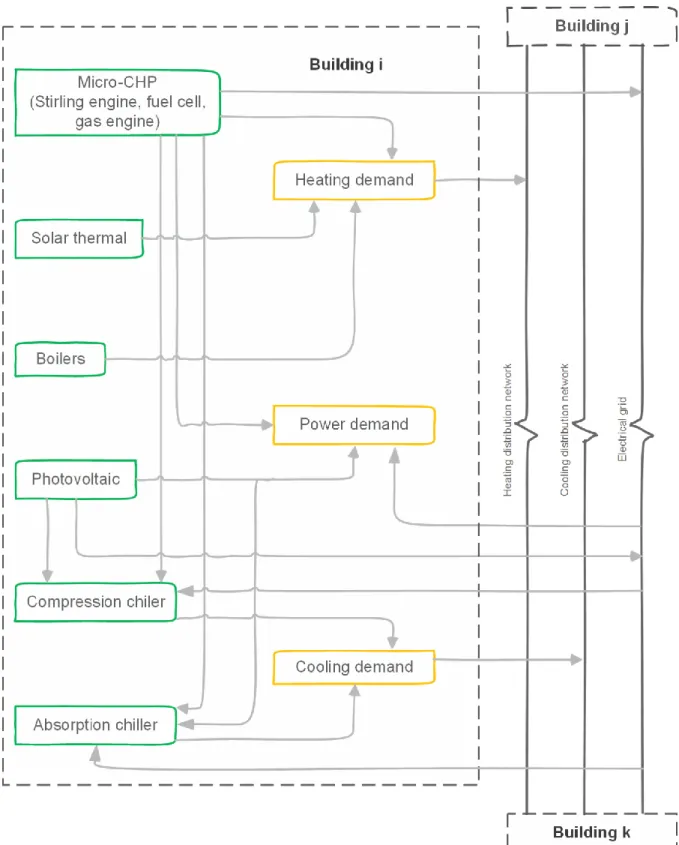
Figure 3.1 Schematics of the in-building supply and demand system and energy exchange among buildings in a district ...34
Figure 3.2 (a) Plan of the Suurstoffi district. White buildings are under construction. (b) Proposed model is applied to the sites with the labels shown. ...41
Figure 3.3 Heat demand of each building in district for each period and season ...42
Figure 3.4 Power demand of each building in district for each period and season ...43
Figure 3.5 Hourly irradiation for typical day of each season and periodic linearization. ...44
Figure 3.6 Optimal location of boilers (scenario 1) ...47
Figure 3.7 Optimal location of equipment (scenario 2) ...48
Figure 3.8 Optimal location of plants and directed heat flow (scenario 3) ...49
Figure 3.9 Optimal location of plants and directed heat flow (scenario 4) ...50
Figure 3.10 Power flow (wire connections) among the buildings in the district for scenario 4. Some energy flows are sideways and some of them are from side to side. (The scaled distances are ignored in this graph to clearly show the connections.) ...51
Figure 3.11 Comparison of CO2 emission between four scenarios ...52
Figure 3.12 Periodic cumulative electricity sold to the grid by generation units ...54
ix
Figure 3.14 Total electricity purchased from the grid in each period (scenario 3) ...55
Figure 3.15 Total electricity purchased from the grid in each period (scenario 4 ...56
Figure 3.16 Rate of heat exchange among the buildings for each period (scenario 3) ...56
Figure 3.17 Rate of heat exchange among the buildings for each period (scenario 4) ...57
Figure 3.18 Sources of heat with their generation rates (scenario 3) ...57
Figure 3.19 Sources of heat with their generation rates (scenario 4) ...58
Figure 4.1 Process of the proposed optimization model ...62
Figure 4.2 Proposed configuration of the neighborhood ...63
Figure 4.3 Overview of the required data in the model and its output ...63
Figure 4.4 Geographic layout of the buildings in Suurstoffi district ...69
Figure 4.5 Relative coordinates and distances among of the buildings in Suurstoffi district ...70
Figure 4.6 Capital cost and technical characteristics of CHP and back-up boiler ...72
Figure 4.7 Available space in each building for PV installation ...73
Figure 4.8: Hourly irradiation for typical days for each season ...73
Figure 4.9 Pareto efficient solutions for design of the district energy system (grid connected without storage) ...78
Figure 4.10 Pareto efficient solutions for design of the district energy system (grid-connected with storage)...78
Figure 4.11 Pareto efficient solutions for design of the district energy system (stand-alone) ....79
Figure 4.12 Optimal lay-out of the net-zero energy district without storage ...79
Figure 4.13 Optimal lay-out of the net-zero energy district with storage ...80
Figure 4.14 Power energy balance throughout the year for net-zero energy district without storage ...81
Figure 4.15 Power energy balance throughout the year for net-zero energy district with storage ...81
Figure 4.16 Optimal state of charge for thermal storage inside all buildings in winter ...82
Figure 4.17 Optimal state of charge for battery bank inside all buildings in mid-season ...83
x
Figure 4.19 Electricity balance of building B7 during a typical day in winter ...84
Figure 5.1 Schematic view of the proposed district cooling integrated with heating and power network ...88
Figure 5.2 Schematics map of the district and the area under study with available solar space ... 100
Figure 5.3 Coordinates of the consumers to be used in determination of main routes ... 100
Figure 5.4 Cooling demands during (a) summer and (b) mid-season in different periods ... 104
Figure 5.5 Electricity demands during (a) summer, (b) midseason, and (c) winter in different periods ... 106
Figure 5.6 A tree representing the branching step ... 107
Figure 5.7 Trade-off between the annual cost and CO2 emissions for grid-connected district cooling system ... 111
Figure 5.8 Optimal thermal connections among the buildings ... 113
Figure 5.9 Various terms of cost objective function ... 115
Figure 5.10 Overall operation and impact of thermal storage media in a hybrid design ... 116
Figure 5.11 Overall annual heat and electricity flow shared among the consumers for lowest emission scenario ... 117
xi
LIST OF TABLES
Table 2.1. Conflict of popular objectives at district level (C: contrast, S: supporting, D: dependent)
...15
Table 2.2 Summary of optimization approaches in some recent studies ...23
Table 2.3 Formulation for some common inequality constraints at district level ...26
Table 2.4 Some common constraints employed in recent district optimization studies ...28
Table 2.5 Optimization programming tools in recent district optimization studies ...29
Table 3.1. Distances between consumers in district (in meters) . ...40
Table 4.2 Basic characteristics and capital costs of candidate equipment. ...45
Table 3.3 Price list for electricity and fuel . ...45
Table 3.4 Carbon tax and carbon intensity. ...45
Table 3.5 Available area on the top of each building for PV arrays. ...45
Table 3.6: Comparison of cost optimization for four scenarios. ...53
Table 4.1 Definition of seasons and periods in the optimization model ...65
Table 4.2 Component and network constraints imposed in the optimization model ...67
Table 4.3 Heat load of each building in the district for each period and season (kW) ...70
Table 4.4 Electricity load of each building in the district for each period and season (kW) ...71
Table 4.5 Electricity selling and buying tariffs for each period and season (€/kWh) ...71
Table 4.6 Basic characteristics and capital costs of candidate equipment ...72
Table 4.7 Technologies implemented and their sizes for the optimized net-zero energy district without storage...79
Table 4.8 Technologies implemented and their sizes for the optimized net-zero energy district with storage ...80
Table 4.9 Technologies implemented and their sizes for the optimized stand-alone district with similar emission as net zero-energy district with storage ...80
Table 5.1 Setting the scenarios by inclusion (■) and exclusion (□) of components...99
Table 5.3 Division of the year into three equalized seasons... 101
xii
Table 5.2. System components and technical specifications... 102 Table 5.3 Optimal configuration of the equipment for representative solutions ... 111
xiii
SPECIAL SYMBOLS AND ABBREVIATIONS
Latin symbols
𝐴 pipe, surface area of Surface area of thePV (𝑚2) 𝐼
Income (US $), Carbon intensity
(kg/kWh)
𝐴𝐹 Annuity factor 𝑆𝑂𝐶 State of charge
𝐶 Cost (€) 𝑁 Lifetime (years)
𝐶𝑂2 CO2 emission (𝑦𝑒𝑎𝑟) 𝑘𝑔/ 𝑝𝑙𝑜𝑠𝑠 Pressure losses for a 1 meter long pipe (𝑃𝑎)
𝑑 Distance (𝑚) 𝑅 Consumption rate (𝑊)
𝐸 Power flow (kW) 𝑟 Interest rate of a device i 𝑝 Price of energy carrier 𝑆 Solar irradiation (kW/m2) 𝑊 Binary variable for selling/purchasing
power 𝑇 Temperature (℃)
𝐺 Nominal capacity (kW) 𝑋𝑖,𝑗 represent connection Binary variable to between the nodes
𝑅 Binary variable for thermal storage 𝑌𝑖,𝑗
Binary variable to represent the existing
connections between the nodes
𝑂 Binary variable for chiller 𝑋 Binary variable for CHP 𝑄 Heat flow (kW) 𝑌 pipeline connection Binary variable for 𝐶𝑇 Carbon tax (€/kWh) 𝑍 (compression) chiller Binary variable for
𝐵 Binary variable for battery bank 𝑈 Binary variable for boiler 𝑇 Binary variable for wire connection and
absorption chiller 𝑉
xiv
Greek symbols
𝜅 A constant 𝛿 Number of hours in each
period
𝜂 Efficiency 𝜁 Heat to power ratio
𝜎 Percentage of heat loss 𝜃 Slope
𝛼 Interest rate ∆ Duration (hour)
Subscripts and superscripts
ac Absorption chiller TS Thermal storage
ct Carbon tax tot Total
cc Compression chiller inv Investment
dem Energy flow to cover building’s demand op Operation out Discharged energy max Maximum capacity
pipe pipleline BB Batter bank
power Electricity demand m Number of chillers
q Type of PV Up Upper bound
r Type of solar thermal collector loss Energy loss in network
hs Heat storage max Maximum capacity
l Type of compression chiller min Minimum capacity m Type of absorption chiller t Period number
cold Cooling energy tech Technology used
sto Stored energy ub Upper bound
car Carbon emission n number of equipment Number of years,
elec Electricity k Type of CHP unit
pur Purchased sol Solar
sel Soled chil Chiller
𝑖, 𝑗 Building number s Season
PV Photovoltaic array used Self-used energy
B Boiler grid Utility grid
CHP Cogeneration unit Gas Fuel (natural gas)
heat Heating demand Lo Lower bound
Abbreviations
HER Heat to electricity ratio DHS District heating system CHP Combined heat and power DCS District cooling system COP Coefficient of performance CRF Capital recovery factor TES Thermal energy storage EER Energy efficiency ratio
1
Chapter 1
Motivation
1.1 introduction
In the past, buildings were typically designed singly because the energy had low price. Designers did address the extraction of energy sources situated far away from the consumer site and the environmental impacts of their depletion, utilization and transportation as major issues. Engineers did not put considerable effort into finding opportunities to save energy at both generation and consumption sides. Instead, engineers dealt with the issue of guaranteeing various services and to provide acceptable indoor environment both in term of thermal comfort and indoor air quality. Recent advances of efficient thermal prime movers along with their interactions with renewable energy sources for distributed generation are changing the approach of power and heat generation from conventional large centralized plants to local generation units scattered over the neighborhood. The design and planning of the future sustainable energy systems comprising 100% of renewable resources is studied in a number of recent papers and technical notes [1, 2]. These systems are basically designed as a combination of intermittent renewable energy resources such as solar, wind, and geothermal along with the fuel resources such as waste and biomass on which there are some environmental issues about their utilizations.
When there is a group of buildings, up to a whole city, with its heating, cooling, hot water, and electricity fulfilled by a piece of integrated energy generation equipment, there is a need for a distribution network. The existing utility grid may be utilized for supplying electricity, however, for heating, cooling, and hot water, a distribution pipeline network should be designed and implemented. In other words, the resulting system, called district energy system, is defined as a system made up of several integrated poly-generation plants (units), along with the required
2
distribution network and sub-networks, providing a number of buildings with their energy demands i.e. heating, cooling, hot water, and power as shown in Figure 1.1 [3].
Figure 1.1: A typical schematics of a district energy system [3]
A district energy system may incorporate one or several micro-grids, which can operate autonomously or interact with the electricity grid. It comprises of three main constituents: production, storage and demand. The micro-grid supplies the buildings in a reliable and sustainable way and takes advantage of the environmental resources available in the area nearby to improve the overall efficiency of the system. Control and balance between generation sides and district demand is one of the main goals about the micro-grid. The production generally includes technologies such as solar thermal or electricity, wind turbines, fuel cells, gas engines, and micro turbines. These equipment can operate smoothly together in a way that provide the district with the required electrical and thermal energy demand. Various types of combinations of the technologies can be implemented to cover the energy demand for a group of industrial, residential and commercial buildings.
1.2 Why district energy systems?
The optimal design of a building is generally carried out by keeping the boundaries of the system under analysis within the single building. However, based on the boundaries considered, there may be major changes in level of comfort, efficiency and selection of the best system to supply the energy requirements. As a matter of fact, a building is hardly ever isolated from other buildings; instead, it is generally surrounded by other similar or different constructions with which it can interact. By extending the boundary of the analysis to the level of neighborhood or district, there
3
can be a chance to increase the level of sustainability and efficiency. Basically, merit of district energy systems can be expressed in three different categories:
Thermodynamic aspect: Reasonably low-temperature sources of less than 200℃ is required not only in residential and commercial buildings for the purpose of space heating but also various industrial applications calls for this range of temperature. Currently, a considerable portion of this heating demand is covered by combustion of oil, coal, natural gas or by electricity. However, combustion of those fossil fuels brings in temperatures far above those temperatures really required for residential heating or different process steam utilization [4]. From the thermodynamics point of view, the differences in temperature among combustion products and heat requirement provide the opportunity to carry out mechanical work or generate electricity. However, in the above-mentioned case, the low-temperature supply does not give such an opportunity. Moreover, utilization of electricity to generate low-temperature heat represents an inconsistency between high-quality and low-quality forms of energy supply and demand. A thermodynamically preferable idea is to take advantage of the temperature difference to generate electricity and utilize the waste heat from the condenser or turbine to cover low-temperature heat. As a result, using fuel through this process is improved drastically [5]. The overall thermal efficiency is defined as the ratio of the fuel converted to power together with the ratio of fuel converted to useful heat. Generally, cogeneration systems provide an overall efficiency in the range 65% to 90% as illustrated in Figure 1.2 [5].
4
Economic aspect: The main economical merit of implementing a district energy system is its lower heating costs in a case of higher international fuel tariff or in a case of higher taxes or fees due to the consideration of environmental impacts as damage costs [6]. The costs associated with heat distribution are lower in dense areas with concentrated heat demands compared to suburban and rural areas with scattered heat demands in which the competitiveness decreases. The benefit of thermodynamically improved use of fuel and hence decreased fuel and operating costs happens at the expense of extra investment costs for supply and distribution infrastructure. In other words, the economic viability of district energy systems is usually a trade-off among higher initial investment but lower cost for fuel and operation versus lower upfront costs and higher cost for fuel in conventional energy systems. The economic benefits and limitations play a key role in the choice of implementing a decentralized or centralized district energy system. From an economic point of view, society can enjoy several advantages of decentralized poly-generation energy systems. Consumers may benefit the option of best cost effective configuration that matches their site perfectly [5]. In remote or rural areas an autonomous micro grid could be a more cost efficient alternative instead of extending the traditional main grid. The implementation of a poly-generation system in developing countries cannot only increase the average standard of living but can also result in new business opportunities for the community [7]. It is reported that 1.2 billion people around the world did not get access to electricity in the year 2012 [8]. To provide a number of those houses without access to the traditional electricity grid, various micro-grid plans has been carried out at these local areas. It also leads to generate income among many deprived areas.
Environmental aspect: When large combustion power plants are substituted for several smaller boilers inside or outside the buildings, the quality of air will drastically increase. Moreover, the mortality risk from very low and high ambient temperatures, which is common among all kinds of district heating and cooling systems [9]. Recycling of heat according to the notion of co-generation results in no or very small peripheral emission of CO2. Therefore, substantial lower emissions are generated when conventional fossil primary energy system replaces recycling heat supply, which prevents waste of heat [10]. Beside heat recycling, utilization of green energy resources, such as solar and wind, in district energy system results in reduction of environmental damage and achievement of sustainable goals.
5
1.3 Current status
The total number of district energy systems all over the world is about 80 000 where 6000 systems operate in Europe [11]. Annual global amount of heat injected into district heating systems are illustrated by several supply categories in Figure 1.3 [12]. A reduction in heat deliveries can be seen in the middle of 1990s because many industrial consumers in Russia were disconnected from the network due to the changes in economic policy. The annual heat supply starts to increase from 2000 with a mean growth rate around 1%, due to the China’s expansion plan for district heating system [12, 10]. However, European Union shows a nearly unchanging annual heat delivery since 1990. Removing some consumers and hence reduction in heat supply due to the former economic policy in Eastern Europe were balanced and compensated by new consumers in other parts of the world. It is concluded that the heat supply through district heating systems has not changed significantly and it has not shown the same growth rate for the entire expansion of energy systems around the world [12, 6]. Regarding different ways of heat deliveries, the European Union recycles more heat (72%) and extract more renewable heat (27%) in comparison with the global proportions in which the proportions of recycled heat and renewable heat are around 56% and 9%, respectively. The explanation is that the proportion of CHP units in China and Russia (almost 50%) affects the low global volume of recycled heat [10]. The above numbers for recycled heat shows that the heat supply is primarily provided in large boilers by direct utilization of fossil fuels. In other words, the basic idea of implementation of district heating is not fully addressed in those large countries [12, 6]. Thermal energy storage is sometimes implemented to smooth daily variations in heat demand. The seasonal thermal storage virtually never had the chance to play role in district energy systems; however, new solar district energy systems in small towns and villages in Denmark recently implemented relatively high-capacity thermal storages in combination with their systems [13].
6
Figure 1.3: Global heat delivery into all district heating systems based on supply approach [12, 10]
The types of energy resource utilized in district heating are illustrated in Figure 1.4 with no description of heat delivery approach as discussed earlier in Figure 1.3. It is still obvious that the percentage of heat delivery through fossil fuels still remains very high. The proportions for the world and European Union are around 90% and 70%, respectively, because fossil fuels continue to be the primary group of energy supply for both boilers and CHP units. For example, Natural gas and coal are the primary fuels in Russia and in China, respectively. To achieve a future reduction in CO2 emissions from boilers and CHP plants, current plants should substitute with modern heat resources independent from fossil fuels. An example of such new sources is the recovered heat by waste incineration, called waste-to-energy, which has been implemented in several district systems around the world [14]. In 2014, waste-to-energy application provided 400 PJ in the world where European Union contributed 208 PJ heat [12]. Industrial processes give a great opportunity for heat recycling when they produce excess heat. The idea requires a systematic heat cascading procedure to be integrated in a district and has been successfully implemented in some countries such as Germany, Sweden, and Russia [15].
7
Figure 1.4: Global heat delivery into all district heating systems based on fuel type [12, 10]
The estimated specific CO2 emissions per year caused by operation of district heating systems are expressed in Figure 1.5 separately for the world and European Union [12]. In the analysis, it is assumed that each 1 MJ heat from natural gas, fuel oil, and coal release 56, 76, and 95 grams of CO2, respectively [16]. Analysis of Figure 1.5 leads to two main conclusions:
(1) One of the findings is that since 1990, the specific CO2 emissions in the world stay nearly fixed on a level of 55 grams per each 1 MJ heat supplied. The total annual CO2 emission in 2014 was estimated to be 604 million tons, which is almost 15% lower than the emissions released by combustion of only natural gas as the heat source. However, this large volume of emissions is a result of the low share of CHP units of almost 50% in both China and Russia [10]. In the few past years, China expanded several district heating with coal as a fuel, which counteracted the lower emission strategies in other countries. Russia also did not adopt any approach to increase the share of CHP units in it future heat supply plan [17].
(2) Currently, European Union releases 40% CO2 emission less than the average emission in the world. In 2014, the average specific CO2 emission accounted for 31 grams per 1 MJ of supplied heat resulting in 59 million tons CO2 as total emission. The European Union accomplished to decrease its specific emissions by 35% during 24 years (from 1990 to 2014). The explanation for
8
this achievement is increasing the share of CHP units and renewable sources in the heat delivery plan. This brief analysis shows how the European Union fulfil the goal for expansion of district heating systems to higher level compared to other parts of the world.
Figure 1.5: Trend for global specific CO2 emissions [12, 10]
In Figure 1.6, the combinations of the specific CO2 emissions and the total share of recycled heat and non-fossil sources are illustrated for the world and European Union together with 47 countries with considerable annual heat supplies with more than 1 PJ per annum [12]. The high level of specific CO2 emission in China arose from utilization of coal as the primary fuel as well as the low share of CHP units in the heat supply plan which is analyzed by Yu et al. in a study focusing on the current and future status of CO2 emissions in the urban area of Beijing [18]. Iceland takes the greatest position in European Union with no CO2 emission since geothermal energy is their dominating heat supply. Both Norway and Sweden are very close to the Iceland.
9
Figure 1.6 Global specific CO2 emissions for several countries [12, 10]
1.4 Design consideration
In the planning step to design a sustainable district, a key factor to consider is associated with the sustainable way of energy supply. Buildings in the district require energy to maintain a favorable indoor environment condition through space heating, cooling, and ventilation, and hot water for domestic purposes, or provision of facilities such as electric lighting. It is important to mention that to achieve a successful design of new district energy systems, especially when power requirement is also included, the following considerations need to be taken into account. The size of the technologies has great importance since the district energy system is a combination of different technologies and units where the technologies should operate together to satisfy the demand. To achieve that goal in the most efficient way, the energy requirements of the consumers need to be consistent with the design size of the combination of the technologies and plants. Assurance of the best scheduling ad co-operation of the supply side of the district energy system should be provided to attain best operation with respect to the desired objective(s).
10
1.5 Objective and contribution
The centralized or decentralized energy source and the energy distribution network(s) comprises the two major intensive components of the district energy systems. Therefore, it is of upmost importance to identify the role and structure of these two elements in the design especially when future district energy systems are investigated. The goal of this research is to find the best combination of technologies or related capacities to satisfy the energy requirements in a sustainable (lower emission) and economically feasible way while the energy demands of the buildings making up a district. This gives the decision makers the ability to select the mix of technologies or their sizes to further analyze the design stage.
Current study shows novelty in several aspects: first, it is remarkable to mention that very few papers deal with the issue of the design of the heating, cooling, and power distribution among the consumers i.e. the way that buildings are connected to each other in a district is not fully addressed. In other words, the layout of the network and the heating, cooling, and power units are usually predefined in the literature for the operation optimization. The configuration of the network plays an important role in designing future districts because of two main reasons: (1) high investment in pipelines, especially in cold water pipelines, and (2) indirect effect on the operation and costs. This part of the model also includes the selection of the technologies. In other words, district energy systems can show to be inefficient when the required energy density is too low. However, no earlier work could be found that compute the optimal energy system for a district by comparing district energy systems versus individual energy systems. Second, simultaneous optimization of design and operation of a district has not been well studied. It means that literature focuses on only the network or the operation of the equipment in a district without noticing that these two are in fact interconnected and affects each other. Finally, the network analysis in this study considers all the terms related to costs. For example, pumping cost and costs corresponds to the network design are also taken into account.
It is important to mention that most of the earlier studies concentrate on matching supply and demands without considering any storage medium in their design or model. Moreover, energy storage in decentralized district energy systems have not been studied well especially when the design and operation of the storage system are accompanied by sizing, locating, and load allocation of other technologies implemented on the site. Current research addresses the aforementioned issues by presenting a comprehensive economic and environmental multi-objective optimization model for the investment planning of heat and power district energy systems emphasizing on thermal and electrical storage. The set of optimal solutions opens up an
11
opportunity to analyze the optimal design of a net-zero energy district and a stand-alone district and investigate the effects of storage and energy exchange on cost and CO2 emissions. Definition and analysis of net-zero energy district are totally new fields in the area of future sustainable districts where its simulation and optimization is carried out for the first time in the current study. Moreover small number of the earlier research dealt with the issue of the optimal combination of heating and cooling sides to achieve the best performance of the overall system in terms of cost, emission, or efficiency. In other words, by considering several heating and power sources to supply the chiller units, their integration must take into account their characteristics, operating costs and technical constraints. As a consequence, even with a limited number of plants, the best solution to the location, type and size of the hybrid technologies as well as the optimal control strategy in which the district plants operate to incur the lowest cost or exploit the highest available share of renewable sources, or other desirable goals. The current work concentrate on finding a solution to the following issues by proposing a mathematical approach: (1) optimal integration of heating technologies into district cooling, (2) optimal layout of the cooling grid, and (3) optimal control of the chilled water flow and storage media.
1.6 Organization of the current thesis
This thesis is organized into six chapters. Chapter 2 presents different types of optimization problems, constraints and techniques as well as the optimization tools used in district energy systems, and provides a comprehensive literature review. Objective functions at the district level are typically: carbon emission, production, revenue, operation costs, investment, fuel costs, and renewables exploitation. Contradiction of the objective functions is presented as a multi-objective problem. Then the effects of the distribution networks (both thermal and electrical) on overall cost are studied in Chapter 3 on a real case study. In other words, chapter 3 presents a mathematical programming procedure to model the optimal design and planning of a new district focusing on the energy exchange among the buildings. The aim of the computational model is to find the best way to select the equipment among various candidates (capacities), the pipeline network among the buildings, and their electrical connections. Chapter 4 presents the findings for comparative analysis among different scenarios with and without thermal and/or electrical storage to study the effects of load shifting on the total cost and emission of a new design. Both thermal and battery storage are considered in decentralized implementations and a set of optimal solutions are
12
illustrated as a Pareto front. Two important solutions showing net-zero energy districts are analyzed as well as a stand-alone district.
In chapter 5, a mathematical optimization model is tailor-designed for design of a new district cooling energy system fed by the combination of heating supply equipment, which takes into account the scheduling at the same time. An optimization methodology is proposed and tested on a real district cooling system with seven buildings.
Chapter 6 concludes this thesis with a summary of the key findings reported in all preceding chapters, and is followed by some recommendations for further research for better optimization models to include more details and results in more efficient design.
1.7 Type of the current thesis
This dissertation is a manuscript-based thesis in which the contents of the chapters 2 to 5 are part of the published journal papers in high-quality journals in the area of energy engineering as:
Chapter 2:
Sameti, Mohammad, and Fariborz Haghighat. "Optimization approaches in district heating and cooling thermal network." Energy and Buildings 140 (2017): 121-130.
Chapter 3:
Sameti, Mohammad, and Fariborz Haghighat. "Optimization of 4th generation distributed district heating system: Design and planning of combined heat and power." Renewable Energy130 (2019): 371-387.
Chapter 4:
Sameti, Mohammad, and Fariborz Haghighat. "Integration of distributed energy storage into net-zero energy district systems: Optimum design and operation." Energy 153 (2018): 575-591.
Chapter 5:
Sameti, Mohammad, and Fariborz Haghighat. “Hybrid solar and heat-driven district cooling system: Optimal integration and control strategy.” Solar Energy Under Review.
13
Chapter 2
Optimization approaches in district heating
and cooling thermal network
2.1 Introduction
Modelling, simulation and optimization of an isolated building separated from the district in which they operate is no longer of interest as a viewpoint of improved efficiency, economic benefits and exploitation of renewable energy resources. Instead, district energy systems have the capacity to obtain several benefits, regarding the practical, environmental and safety by taking advantage of large poly-generation energy conversion technologies. The use of optimization techniques to design such high-efficient systems is strongly motivated by minimizing of the cost for the required infrastructures, minimizing emission, and maximizing the generation or efficiency but is particularly challenging because of the technical characteristics and the size of the real world applications. In this chapter, different types of optimization problems, constraints and techniques as well as the optimization tools used in district energy systems are discussed.
2.2 Optimization in district energy systems
A district energy system is able to simultaneously satisfy the demands of local buildings by providing on-site electricity, heating, and cooling [19]. The adoption of district energy systems exhibits several benefits. It allows for a reduced transmission losses through on-site generation, increased conversion efficiency, utilization of waste heat, reduction in constructing large generation plants, mitigation of emission problem and associated economic profits, and exploitation of renewables [20] [3] [21]. These systems may split into two categories:
14
decentralized and centralized [22]. In the former, which is most suitable for large-scale areas, energy conversion technologies are integrated in almost every building, and then are distributed among various buildings in an area. In the latter, which is better for relatively small, energy conversion technology is adopted outside the buildings and then the energy flows towards the buildings via a distribution network [23]. The rational design and planning of district energy systems have a pivotal role to achieve maximum energy saving/efficiency and maximum economic benefits of implementation of such systems [24]. However, as Figure 2.1 shows, achieving these goals is a complex task for several reasons [25].
Figure 2.1 Four main challenges faced by optimization at district level
Allegrini et al. [26] presented a review on simulation approaches and tools for energy systems at district level. Olsthroom et al. [27] reviewed the integration of renewable energies into district heating and storage technology. Lake et al. [28] reviewed the implementation of district heating and cooling in real case studies. Lund et al. proposed the concept of 4th generation district based on integration of smart thermal grid and its role in future networks [29, 30]. In contrast to previous reviews on district heating and cooling, current study deals with the optimization of such systems. This chapter first gives an overview of the mathematical approaches of the problem, and it then discusses different areas of applications at district level, and the constraints used in the formulation of the problem. Finally, it briefly discusses the existing optimization tools used in this area.
It includes both permenant aspect associated with the location and temporary aspects associated with loads, production, and price profiles.
Many combinations can be considered for locations of buildings, size of energy units, and linkage between the end users among possible candidates.
The demand profiles vary in a stochastic manner with time requiring much more sophisticated techniques to tackle the multi-period problem.
Temperature of the heating and cooling requirements is subject to high flactuations.
15
2.3 Overview on the mathematical approach
Considering more than one objective function at the same time may result in conflict between them. For example, minimization of the cost and pollutant emissions is usually conflicting [31]. Table 2.1 shows most popular types of optimization objectives used at district level and their conflicts. Mathematical programming methods have been employed in wide range to make decision regarding the optimum design, planning and operation of district energy systems. Mathematical models for optimization usually lead to structured programming such as Linear Programming (LP), Mixed Integer Linear Programming (MILP), Non-Linear Programming (NLP), and Mixed Integer Non-Linear Programming (MINLP) [32] [33] [34].
Table 2.1. Conflict of popular objectives at district level (C: contrast, S: supporting, D: dependent) Objective functions Maximum revenue Minimum emission Maximum production Minimum operation costs Minimum investment Minimum fuel cost Maximum renewables Maximum revenue * C D C D C D Minimum emission C * D C C C S Maximum production D D * C C C D Minimum operation costs C C C * C S C Minimum investment D C C C * S C Minimum fuel cost C C C S S * C Maximum renewables D S D C C C *
If the objective function and the constraints are linear, the problem is said to be linear. Otherwise, the problem is called a nonlinear problem [35]. Mixed-integer linear and nonlinear programming involves both continuous and discrete variables arise in many applications of engineering design. Roy et al. [36] investigated the characteristics and details of each algorithm for engineering design. However, the detailed description of each algorithm is beyond the scope of the present
16
thesis. Direct search techniques choose the best solution at each iterative by comparing the results and move to the next step based on the current results [37, 35]. The techniques are typically efficient, however, they may find local solutions instead of the global one. In some cases, for example when the objective function (cost function) is not convex and not smooth in terms of the decision variables [38], typical gradient-based optimization methods fail to solve the problem. Therefore, evolutionary algorithms are required which are based on the Darwinian principle to remove the poorest solutions in each generation. Common operators are employed to make new generations of solutions. Genetic Algorithms (GA) [38, 33, 39, 40, 41] are widely used especially to optimize subsystem building blocks of a district. The most popular implementation for multi-objective problems is NSGA-II [42]. It is a popular option to establish the optimal heating/cooling distribution configuration by randomly generating many network designs for the entire district. Other popular method within the optimization of energy systems is to employ more than one technique in a hybrid optimization [43, 44]. A near optimal solution is found by applying a global-search technique and the result helps another technique to find the local optimum solution. Both single and multi-objective studies are included in the literature [45, 46]. A well-known method to tackle the multi-objective problems is to rewrite the several objectives in the form of only one function using constant weights [47] [48]. One main drawback of the method is that the solution to the optimization problem is not uniform. Another drawback is that the method fails in non-convex regions [49]. As the engineering viewpoint, the weighted sum approach is an efficient and easy-to-use method, however it calls for an expert in the field to identify the weight factors and compromise between the functions [50].
Within the time frame, district optimization problems may be split into two groups: (1) short-term problems which the operational management of the system is analyzed within a given period (typically one day/week/year); (2) long-term problems in which the formulation and analysis is carried out over the whole life cycle [51]. Decision variables represent the degrees of freedom in the optimization model. They include both binary and continuous variables. Binary variables define existence of a component or its operation status (on/off) [52]. A general framework of the optimization procedure at district level is given in Figure 2.2. This overview is applicable to a wide range of district configurations and framework conditions which can be represented by a group of input parameters.
17
Figure 2.2 A framework for optimization at neighborhood level
2.4 Recent optimization studies at district level
The scientific literature for optimization approaches at district level can be classified into four main topics as illustrated in Figure 2.3. In the following sections, the most recent publications regarding each category are discussed.
Figure 2.3 Classification of research papers in district optimization • Energy demand profile
• Energy prices • Generation profile • Legislative framework • O&M and equipment costs • Weather data • Energy resources
• Energy technologies and performance • renevation options
• Energy subsidies for wind turbines and PVs
Inputs
• Minimize overall cost • Maximize efficiency • Maximize profit • Minimize emission
• component, energy, and network constraints
Mathematical
programming
• Selected technologies • Optimal schedule • Optimal layout • Comparative analysis:Network, storage, conventional • Sensitivity
Outputs
Optimization in district energy systems
Distributed integration Superstructures Operation and planning Subsystem building blocks
18
2.4.1 Distributed integration
Distributed integration deals with the connection of energy resources to the district energy system to provide reliable, sufficient, economic and environmental-friendly power generation. The complexity of the integrated system associated such as CHP or heat pump [53] with the energy planning within the district calls for optimization analysis. Two major aspects recently draw attentions for economic optimization of CHP systems: developing accurate models and providing effective mathematical solvers [54]. Sartor et al. [55] developed a nonlinear programming (NLP) and proposed a quasi-steady state model based on thermodynamics, combustion processes and heat transfer intended to accurately estimate the performances of a biomass CHP plant integrated with a district heating system. The authors used optimization to calibrate their model based on an existing plant. Wang et al. [56] employed a linear programming (LP) technique and studied a CHP based DH system with RES and developed a modelling and optimization method for planning and operating such CHP-DH systems. The objective of the optimization was to minimize the overall costs of the net acquisition for heat and power in deregulated power market. The optimization model for the CHP-DH system was efficiently simulated in larger time scale (monthly horizon) rather than typical days of the years. In a study by Ondeck et al. [57], the authors adopted MILP and investigated the optimal integration of a CHP plant as a utility producer at a neighborhood level. The optimum operation for combination of CHP with PV is also investigated for predominantly cold climates. The authors considered fluctuations in energy rates, ambient conditions, and demand level as well as the day-ahead price in their economic study. Falke et al. [33] proposed a decomposed optimization solution to a multi-objective problem with an integrated economic and ecological objective function to reduce computation complexity of similar problems. The authors used Kruskal and Genetics Algorithms to tackle the problem. The optimization model comprises of three stages: (i) heating network design, (ii) generation plants, storage systems and renovation measures, and (iii) operation of the generation plants and storage systems. Weber and Shah [58] took MILP and proposed a tool, called DESDOP, to find the optimal combination of technologies to meet the energy demands of an eco-town under different scenarios. The authors did not consider uncertainty of the energy sources (especially wind) in their models. With a different methodology, Sameti et al. [59] presented a techno-economic model and multi-objective optimization taking Pareto approach and genetics algorithm to analyze a CHP system integrated with gas turbine to be used in a low-energy community. Uris et al. [60] studied the optimal sizing of a cogeneration unit with ORC (organic Rankine cycle) supplied by biomass taking NLP approach. The authors tried to achieve maximum profits when the system is integrated to an existing district system. Operation of the co- and tri- generation systems were considered
19
under full and partial loads and climatic severity. A similar simulation work including thermal storage was presented in a study by Noussan et al. [61], without considering optimization, in which the exergetic and economic criteria were studied. However, as the authors stated, the optimal results are different from existing configuration. Maatallah et al. [44] employed HOMER and its hybrid optimization feature to get the optimal share of a hybrid PV/wind/diesel with and without battery storage. Similar study to electrify a rural area was carried out with HOMER without considering storage but including hydropower in the analysis [43].
2.4.2 Superstructures
The main output for optimization problem in this category includes the existence and size of each component/technology based on suggested scenarios. This is usually followed by an optimal operation for a case study in which the goal is to decide which engines, chillers, CHP etc. at which capacity and at which point during the time horizon should operate. In this section, a review on the most recent studies is carried out. In a study by Mehleri et al. [62] a mixed-integer linear programming (MILP) model by Genetics Algorithm (GA) is presented where the objective is to find the optimal selection of the system components among several candidate technologies (micro combined heat and power units, photovoltaic arrays, boilers, central power grid), including the optimal design of a heating pipeline network, that allows heat exchange among the different nodes. A similar work was carried out by Wu et al. [48] in which they proposed a MILP model allowing determination of the energy generation components among various candidates, the site and size of each selected technology, optimal running schedule, as well as optimal layout of heating pipelines. They made a comparison between three different scenarios: CON (conventional), DES + HSN, DES + TES. Li et al. [47] proposed a model in which the objectives were to minimize the total annual cost and CO2 (carbon dioxide) emission and achieve the optimal design and operation to meet the yearly energy demands for heating, cooling, and power. Bordin et al. [63] optimized selection of the set of new users that were connected to an existing district network during time horizons of five and ten years. They adopted Opti-TLR to build a MILP model. The model tried to maximize revenues and minimize operating and investment costs using fundamental of graph theory. Ameri and Besharati [64] compared four separate scenarios (conventional, CCHP without network, CCHP with network, and CCHP/PV with network) among several components candidates to achieve the minimum equivalent CO2 emission and cost saving. Rivarolo et al. [65] used their own developed software (W-ECoMP) and performed a thermo-economic analysis for a smart micro-grid in time-dependent conditions and carried out a
20
hierarchical optimization using penalty method for both the sizing and the planning of all plant units. Two different co-generation and two different tri-generation layouts were considered to find the best solution. In another optimization study by Buoro et al. [52], a MILP model was proposed in commercial software Xpress for a distributed supply system included both centralized (CHP, boiler, and solar) and decentralized (CHP, chiller and boiler) technologies focusing on the solar power plant. They considered four different types of thermal storage including tank, pit, borehole, and aquifer. Karschin and Geldermann [66] adopted MILP approach in Xpress and focused on maximizing local bioenergy production of biomass system considering different ways of connecting customers to the supply grid as well as the design of the heating network and plants, cost, heat loss, and the legislation of the country. They compared five different scenarios.
2.4.3 Operation and planning
Even with a limited number of units, the definition of a planning strategy controlling the district plants to run at minimum cost or exploit the maximum possible share of renewables is not a simple task. Vesterlund and Dahl [67] employed ReMIND and CPLEX to tackle the MILP problem of the hydraulic performance of a district distribution system. They introduced a new process integration technique which allows the modeling of DHSs with loops (closed path for a fluid flow), without introducing any simplification or modification to their physical structure, modeling of DHSs containing of multiple sources of thermal energy production and redesign of the DHS structure, in particular to add or remove consumers. In an LP model proposed by Wang et al. [68], an energy integration system was studied named smart hybrid renewable energy for communities (SHREC). Their model took into account non-sudden starting and shutting down of CHP. Carpaneto et al. [69] developed an optimization procedure in MATLAB and investigated different scenarios for using renewable energies in district heating networks. The focus of the study was on solar energy, however, CHP, boiler, and storage were also considered. Wang et al. [70] employed Newton’s method for a NLP problem to minimize the cost of a district heating system (an N-floor building) based on separate mass flow rate (pumping cost) and thermal conductance (heat exchanger cost). One drawback of their modelling is that it requires very long computational time when large networks are taken into account. Therefore, a tool is required for the model to be applicable in larger districts. Next, the temperature drop along the feed line for users in each floor results in non-uniform distribution of thermal energy, which is not favorable. Khir and Haouari [71] presented computational experiment for a MINLP model to optimize the design of a district cooling system based on the size of chiller units, cold thermal storage, and layout of the main piping network.
21
Besides the usual technical and operational constraints, the authors considered temperature and pressure drop in their model. Zhou et al. [72] proposed and compared two mathematical models to minimize the total annual cost of a combined cooling, heating and power system (CCHP) based on two assumptions: constant efficiency and off-design characteristics of different components. Powell et al. [73] presented a dynamic optimization to find the optimal charging/discharging time for thermal storage, which is used to shift cooling and electrical loads. Three scenarios were considered for costs: fuel-only, fuel with revenue from selling excess power, and fuel with both purchasing and selling. Jie et al. [74] introduced an optimization model to minimize the sum of pumping and heat loss costs for an existing district heating system. Four different strategies were considered and compared based on considering constant or variable flow rates for primary and secondary sides of the district. The best solution is when both the primary and secondary mass flow rates are under controlled. Jiang et al. [75] proposed a model considering wind turbine as one of the energy sources for electric water heater besides using solar water heater and gas-fire boiler. The authors minimized fuels consumption (kilogram coal equivalent) based on boiler’s set-point temperature and flow rate of the variable speed pumps. Ren et al. [76] developed an optimization for optimal planning of a grid-connected hybrid PV/fuel cell/battery district energy system to minimize both annual CO2 emission and running costs. An extra constraint the authors considered is that the simultaneous buy-back and selling electricity is prohibited as a policy. The dynamic grid price, as a pivotal role, was neglected in the simulation. Fang et al. [38] proposed a static model to find the optimal plant supply temperatures and load allocation among the plants based on the real-time end-user measurements to optimize heat production planning. Automated meter reading data was employed to approximate the heat losses, flow rates, and nodal temperatures within the network. Kim et al. [77] considered several district systems simultaneously. They tackled the problem of combining and optimization of eleven real-world district heating systems to achieve minimum total cost and maximum profits. But their model did not include any pumping cost and storage and network losses for the sake of simplicity.
2.4.4 Subsystem building blocks
Other optimization studies have been conducted focusing on specific technical aspects of the components or building blocks of the district system. Jie et al. [78] proposed an analytical model
22
to find the optimal pressure drop and related minimum annual cost for the distribution network in district heating based on operating variables and different strategies. Wang et al. [79] used optimization (genetics algorithm) to calibrate their model for steady-state distribution of thermal energy through pipes in a network. Their mathematical model was simple, however, taking advantage of temperature and flow measurements for three cases resulted in reduced uncertain parameters (aggregated heat conduction coefficient) and more accurate model. Barberis et al. [40] proposed a thermo-economic approach to investigate the integration of different thermal (both hot and cold) and electrical energy storage systems for optimal management strategy in a real smart district. The battery operation was considered in both off-grid and islanded operations. The author considered virtual term in their objective function as a penalty to represent the energy exchange between the plant and the environment. Zeng et al. [41] optimized the annual cost of a piping network based on the diameter for two scenarios for one typical day: conventional central circulating pumps and distributed pumps with variable speed. The latter operates associated with the electricity price. Diangelakis et al. [80] proposed a dynamic analytical optimization model for a CHP in a hypothetical district consisting of 10 buildings. The decision variable was the displacement volume of the internal combustion engine to minimize the operational cost. Li et al. [47] focused on the optimal economic design of the distribution network of a seawater-source heat pump for commercial district bay. However, their study did not consider the demand change throughout the year resulting in variable flow speed and temperature. A number of the previous studies are summarized in Table 2.2 based on the optimization method/approach, objective function, decision variables, district type, and the tool used by the researcher.
23
Table 2.2 Summary of optimization approaches in some recent studies
Study Optimization type Method/
Algorithm
Objective(s) DH type Solver
Superstructures
Mehleri et al. [62] Single-objective MILP Total annualized cost of
micro-grid
Centralized GAMS CPLEX
Wu et al. [48] Multi-objective MILP Both economic and
environmental aspects
Decentralized Not mentioned
Li et al. [47] Single-objective
Multi-objective
MILP Annual cost and carbon dioxide emission
Decentralized MATLAB Gurobi
Bordin et al. [63] Single-objective MILP Selection of new users Centralized Opti-TLR
CPLEX
Ameri et al. [64] Single-objective MILP Costs savings and
reduction in CO2 emissions
Decentralized CPLEX AIMMS
Rivarolo et al. [65] Single-objective NLP Sum of annual variable
costs
Centralized W-ECoMP
Buoro et al. [52] Single-objective MILP Annual investment,
operating and maintenance costs
Combined Xpress
Karschin and
Geldermann [66]
Single-objective MILP Cost-efficient heating network
Centralized Xpress
Operation and planning Vesterlund et al. [67]
Single-objective MILP operating costs for heat production
Centralized CPLEX
Wang et al. [56] Single-objective LP costs of the net acquisition
for heat and power in deregulated power market
Centralized LP2
Carpaneto et al. [69]
Single-objective MILP dispatching strategy for the different power sources
Centralized MATLAB
Wang et al. [70] Single-objective Newton’s
method
total mass flow rate total thermal conductance
Centralized Not mentioned Khir and Haouari
[71]
Single-objective MINLP/MILP capital and operating costs Centralized CPLEX
Zhou et al. [72] Single-objective MILP/MINP annual capital, operation
and maintenance cost of CCHP
Centralized GAMS CPLEX
Powell et al. [73] Single-objective MILP/MINLP system operating costs
(fuel and grid)
Centralized MATLAB BONMIN
Jie et al. [74] Single-objective NLP pumping cost and heat loss
cost
Centralized MATLAB
Jiang et al. [75] Single-objective GSO Energy consumption Centralized MATLAB
Ren et al. [76] Single-objective MILP CO2 emission and running
cost
![Figure 1.3: Global heat delivery into all district heating systems based on supply approach [12, 10]](https://thumb-us.123doks.com/thumbv2/123dok_us/10959673.2984272/20.918.213.712.150.453/figure-global-delivery-district-heating-systems-supply-approach.webp)
![Figure 1.4: Global heat delivery into all district heating systems based on fuel type [12, 10]](https://thumb-us.123doks.com/thumbv2/123dok_us/10959673.2984272/21.918.195.717.164.495/figure-global-heat-delivery-district-heating-systems-based.webp)