Vision from next generation sequencing: Multi-dimensional
genome-wide analysis for producing gene regulatory networks
underlying retinal development, aging and disease
Hyun-Jin Yang
1
, Rinki Ratnapriya
1
, Tiziana Cogliati
1
, Jung-Woong Kim
1
,
Anand Swaroop
*
,1
Neurobiology-Neurodegeneration and Repair Laboratory, National Eye Institute, National Institutes of Health, 6 Center Drive, Bethesda, MD 20892-0610, USA
a r t i c l e i n f o
Article history:Received 11 November 2014 Received in revised form 18 January 2015 Accepted 21 January 2015 Available online 7 February 2015 Keywords:
Systems biology High throughput genomics Gene regulatory network Retinal degeneration Macular degeneration Photoreceptor Inherited blindness Network medicine Whole exome sequencing RNA-seq
ChIP-seq eQTL
Pathway-based drug discovery Personalized medicine
a b s t r a c t
Genomics and genetics have invaded all aspects of biology and medicine, opening uncharted territory for scientific exploration. The definition of“gene”itself has become ambiguous, and the central dogma is continuously being revised and expanded. Computational biology and computational medicine are no longer intellectual domains of the chosen few. Next generation sequencing (NGS) technology, together with novel methods of pattern recognition and network analyses, has revolutionized the way we think about fundamental biological mechanisms and cellular pathways. In this review, we discuss NGS-based genome-wide approaches that can provide deeper insights into retinal development, aging and disease pathogenesis. We first focus on gene regulatory networks (GRNs) that govern the differentiation of retinal photoreceptors and modulate adaptive response during aging. Then, we discuss NGS technology in the context of retinal disease and develop a vision for therapies based on network biology. We should emphasize that basic strategies for network construction and analyses can be transported to any tissue or cell type. We believe that specific and uniform guidelines are required for generation of genome, tran-scriptome and epigenome data to facilitate comparative analysis and integration of multi-dimensional data sets, and for constructing networks underlying complex biological processes. As cellular homeo-stasis and organismal survival are dependent on geneegene and geneeenvironment interactions, we believe that network-based biology will provide the foundation for deciphering disease mechanisms and discovering novel drug targets for retinal neurodegenerative diseases.
Published by Elsevier Ltd. This is an open access article under the CC BY-NC-ND license (http:// creativecommons.org/licenses/by-nc-nd/4.0/).
Contents
1. Introduction . . . 2
2. Systems biology approaches . . . 3
2.1. High throughput data generation . . . 3
2.1.1. Gene expression profiling . . . 5
2.1.2. Transcriptional and epigenetic regulation . . . 7
Abbreviations:AMD, Age-related macular degeneration; ChIP, Chromatin immunoprecipitation; ChIP-seq, Chromatin immunoprecipitation-sequencing; CLIA, Clinical laboratory improvement amendments; eQTL, Expression quantitative trait locus; GA, Geographic atrophy; GRN, Gene regulatory network; GWAS, Genome-wide association study; H3K4me2(3), Histone H3 lysine 4 di(tri)methylation; H3K27me3, Histone H3 lysine 27 trimethylation; M cone, Medium wavelength sensitive cone; MIAME, Minimum information about a microarray experiment; NGS, Next generation sequencing; ONL, Outer nuclear layer; PCA, Principal component analysis; RDD, Retinal degenerative disease; RNA-seq, RNA-sequencing; RPE, Retinal pigment epithelium; S cone, Short wave length sensitive cone; SNP, Single nucleotide polymorphism; WES, Whole exome sequencing; WGS, Whole genome sequencing.
*Corresponding author. N-NRL, Building 6, Room 338, MSC0610, 6 Center Drive, Bethesda, MD 20892-0610, USA. Tel.:þ1 301 435 5754; fax:þ1 301 480 9917. E-mail address:[email protected](A. Swaroop).
1 Percentage of work contributed by each author in the production of the manuscript is as follows: Hyun-Jin Yang: 25%; Rinki Ratnapriya: 20%; Tiziana Cogliati: 15%; Jung-Woong Kim: 20%; Anand Swaroop: 20%.
Contents lists available at
ScienceDirect
Progress in Retinal and Eye Research
j o u r n a l h o me p a g e :
w w w .e l se v i e r. co m/ lo ca t e / p r e r
http://dx.doi.org/10.1016/j.preteyeres.2015.01.005
2.1.3. DNA sequence variation . . . 7
2.2. Data integration . . . 7
2.3. System comparison . . . 7
3. System-level analysis of retinal photoreceptor development . . . 7
3.1. Cell type-specific approaches for generating GRN . . . 8
3.2. Construction of photoreceptor GRN . . . 9
3.2.1. Expression profiling . . . 10
3.2.2. Transcription targets (“targetome”) of NRL and CRX . . . 10
3.2.3. Dynamicity and combinatorial action of transcription factors . . . 12
3.2.4. Chromatin state and gene regulation . . . 12
3.2.5. miRNA and other transcribed sequences . . . 13
3.2.6. Proteome analysis . . . 13
4. System-level analysis of retinal aging . . . 14
4.1. Expression profiling of aging retina . . . 14
4.2. Limitations and potential of aging studies in the retina . . . 15
5. Systems biology of retinal degeneration . . . .. . . 15
5.1. NGS applications for disease variant/mutation discovery . . . 16
5.2. Less-recognized complexities associated with genetic variations and human retinal diseases . . . 16
5.2.1. Are mutations rare genetic variations? . . . 17
5.2.2. Do disease-causing mutations have to be conserved? . . . 17
5.2.3. Are monogenic diseases caused by defects in only one gene? . . . 17
5.2.4. Missing heritability of complex traits . . . 19
5.3. Integration of transcriptome with genetic data . . . 19
5.4. Approaches for elucidating disease networks . . . 19
6. Next generation diagnosis and drug development . . . 20
7. Challenges and further considerations . . . 20
7.1. Multi-layer data integration . . . 20
7.2. Standardization of procedures and quality control . . . 20
7.3. Data sharing . . . 21
7.4. Fromin silicoanalysis to the bench . . . 21
8. The future of systems biology approaches: biology of the organism as a whole . . . 21
Acknowledgments . . . 22
References . . . 22
1. Introduction
Ramon y Cajal was the
fi
rst to recognize the retina as
‘
a true
nervous center, as a peripheral extension of the central nervous
system
’
(Ramon y Cajal, 1893 La retine des Vertebres; translation
taken from Piccolino 1989 Santiago Ramon Y Cajal, the retina and
the neuron theory). The retina has thus attained the distinction of
being an attractive model to investigate fundamental biology and
therapy of the nervous system. The vertebrate retina is composed of
six major neuronal cell types that are organized in three cellular
layers forming exquisite neuronal circuits for detection of visual
information (
Fig. 1
A). Light is captured by photoreceptors; visual
signals then undergo enhancement, integration and processing
through bipolar, horizontal and amacrine cells and by varied usage
of parallel synaptic circuits, before eventually being transmitted via
ganglion cells to the brain (
Lamb et al., 2007; Masland, 2001
). This
remarkable complexity makes the retina extremely vulnerable to
degeneration caused by genetic defects that eventually lead to
vision loss. In fact, a vast majority of incurable blindness is caused
by dysfunction or death of retinal photoreceptors (
Wright et al.,
2010
). Thus, knowledge-based design of therapies for blinding
retinal degenerative diseases (RDDs) depends on better
under-standing of pathways that are associated with: (i) normal
devel-opment of the retinal neurons (speci
fi
cally photoreceptors) from
progenitors and stem cells; (ii) assembly of synaptic circuits; (iii)
cellular adaptation and homeostasis; (iv) response to aging and
inherited genomic changes; and (v) disease pathogenesis.
The human genome of almost three billion nucleotides contains
the complete instruction for generating over 100 billion neurons and
150 trillion synapses (
Pakkenberg et al., 2003; Williams and Herrup,
1988
). Despite tremendous cellular heterogeneity and functional
complexity, our genome encompasses only approximately 20,000
protein-coding
genes
(
Ezkurdia
et
al.,
2014
)
(
http://www.
gencodegenes.org
), fewer than some of the
“
apparently
”
less-evolved organisms (
Carninci et al., 2005; de Laat and Duboule,
2013; Pruitt et al., 2009
). However, alternative splicing and use of
alternate promoters can produce unique gene expression patterns
associated with fate determination and cell-type speci
fi
c functions
(
Wang et al., 2008
). Furthermore, the non-protein-coding genomic
DNA [the so-called
“
junk DNA
”
(
Balakirev and Ayala, 2003; Brosius
and Gould, 1992; Ohno, 1972
)] is increasingly being recognized as
an important
“
regulator
”
of the coding information (
Palazzo and
Gregory, 2014
).
Cis
-regulatory sequences include the genomic code
for binding of transcription complexes that dictate quantitatively
precise as well as cell type- and stage-speci
fi
c gene expression (
Levine
et al., 2014; Shlyueva et al., 2014
). In addition, though the coding
transcripts are relatively small in number, a plethora of small and long
non-coding RNAs are detected in different cell types and believed to
modulate gene expression and homeostasis (
Morris and Mattick,
2014; Slack, 2006
). Normal gene expression patterns, established by
combinatorial action of multiple regulatory modules, can be
dis-rupted in response to changes in microenvironment and/or by
inherited genomic variations/mutations, resulting in altered
physi-ology and phenotype (including disease) (
Lagha et al., 2012
). Thus,
comprehensive understanding of integrated gene regulatory
net-works (GRNs) is critical for deciphering normal development and
homeostatic mechanisms as well as pathways leading to disease.
Remarkable advances have been made in elucidating molecules
and pathways that control retinal cell fate speci
fi
cation and
dif-ferentiation (
Agathocleous and Harris, 2009; Bassett and Wallace,
2012
). Defects in over 200 genes have been associated with
inherited monogenic RDDs (RetNet;
https://sph.uth.edu/retnet/
).
We have also begun to dissect the complexities of multifactorial
retinal diseases that af
fl
ict large segments of the population
(
Fritsche et al., 2014; Kuo et al., 2014
). Impressive gene- and stem
cell-based approaches are being developed for treatment of retinal
disease; nonetheless, individual research projects have generally
centered on single genes or molecules or on a single functional
pathway, and therefore the biomedical progress has not been able
to keep pace with public expectations (
Bull and Martin, 2011;
Cuenca et al., 2014; Lindvall and Kokaia, 2010; Rowe-Rendleman
et al., 2014
). We must recognize that genes/RNAs/proteins are
part of complex molecular networks and biochemical pathways
and that the disruption of one creates a domino effect leading to
multiple changes (including in gene expression patterns) not only
within the affected cell(s) but also in neighboring cells and tissues.
Therefore, holistic assessment of biological components and of
interaction networks constitutes essential tasks in exploring retinal
development and disease in the post-genomic era (
Barabasi and
Oltvai, 2004; Hwang et al., 2012; Kitano, 2002; Schadt, 2009;
Vidal et al., 2011; Yu et al., 2004b; Zhou et al., 2014
).
The emergence of next generation sequencing (NGS) technology
has dramatically broadened the scope in which diverse cellular
processes can be interrogated, setting the stage for system-level
approaches to comprehend retinal GRNs. In this review, we will
describe the current status of genome-wide strategies as applied to
the retina and discuss in which direction the
fi
eld appears to be
moving. As the task ahead is daunting yet feasible, we believe that a
collaborative consortium-like approach, elegantly demonstrated by
genetic studies of age-related macular degeneration (AMD)
(
Cipriani and International AMD Genomics Consortium, 2014;
Fritsche et al., 2013; Fritsche and International AMD Genomics
Consortium, 2014
), is required to elucidate retinal GRNs that
con-trol development, maintain homeostasis and modulate responses
to aging, environment and inherited disease-causing variants or
mutations. We have therefore taken the liberty to put forward a
framework for integrative and comparative analysis of NGS data,
with a goal to build comprehensive GRNs pertaining to the retina.
Here, we have primarily focused on the photoreceptors because of
their association with incurable blinding retinal diseases. Rod
photoreceptors, in particular, constitute nearly 80% of retinal
neu-rons in many mammalian species, including mouse and human
(
Hendrickson et al., 2008; Lamb et al., 2007; Rapaport et al., 2004
);
thus NGS data sets from retina are especially rich in rod
photoreceptor-related information. We envision the
photorecep-tors as an ideal paradigm for initiating multi-dimensional,
system-level studies that can be widely applicable to other cell types,
especially in the retina but broadly for the central nervous system.
2. Systems biology approaches
Biomedical research is mostly driven from phenotypic
obser-vations and curiosity to understand biological phenomena. For
example, forward genetic screening using animal models, such as
Drosophila melanogaster
(fruit
fl
y),
Caenorhabditis elegans
and
Mus
musculus
(mouse), have led to identi
fi
cation of many essential
genes and their function. Similarly, human genetic studies have
focused on identifying genes linked to speci
fi
c phenotypes or traits,
thereby providing signi
fi
cant insights into biological basis of the
disease. In addition, biochemical, genetic and molecular biology
approaches have further elucidated mechanism(s) of action of
speci
fi
c molecules and cellular components. Though biological
pathways can be deciphered by compiling individual molecular
functions and binary relationships, current approaches are not
optimal in mapping complex regulatory interactions among
discrete constituents. Systems biology takes a bird's eye view of
cellular function with a goal of delineating molecular interactions
and crosstalk among the pathways (
Ideker et al., 2001; Ryan et al.,
2013; Sorger, 2005
), complementing the reductionist approach
(
Fig. 1
B). Although the concept of
“
systems biology
”
is not new
(
Trewavas, 2006
), it has had only limited success because of
un-availability of extensive data sets.
Recent advent of NGS and computational methodology has
permitted biologists to generate system-wide data sets, leading to
rapid advances in this
fi
eld. Three major components can be
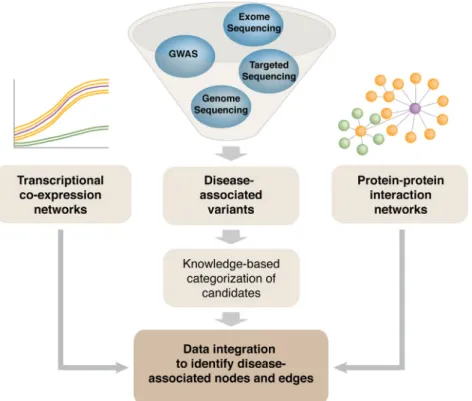
assigned to systems biology, especially when we discuss GRNs
(
Fig. 2
A):
(i) Prediction of regulatory networks via generation of various
high throughput data sets and by computational analysis
(ii) Extension and/or re
fi
nement of the networks by
super-imposing measurements made at multiple levels of cellular
constituents such as DNA, transcribed sequences, chromatin
state, proteins, and metabolites.
(iii) Assessment of system's response to time, risk factors or
interaction with its microenvironment (e.g., neighboring
cells/tissues)
A comprehensive system-level understanding of a cell/tissue/
organism requires integrated analysis of all intracellular molecular
interactions and pathways, including data sets from proteomic and
metabolomic studies. However, high throughput data from such
investigations is not readily obtainable for most tissues including
the retina (or other ocular cell types). We therefore limit our
dis-cussion to genetic and epigenetic control networks that can be
measured by NGS.
2.1. High throughput data generation
NGS is a versatile technology that can be coupled with an endless
list of classical assay strategies (
Table 1
), enabling genome-wide
measurements of DNA sequence variations as well as components
of GRNs at both transcriptional and epigenetic levels. High
throughput genome-wide data generation requires a careful study
design, which can be summarized in two complementary strategies
(
Fig. 2
A). In the
fi
rst approach, the output is a nearly complete
cat-alog of components of a given class of biomolecules with relevant
quantitative information. For example, GRNs associated with rod
photoreceptors can be constructed by integrating a comprehensive
and quantitative catalog of mRNA transcripts (using RNA-seq), target
genes
for
key
transcription
factors
(using
chromatin
immunoprecipitation-sequencing, termed ChIP-seq), global pro
fi
les
of epigenome [histone modi
fi
cations using ChIP-seq, and DNA
methylation using different NGS-based methods such as reduced
representation bisul
fi
te sequencing (RRBS)], and other regulatory
molecules (such as miRNA, using small RNA-seq). In this review, we
will not discuss NGS-based methods (summarized in
Table 1
), which
have been subjects of excellent reviews recently (
Furey, 2012;
Metzker, 2010; Park, 2009; Telese et al., 2013; Wang et al., 2009
).
With these data, regulatory networks can be inferred based on
co-expression and prior knowledge of interactions though additional
experiments are needed for validation. In the second strategy, a
‘
seed
network
’
is employed for the experimental design. A known
mo-lecular interaction or functional hub is altered experimentally, and
the consequences of system perturbation are interrogated
genome-wide. For example, gene knock-out studies followed by mRNA or
epigenomic pro
fi
les would greatly assist in deciphering the
associ-ated GRN. While the former approach charts all the possible physical
or regulatory interactions, the latter re
fi
nes the networks by directly
examining functional relationships.
Fig. 1.The mammalian retina and systems biology approaches.A, A representative retinal anatomy is shown by hematoxylin and eosin stained cross section of an adult mouse retina (left) and by schematics (center and right). In the mammalian retina, six main neuronal classes are organized into three nuclear layers [outer nuclear layer (ONL), inner nuclear layer (INL) and ganglion cell layer (GCL)] and form synaptic connections in two plexiform layers [outer plexiform layer (OPL) and inner plexiform layer (IPL)]. Cone and rod photoreceptors comprise the outer retina with their cell bodies situated in ONL and their inner and outer segments (IS and OS, respectively) located between ONL and the retinal pigment epithelium (RPE). RPE microvilli ensheath the outer segments, supporting phototransduction and photoreceptor survival. Photoreceptors transfer visual information through retinal in-terneurons to ganglion cells.B, To date, population-based genetic analyses (i) and genetic and molecular studies of known genes (ii) have been major strategies in retinal research.
2.1.1. Gene expression pro
fi
ling
Transcriptome analysis is central to comprehensive
under-standing of complex biological systems such as photoreceptors
(
Swaroop and Zack, 2002
). In RNA-seq assays, total RNA isolated
from a cell type or a tissue of interest is converted to cDNA and
deep-sequenced to obtain a comprehensive catalog of transcripts
(
Mortazavi et al., 2008
). Although mRNA-seq is most commonly
conducted, genome-wide pro
fi
ling of regulatory RNAs is also
possible and provides an additional layer of information regarding
gene regulation (
Morin et al., 2008
). RNA-seq offers many
advan-tages over hybridization-based expression pro
fi
ling (such as
microarrays), permitting greater sensitivity and dynamic range in
transcript detection (
Zhao et al., 2014
) and more accurate
identi-fi
cation of alternatively spliced transcripts (
Shen et al., 2014
). As
detection and quanti
fi
cation of transcripts is not limited to the
current annotation, RNA-seq analysis enables discovery of novel
genes and of new transcripts from annotated genes (
Wang et al.,
2009
). Finally, RNA-seq can be performed even at the level of a
Fig. 2.Strategies and aims of system-wide, multi-dimensional data analysis.A, Networks of a tissue or a cell type of interest can be inferred from high throughput data analysis. Next generation sequencing (NGS) allows cataloging cellular constituents at a steady state and functional interactions when combined with system perturbation and differential analysis. Molecular interactions are not confined to only one molecular type such as DNA, transcripts, chromatin marks or proteins. Thus, multi-dimensional data integration further refines the networks. In addition, comparative analysis is critical as discrete cells are subjected to temporal changes (i.e., development and aging) as well as interactions with neighboring cells and the microenvironment, which evoke physiological modulation of the tissue and eventually of the organism. These holistic approaches will lead to new discoveries of the biological systems and offer broad application.B, Cellular function is regulated at multiple levels. The DNA sequence contains the instructions of protein coding and gene regulation, and diverse gene regulatory mechanisms ensure expression of a unique set of components highly specialized for each cell identity. Intrinsic and/or exogenous damage to any level can lead to deleterious effects on function and survival of the system. TFact, transcription activator; TFrep, transcription repressor.Such studies have long been a major driving force in identifying retinal disease genes and in revealing the function of the disease genes and their functional or structural associates. The“bottom up”approaches have been undertaken to build functional networks (iii) that are critical for retinal function (e.g., phototransduction pathway) by compiling functional/ structural relationships among individual molecules. Considering widespread crosstalk between functional and/or regulatory networks (iv), system-wide measurement of various biomolecules is critical in constructing a comprehensive map of complex intermolecular regulatory interactions. Systems biology approach thus complements the traditional reductionist methodologies. The recent advent of next generation sequencing technologies has enabled system-level assessment of various biological processes. Computational analysis of next generation sequencing and other types of high throughput data, ideally by integrating multiple data sets, allows a holistic approach to elucidate cellular function (v) as well as homeostasis of tissues (vi), organs (vii), and organisms (i). RHO, rhodopsin; PDE, phosphodiesterase; CNG, cyclic nucleotide gated channel.
Table 1
High throughput techniques used in system-level data generation at multiple levels of biological pathways.
Method Information Strategy Reference
Genome WGS (whole genome sequencing) Genetic variation in the entire
genome
High throughput sequencing of the complete genome
WES (whole exome sequencing) Genetic variations in the exome Exome capture followed by high throughput sequencing. (Ng et al., 2009)
Repli-seq (replication sequencing) Temporal mapping of DNA
replication
BrdU labeling of newly replicated DNA and FACS-mediated fractionation of cell populations according to cell cycle phases followed by high throughput sequencing.
(Hansen et al., 2010) ChIP-seq (chromatin immunoprecipitation
sequencing), ChIP-exo, or DamID
Genome-wide protein binding sites Genome-wide profiling of occupancy by a protein of interest. A specific antibody is used to isolate protein-bound chromatin areas (ChIP-seq), and the resolution of the assay can be further enhanced by employing exonuclease digestion of protein-bound DNA ends (ChIP-exo). In cases that the specific ChIP quality antibody is not available, the protein of interest that is fused toE. ColiDNA adenine
methyltransferase (Dam) and therefore methylates DNA adjacent to the binding sites can be used instead.
(Barski et al., 2007), (Rhee and Pugh, 2011)
Transcriptome RNA-seq Gene expression profile Genome-wide profiling of transcripts. Typically, polyadenylated RNAs are enriched
for subsequent cDNA synthesis and high throughput sequencing.
(Mortazavi et al., 2008)
small RNA-seq Regulatory RNA profile Genome-wide profiling of small RNA species by high throughput sequencing with
modified cDNA synthesis protocols.
(Morin et al., 2008) Deep CAGE (cap analysis of gene expression) Transcription start sites Capturing cDNA tags corresponding 50ends of transcripts by cap trapping system
followed by high throughput sequencing.
(de Hoon and Hayashizaki, 2008) RNA-PET (RNA paired end tag) sequencing 50and 30ends of transcripts Profiling of 50and 30end tags of transcripts. This method is especially powerful in
detection of fusion transcripts.
(Ruan and Ruan, 2012)
GRO-seq (global run-on sequencing) Nascent transcripts Global mapping of transcriptionally active polymerase density by genome-wide
profiling of nascent RNA.
(Core et al., 2008)
Ribo-seq (ribosome profiling) Transcripts engaged with
translation
Profiling of ribosome-protected mRNA fragments by deep sequencing. (Ingolia et al., 2009) CLIP-seq (Cross-linking immunoprecipitation
sequencing) or RIP-seq (RNA immunoprecipitation sequencing)
Transcripts bound by a protein of interest
High throughput sequencing of cDNA made from RNA pulled down with antibody against a protein of interest. RNA-protein complexes are cross-liked with UV in CLIP-seq. In RIP-seq, no cross-linking is necessary although formaldehyde-mediated cross-linking can be included.
(Yeo et al., 2009) (Zhao et al., 2010)
Epigenome& chromatin conformation
Histone modification ChIP-seq Genome-wide map of histone
modification
ChIP-seq can be also applied for genome-wide profiling of histone modifications. For histones, ChIP can be also performed without cross-linking of proteins to DNA (native ChIP).
(Barski et al., 2007)
MeDIP-seq (methylated DNA
immunoprecipitation sequencing), WGBS (whole genome bisulfite sequencing) or RRBS (reduced representation bisulfite sequencing)
Genome-wide map of DNA methylation
Genome-wide mapping of methylated cytosine (5 mC) of DNA. Methylated DNA can be detected by various methods such as immunoprecipitation using 5 mC-specific antibody (MeDIP-seq), MBD2b/MBD3L1 protein complexes with high affinity to 5 mC (MIRA-seq) and sodium bisulfite conversion of unmethylated C to U (WGBS or RRBS). (Berman et al., 2012; Gu et al., 2011; Lister et al., 2009; Weber et al., 2005)
hMeDIP-seq (hydroxymethylated DNA immunoprecipitation sequencing), TAB-seq (Tet-assisted bisulfite sequencing)
Genome-wide map of DNA hydroxy-methylation
Genome-wide mapping of hydroxymethylated cytosine (5 hmC) of DNA. 5 hmC is either isolated by immunoprecipitation (hMeDIP-seq) or by glucosylation-mediated protection of 5 hmC sites from the subsequent Tet enzyme assisted conversion of 5 hmC or MspI digestion (TAB-seq and RRHP-seq, respectively).
(Jin et al., 2011; Song et al., 2011a; Wu et al., 2011) MNase-seq (micrococcal nuclease sequencing) Nucleosome positioning MNase digestion of chromatin followed by high throughput sequencing. MNase
preferentially cuts at the linker DNA between nucleosomes.
(Henikoff et al., 2011) 4C-seq (circular chromosome conformation
capture sequencing) or HiC-seq
Chromatinechromatin interaction Variations of chromatin conformation capture (3C) assays to detect intra- or interchromosomal interaction genome-wide. 4C-seq detects chromatin areas interacting with one genomic locus of interest in genome-wide manner, whereas HiC-seq captures all detectable chromatin-to-chromatin interactions.
(Lieberman-Aiden et al., 2009; Rao et al., 2014; Splinter et al., 2012) ChIA-PET (chromatin interaction analysis by
paired-end tag sequencing)
Chromatinechromatin interaction mediated by a protein of interest
Chromatin immunoprecipitation and ligation of the adjacent DNA ends followed by high throughput sequencing.
(Zhang et al., 2012) DNase-seq (DNase I hypersensitivity
sequencing), FAIRE-seq (formaldehyde assisted isolation of regulatory sequences), or ATAC-seq (assay for transposase-accessible chromatin sequencing)
Open chromatin Genome-wide mapping of open chromatin. Open chromatin can be selectively
isolated by the following characteristics: high sensitivity to DNase I digestion (DNase-seq), segregation in aqueous phase upon phenol/chloroform extraction (FAIRE-seq), or preferential transposon integration.
(Crawford et al., 2006) (Giresi et al., 2007) H.-J. Y ang et al. / Progress in Retinal and Ey e Resear ch 46 (20 15 ) 1 e 30
single cell (
Shapiro et al., 2013
). With increasing accessibility and
affordability, RNA-seq analysis is fast becoming a routine procedure
replacing microarrays.
2.1.2. Transcriptional and epigenetic regulation
Gene expression is controlled by combinatorial action of diverse
regulatory programs (
Fig. 2
B). Interaction of transcription factors
with speci
fi
c
cis
-regulatory motifs is one of the primary
mecha-nisms underlying temporal and cell type-speci
fi
c gene regulation.
ChIP, a widely used procedure to study transcription factor
occu-pancy
in vivo
(
Gilmour and Lis, 1985; Weinmann and Farnham,
2002
), can now be applied in conjunction with tiling array
(ChIP-on-chip) (
Ren et al., 2000
) or NGS (ChIP-seq) (
Barski et al., 2007
) to
examine genome-wide binding of a speci
fi
c protein. NGS-based
methods (
‘
-seq
’
assays) are now being used to delineate global
pro
fi
les of chromatin states (such as histone modi
fi
cation, DNA
methylation, nucleosome positioning and chromatin accessibility)
and to identify novel fundamental mechanisms underlying gene
transcription (see
Table 1
).
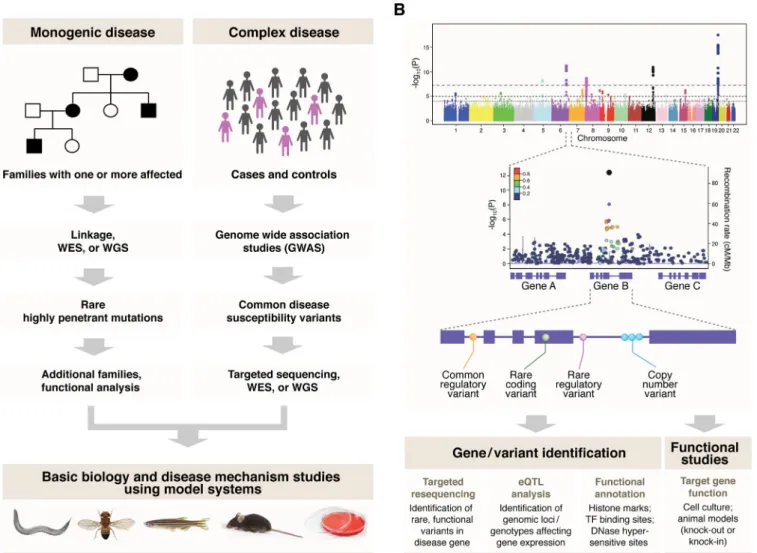
2.1.3. DNA sequence variation
The human genome includes millions of sequence variations,
primarily in the non-coding regions; of these, tens of thousands
may be unique to an individual (
Schaibley et al., 2013
), and many
can even be linked to disease phenotype. Linkage analysis has
traditionally been successful in identifying the disease variant/gene
in monogenic RDDs, and genome-wide association studies (GWAS)
have identi
fi
ed variants associated with complex traits. More
recently, pro
fi
ling of genetic variants using NGS methods, such as
whole exome sequencing (WES) and targeted or whole genome
sequencing (WGS), have transformed human genetic research. The
identi
fi
ed variants/mutations can provide valuable insights into
normal biology as well as elucidate mechanism(s) of disease
pathogenesis. For instance, gene ontology analysis of 142 genes
implicated in photoreceptor degeneration has identi
fi
ed a handful
of biological pathways including those associated with cilia
biogenesis, lipid metabolism, and phototransduction (
Wright et al.,
2010
). Similarly, genetic variants associated with susceptibility to
AMD have revealed the involvement of complement regulation,
cholesterol transport and extracellular matrix remodeling in
dis-ease pathogenesis (
Fritsche et al., 2014
).
2.2. Data integration
Once high throughput data is collected, computational tools are
employed to predict and construct GRNs. Although system-level
measurements are made at discrete levels such as transcriptome,
DNA-protein interaction, epigenome and genome, intermolecular
interactions that form a network are generally not con
fi
ned to a
single category. Thus, the experimental data pertaining to distinct
aspects of the network must be analyzed simultaneously and
assimilated to identify new patterns of a biological system, which
single data sets fail to detect.
Generation of networks by integrating multiple data sets
ne-cessitates that data are acquired under conditions of minimal
variability; e.g., from a single cell type since cellular heterogeneity
in the retina would create high transcriptional noise affecting the
generation of a viable and veri
fi
able GRN across development and
disease states. Ideally, transcriptional and regulatory data for
network formation should be obtained from a speci
fi
c cell type at
distinct stages of differentiation, aging or disease. Efforts have been
made to isolate individual neuronal cells of the retina for
genome-wide analysis. Such attempts, however, have been few and
pri-marily limited to gene expression pro
fi
ling (
Akimoto et al., 2006;
Siegert et al., 2012; Trimarchi et al., 2007
).
Table 2
lists public
databases containing high throughput data relevant to studies of
the retina.
2.3. System comparison
Biological systems are highly dynamic and undergo progressive
transition over time (
Hwang et al., 2012
). During development,
intrinsic and extrinsic factors sequentially restrict cell fates and
specify morphology and function most suited for a given cellular
identity. Cumulative adaptive responses to internal and/or
envi-ronmental challenges over a lifespan also impact spatio-temporal
architecture of a system. Therefore, comparisons along time
se-ries data sets represent valuable strategies to assess system
dy-namics.
Additionally,
continuous
fl
uctuations
imposed
by
microenvironment and/or intrinsic genetic variations may induce
changes beyond the cell tolerance level and manifest as a disease.
The use of animal models for retinal traits or diseases provides a
powerful tool to evaluate direct in
fl
uence of genetic mutation(s) or
experimental stress on networks as relatively little variation is
expected in congenic strains raised under uniform conditions.
Another important factor in system dynamics is variability among
cell types exhibiting functional interaction such as between
pho-toreceptors and retinal pigment epithelium (RPE); for example,
defects in RPE are associated with photoreceptor dysfunction or
death (
Strauss, 2005
). Even cells of the same neuronal type may
display high variability based on temporal context and spatial
or-ganization (
Trimarchi et al., 2007
).
Change in system architecture can be ascertained from human
population genetics using control individuals and patients with a
speci
fi
c disease/trait (e.g., AMD). Such genetic association studies
exploit naturally occurring differences that cannot necessarily be
generated by experimental means. However, it should be noted that
the strength of data sets depends on the size of the cohort and
penetrance of a speci
fi
c variant/mutation. Elucidation of
multifac-torial complex biological phenomena, such as aging and
patho-genesis
of
complex
disease,
can
especially
bene
fi
t
from
comparative system-level analysis using large NGS-based genomic
data.
In the following sections, we will elaborate on system-level
analysis of rod photoreceptors in three disciplines: development
(Section
3
), aging (Section
4
) and degenerative disease (Section
5
).
3. System-level analysis of retinal photoreceptor
development
Early attempts for system-wide assessment of photoreceptor
development included gene expression pro
fi
ling of the retina using
expressed sequence tags (ESTs), serial analysis of gene expression
(SAGE) and microarrays (
Fig. 3
A) (
Akimoto et al., 2006; Blackshaw
et al., 2001; Gieser and Swaroop, 1992; Livesey et al., 2000; Sharon
et al., 2002; Yoshida et al., 2004; Yu et al., 2003b
). NGS-based
methods have dramatically expedited the pace of expression
pro
fi
ling and permitted the application of gene regulation assays to
genome-wide scale (
Fig. 3
B). In addition to examining the whole
retina, we can now develop quantitatively precise expression
pro-fi
les of individual cell types and obtain global data on transcription
factor binding and epigenomic marks. Multi-dimensional data
integration should therefore enable us to identify novel patterns in
GRNs that control functional architecture of individual retinal cells,
such as photoreceptors.
In the developing vertebrate retina, rod and cone
photorecep-tors differentiate from common pools of retinal progenitor cells
with distinct temporal pro
fi
les. While cone generation ceases
prenatally in rodents, rod birth spans a long time window from
embryonic day (E)12 to postnatal day (P)10 with peak at P0
e
P2
(
Carter-Dawson and LaVail, 1979; Rapaport et al., 2004
).
Photore-ceptor identity is largely dictated by an intrinsic transcriptional
program (
Swaroop et al., 2010
) that involves a number of
tran-scription factors, including cone-rod homeobox protein CRX (
Chen
et al., 1997; Furukawa et al., 1997
), neural retina leucine zipper
protein NRL (
Mears et al., 2001; Swaroop et al., 1992
) and thyroid
hormone receptor THRB (also called TR
b
2) (
Ng et al., 2001
). CRX
plays an essential role in photoreceptor development (
Furukawa
et al., 1999
) by controlling the expression of both rod and cone
genes (
Corbo et al., 2010; Hennig et al., 2008
). NRL and THRB,
however, determine the genesis of rods (
Mears et al., 2001
) and
medium wavelength sensitive (M) cones (
Ng et al., 2011
),
respec-tively, from photoreceptor precursors that seem to be otherwise
speci
fi
ed by
“
default
”
as short wavelength sensitive (S) cones
(
Swaroop et al., 2010
). Other essential regulators of photoreceptor
development include OTX2 (
Nishida et al., 2003; Roger et al., 2014
),
RORB (
Jia et al., 2009; Srinivas et al., 2006
) and NR2E3 (
Chen et al.,
2005; Cheng et al., 2006, 2011; Haider et al., 2000; Oh et al., 2008;
Peng et al., 2005
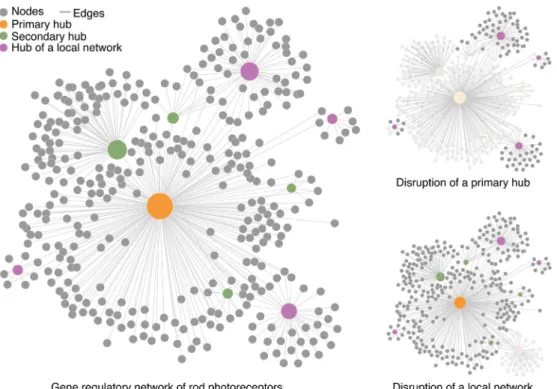
). These key transcriptional regulators constitute
central nodes (
“
hubs
”
) in the GRN that controls photoreceptor
development.
3.1. Cell type-speci
fi
c approaches for generating GRN
Although few studies have been performed using puri
fi
ed
photoreceptor cells, rod photoreceptor-speci
fi
c information can be
predicted by genome-wide data generated from the predominantly
rod-containing mouse or human retina. Considering that NRL and
CRX expression are largely photoreceptor-speci
fi
c, ChIP-seq data
for these two key transcription factors would broadly re
fl
ect
photoreceptor biology. The same is not true for transcriptome and
epigenome data obtained from the whole retina. Isolation of
pho-toreceptors is necessary to acquire true photoreceptor-speci
fi
c
in-formation. Cell type-speci
fi
c approaches are even more critical for
developmental studies since the proportion of photoreceptors in
mouse retina continuously increases until P10, making it dif
fi
cult to
discern true cellular changes in gene expression or epigenetic
marks. The
fi
rst example demonstrating the importance of cell
type-speci
fi
c studies comes from microarray-based expression
pro
fi
ling of
fl
ow-sorted rod photoreceptors from
Nrl
p-GFP mice
(
Akimoto et al., 2006
). The resulting rod-speci
fi
c transcriptome
data effectively detected many low level transcripts that had not
been observed in the whole retina transcriptome data. Although
many transgenic mouse lines expressing
fl
uorescence reporters in
speci
fi
c retinal cell types have been described and are being used
for transcriptome analysis (
Siegert et al., 2012
), identi
fi
cation of
new cell type-speci
fi
c markers (
Koso et al., 2009
) would greatly
facilitate NGS studies of retinal neuronal subtypes.
An array of subtypes, each with unique morphology and function,
can be recognized within major classes of retinal neurons (
Masland,
2012
). Single cell gene expression pro
fi
ling has demonstrated a high
degree of heterogeneity among individual retinal cells (
Trimarchi
et al., 2008
). A better understanding of biological events thus
re-quires delineation of GRNs speci
fi
c not only at the level of individual
subtypes but perhaps even at a single cell level. Due to limitations in
obtaining suf
fi
cient material, conventional methods need to be
Table 2Public databases containing clinical or high throughput retina data sets.
Database URL Description Reference
Allen Brain Atlas http://www.brain-map.org/ Public resources integrating comprehensive gene expression and anatomical data from developing or adult mouse and human brain
(Hawrylycz et al., 2012; Lein et al., 2007)
BrainCloud http://braincloud.jhmi.edu/ plots/
Database of temporal gene expression dynamics in the human prefrontal cortex across the lifespan
(Colantuoni et al., 2011)
EyeSAGE http://neibank.nei.nih.gov/ EyeSAGE/index.shtml
Resource for retina, RPE and trabecular meshwork transcriptomes
(Bowes Rickman et al., 2006)
Gene Expression Omnibus (GEO) http://ncbi.nlm.nih.gov/geo Public data repository of functional genomics data supporting MIAME-compliant data submissions
Gene Expression Profile Database http://www.fmi.ch/roska.data/ index.php
Microarray data across diverse adult mouse retinal cell types (Siegert et al., 2012)
High resolution fundus image database
https://www5.cs.fau.de/ research/data/fundus-images/
Database of fundus images of healthy eyes and eyes with diabetic retinopathy or glaucoma
Human Retinal Transcriptome http://oculargenomics.meei. harvard.edu/index.php/ret-trans
The human retina transcriptome data generated from three normal human retinas using RNA-seq
(Farkas et al., 2013)
mirNEYE http://mirneye.tigem.it Expression atlas of 221 miRNAs in the developing and adult wild type mouse eye
Mouse Retina SAGE library http://cepko.med.harvard.edu Database of gene expression profiling of developing and adult mouse retina and a few other non-ocular tissues.In situ hybridization data are also available for select genes.
(Blackshaw et al., 2001; Blackshaw et al., 2004)
NEIbank http://neibank.nei.nih.gov/ index.shtml
Database of assembled EST data from ocular tissues of various organisms
Retina Central (WEBER) http://www.retinacentral.org/ Database of genes experimentally shown to be expressed in the retina/the retinal pigment epithelium.
(Schulz et al., 2004)
Retina International http://www.retina-international.org/sci-news/ databases/mutation-database/
Database of retinal diseases, mutations, animal models and disease-associated proteins
Retinal Express http://odin.mdacc.tmc.edu/ RetinalExpress/
E14.5 mouse retina cDNA/EST database RetinoBase http://alnitak.u-strasbg.fr/
RetinoBase/
Microarray database generated from all publicly available retina-related gene expression profiles
(Kalathur et al., 2008)
RetNet (Retinal information network)
https://sph.uth.edu/retnet/ Database of genes and loci causing inherited retinal diseases
RP Gene Expression Atlas http://rpexp.tigem.it/ Collection ofin situhybridization data for retinitis pigmentosa genes in mouse and human retina
STARE (Structured analysis of retina)
http://www.ces.clemson.edu/ ~ahoover/stare/
Database of retinal images of various clinical manifestations (Hoover and Goldbaum, 2003; Hoover et al., 1998)
miniaturized to gain enough sensitivity for single cells or cell types.
However, technical hurdles including sample loss, degradation and
contamination can have more pronounced impact on quality and
robustness of data generated from single cells or small quantities
versus large pools of cells. In addition, many rounds of PCR
ampli-fi
cation may generate increased noise and inaccurate quanti
fi
cation.
Nevertheless, cell type-speci
fi
c or even single cell level analyses are
necessary to extract gene regulatory information relevant to the cell
of interest. Single cell collection methods based on micro-
fl
uidic
systems (
Shalek et al., 2014
), high-resolution imaging (
Lubeck and
Cai, 2012
), and better protocols for constructing NGS libraries from
small amount of starting RNA (
Brooks et al., 2012; Tang et al., 2009;
Tariq et al., 2011
) have made it possible to attempt more robust
expression pro
fi
ling of individual retinal neurons. However, a major
challenge remains for the generation of epigenomic and other NGS
data sets with small number of cells. Our laboratory and others are
currently developing such protocols (
Adli et al., 2010; Guo et al.,
2013; Smallwood et al., 2014
).
The importance of using a puri
fi
ed single cell type for
system-level analysis cannot be over-emphasized since biological
pro-cesses such as development and aging have broad and concurrent
impact on multiple cell types in a tissue and on the organism as a
whole. Deciphering photoreceptor GRN from the whole retina
studies would be complicated by transcriptional noise and
differ-ences in epigenome and regulatory molecules among different cell
types. This is especially true for dissecting changes in GRNs during
the pathogenesis of photoreceptor degeneration. As
photoreceptor-speci
fi
c data are not available for all NGS-based assays, we also
cover studies from the whole retina in the discussion below.
3.2. Construction of photoreceptor GRN
Gene expression requires context-speci
fi
c interaction among
cis
-regulatory DNA elements, basal transcriptional machinery and
transcription regulatory proteins. In addition, transcriptional
ac-tivity is under the in
fl
uence of chromatin architecture as well as
Fig. 3.Timeline of genome-wide studies of the retina biology and disease pathogenesis. The advent of genome-scale profiling technologies has been a critical step for systems biology approaches.A, From the pioneering high throughput transcript analysis, such as the initial application of microarray and serial analysis of gene expression (SAGE), to whole genome sequencing, an ever-growing number of genome-wide studies have advanced our knowledge about healthy retina and disease pathogenesis. Highlights of such innovative genome-scale studies were selected and presented chronologically.B, For more than a decade, microarray has been a widely used methodology of choice for gene expression profiling, yielding a substantial number of publications each year. RNA-seq, deep sequencing of cDNA using NGS technology, is becoming more accessible and affordable and thus expected to be applied more widely. In addition to transcriptome analysis, NGS is applicable to a variety of other conventional research techniques and has already generated numerous data sets surveying whole exomes for genetic variation (whole exome sequencing), transcription factor targetome (ChIP-seq) and epigenome (ChIP-seq for histone modifications and various DNA methylome sequencing methodologies).1(Livesey et al., 2000),2(Blackshaw et al., 2001),3(Mu et al., 2001),4(Yoshida et al., 2002),5(Sharon et al.,2002),6(Farjo et al., 2002),7(Chowers et al., 2003b),8(Gustincich et al., 2004),9(Klein et al., 2005),10(Akimoto et al., 2006),11(Trimarchi et al., 2007),12(Arora et al., 2010; Hackler
et al., 2010; Karali et al., 2010;Wang et al., 2010),13(Chen et al., 2010b),14(Neale et al., 2010),15(Otto et al., 2010),16(Tummala et al., 2010),17(Corbo et al., 2010),18(Grant et al., 2011), 19(Brooks et al., 2011; Mustafiet al., 2011),20(Popova et al., 2012),21(Hao et al., 2012),22(Farkas et al., 2013),23(Oliver et al., 2013b),24(Fritsche et al., 2013),25(Nishiguchi et al., 2013), anumber of publications until September 2014.
regulatory RNAs. Thus, basic elements needed to generate a rod
photoreceptor GRN include:
(i) Global mRNA pro
fi
ling by RNA-seq (Section
3.2.1
)
(ii) Identi
fi
cation of target genes for cell speci
fi
c transcription
factors by ChIP-seq (Sections
3.2.2 and 3.2.3
)
(iii) Chromatin state such as histone modi
fi
cations by ChIP-seq,
DNA methylation pro
fi
ling, and chromatin accessibility by
DNase I hypersensitivity sequencing (Section
3.2.4
)
(iv) Regulatory RNA pro
fi
ling (Section
3.2.5
)
Transcriptional pro
fi
les are also needed at multiple stages of rod
development in order to build a developmental GRN. Gene
expression pro
fi
ling can be used in conjunction with gain- or
loss-of function mutations loss-of relevant
“
hub
”
transcription factors to
further validate GRNs. For example, known hubs in the
photore-ceptor network such as NRL and CRX can be perturbed (e.g., in
mouse mutants) before genome-wide gene expression analysis.
The genes showing altered expression in the absence of a
regula-tory factor would represent direct or indirect (i.e., through
sec-ondary regulatory nodes) transcriptional targets. Additionally, GRN
can also be inferred from co-expression data. Groups of genes that
share similar expression signatures in response to experimental
manipulation and/or during development would likely represent
common gene regulatory pathways. Although such information is
only suggestive, co-expression data allow for the identi
fi
cation of
novel testable regulatory patterns.
3.2.1. Expression pro
fi
ling
Global pro
fi
ling of gene expression in the developing and mature
retina was
fi
rst accomplished by Affymetrix
™
microarrays (
Dorrell
et al., 2004; Yoshida et al., 2004
). Expression pro
fi
les have also
been generated from
fl
ow-sorted rod photoreceptors (
Akimoto et al.,
2006; Parapuram et al., 2010
) and from single retinal cells (
Ma et al.,
2013; Roesch et al., 2008; Trimarchi et al., 2007; Xue et al., 2011
).
However, NGS-based RNA-seq pro
fi
ling has yielded more
quantita-tively precise information on mRNA transcripts in the mammalian
retina (
Brooks et al., 2011; Farkas et al., 2013; Gamsiz et al., 2012;
Kandpal et al., 2012; Kozhevnikova et al., 2013; Roger et al., 2014
).
More recently, we have produced extensive RNA-seq-based temporal
expression pro
fi
les of puri
fi
ed rod photoreceptors that reveal novel
insights in cellular pathways (
Fig. 4
A)
(Kim et al., manuscript
in preparation
) as well as additional modes of gene regulation,
such as alternative splicing (
Fig. 4
B).
3.2.1.1. Perturbation studies.
For elucidating GRNs, it is valuable to
generate gene pro
fi
les after disrupting one of the key regulatory
nodes. This strategy was
fi
rst applied to
Crx
/mice (
Blackshaw
et al., 2001; Hennig et al., 2008; Livesey et al., 2000
). CRX is
essen-tial for both cone and rod development (
Furukawa et al., 1999
);
however, its role in cell fate determination is debatable because of
overlapping functions with another homeodomain protein OTX2,
which regulates the expression of CRX as well as NRL (
Nishida et al.,
2003; Omori et al., 2011; Roger et al., 2014; Terrell et al., 2012
). A
majority of genes with altered expression in
Crx
/mice showed
photoreceptor enriched expression, and functional categorization of
differentially expressed genes has revealed an array of CRX-regulated
cellular functions, including those involved in phototransduction,
metabolism, signal transduction and cytoskeletal components.
Another extensively studied gene regulatory program is the
NRL-centered transcriptional network. The
fi
rst observation that
NRL is the master switch for generating rod cell fate came from
studies of
Nrl
/mice as their retina completely lacks rod
photo-receptors, with concurrent enhancement of S cone function (
Mears
et al., 2001
). In concordance, ectopic expression of NRL in
photoreceptor precursors or in early-born S-cones resulted in
for-mation of functional rods (
Oh et al., 2007
). Gene pro
fi
ling of
Nrl
/retina revealed little or no expression of rod-speci
fi
c genes,
including those associated with rod phototransduction, and a
concomitant increase in the expression of S cone photopigment
(encoded by
Opn1sw
) and other cone genes (
Brooks et al., 2011;
Yoshida et al., 2004; Yu et al., 2004a
). Global expression analysis
of puri
fi
ed photoreceptors from
Nrl
/retina has validated the
essential role of NRL in activating the expression of rod genes and
suppressing cone genes (
Akimoto et al., 2006
).
NR2E3, an orphan nuclear receptor, constitutes another
impor-tant hub in photoreceptor GRN and is a direct transcriptional target
of NRL (
Bumsted O'Brien et al., 2004; Oh et al., 2008
). Mutations in
NR2E3
cause enhanced S cone syndrome in humans (
Haider et al.,
2000; Sharon et al., 2003; Wright et al., 2004
), similar to the
retinal phenotype exhibited by
Nrl
/mice (
Mears et al., 2001
).
Retinal and rod gene expression pro
fi
ling of
rd7
mutant mice, in
which
Nr2e3
function is ablated, further validates NR2E3 function
primarily as a suppressor of cone genes and as a co-activator (with
NRL and CRX) of rod genes (
Chen et al., 2005; Cheng et al., 2006,
2011, 2004; Corbo and Cepko, 2005; Haider et al., 2009; Oh et al.,
2008; Peng et al., 2005
).
3.2.1.2. Co-expression network analysis.
Target genes of the a
tran-scriptional regulator likely display similar expression patterns and
may participate in common or related cellular functions (
Yu et al.,
2003a
). Clusters of co-expressed genes can thus be used to model
gene regulatory events. The inferred GRNs enable the detection of
putative protein-DNA and protein
e
protein interactions without
requirement of prior knowledge. Mathematical tools have been
developed to predict GRNs from gene expression pro
fi
le data, and
putative regulatory relationships can then be validated
experi-mentally (
Hecker et al., 2009
). Co-expression network inference
thus represents a powerful analytical tool for expression pro
fi
ling
data, complementing the perturbation studies discussed above. As
activity of a given transcriptional regulator is con
fi
ned only to the
same cell as its target, only the information obtained from a single
cell or cell type provides accurate prediction without analytical
noise caused by sample heterogeneity. Transcriptome analysis of
fl
ow-sorted rod photoreceptors from wild type and
Nrl
/retina
has revealed multiple clusters of co-expressed genes, which likely
represent diverse regulatory events (
Akimoto et al., 2006
).
Co-expression analysis of newer and deeper RNA-seq data sets
should provide valuable insights, including those relevant for
identi
fi
cation of disease genes and pathways (see also Section
5.4
).
3.2.2. Transcription targets (
“
targetome
”
) of NRL and CRX
Differential gene expression analysis does not distinguish direct
transcriptional regulation from secondary regulatory events.
ChIP-seq analysis, on the other hand, assays direct physical interactions
between a transcription factor and the cognate DNA elements.
Recent studies have superimposed transcriptome and transcription
factor targetome data to identify biologically relevant target genes
of CRX (
Corbo et al., 2010
) and NRL (
Hao et al., 2012
). ChIP-seq
analysis of mouse retina demonstrated CRX binding to 67% of
mis-regulated genes in
Crx
/retina, likely representing direct CRX
targets (
Corbo et al., 2010
). Similarly, only a subgroup (15%) of genes
differentially expressed in
Nrl
/retina exhibited NRL ChIP-seq
peaks and thus are direct transcriptional targets of NRL (
Hao
et al., 2012
).
One of the challenges in deciphering targetome data is assigning
transcription factor binding to relevant genes. A majority of
NRL-and CRX-bound genomic DNA regions are in close proximity of or
within the genes. However, binding of regulatory factors far away
from genes is not uncommon and may exert transcriptional control
by chromatin looping. Recently, high throughput reporter gene
assays have successfully validated the enhancer activity of over
1000 CRX interacting genomic loci (
White et al., 2013
). Similar
large-scale enhancer assays and chromatin state mapping are
ex-pected to con
fi
rm the functional signi
fi
cance of distant ChIP-seq
peaks. Integrated analysis with gene expression data and long
distance chromatin association pro
fi
ling [by chromatin
conforma-tion capture (3C) assay (
Peng and Chen, 2011
) and its NGS
appli-cations such as 4C-seq and HiC-seq] (see
Table 1
) will further
facilitate the identi
fi
cation of novel transcription targets of key
photoreceptor transcription factors.
ChIP-seq analyses have identi
fi
ed thousands of genomic loci
(sequence regions) that are occupied by NRL or CRX
in vivo
, and
both transcription factors bind to common enhancer regions that
specify photoreceptor genes (
Hao et al., 2012
). In embryonic stem
cells (ESCs), master transcriptional regulators are reported to form
super-enhancers, atypical long enhancer clusters that are
associ-ated with unusually high level of mediators as well as
enhancer-associated epigenetic marks (
Whyte et al., 2013
). Subsequent
studies have demonstrated the importance of super-enhancers in
many differentiated cell types (
Hnisz et al., 2013
) and their
impli-cations in developmental and neurological disease (
Lee and Young,
2013
). Further investigations are necessary to evaluate whether
NRL- and CRX-bound enhancer elements exhibit characteristics of
super-enhancers and whether variants in these elements are
associated with retinal disease.
Fig. 4.Cell type-specific System-level analysis.A, Heat map of time course RNA-seq data generated from isolated, developing (P2 to P14) and mature (P28) mouse rod photore-ceptors. Dynamic gene regulation during rod photoreceptor maturation and clusters of genes with similar temporal expression patterns are apparent. Heat map was generated based on log2FPKM, and individual co-expression clusters were highlighted with different colors in the dendogram. FPKM, fragments per kilobase of exon per million reads.B, Transcript-level analysis of RNA-seq data enables detection of complex gene regulatory programs such as distinct splicing events during development. Alternative splicing ofBsg (basigin) gene during rod photoreceptor development is shown as an example. Coverage plots (dark gray histogram) and read alignments (gray blocks indicating individual sequence reads with thin blue horizontal lines connecting portions of sequence reads that are split between exons) show differential inclusion of the second exon (brown shade) in P2 and P28 rod photoreceptors. Expression level of each splice variant during rod development is plotted and shown on the right.C, System-level profiling of diverse chromatin signatures, including chromatin accessibility [DNase-seq (DNase I hypersensitivity sequencing)], active and repressive promoter histone modifications (H3K4me3 and H3K27me3, respectively; mini-ChIP-seq) and DNA methylation (bisulfite sequencing). Application of genome-wide analysis of chromatin states used to be limited toin vitrosamples and pooled tissues of heterogeneous cell types. Bisulfite sequencing and ChIP-seq have now been miniaturized forflow-sorted single type of neurons, which are available in small amounts. Shown are active gene expression and hallmark of active chromatin state of two select photoreceptor-specific genes,CrxandSlc24a1, in P28flow-sorted rod photoreceptors. Scale on y-axis of RNA, DNase, K4me3 and K27me3 tracks indicates RPM (reads per million reads). Average percent 5-methylcytosine (meDNA) within promoter (±1 kb from the tran-scription start site, highlighted with a gray shade) was plotted as a bar graph.