XXX-X-XXXX-XXXX-X/XX/$XX.00 ©20XX IEEE
Sensor Based Cost Modelling for a Knowledge
Support System Development
Hande TOKUCOGLU, Xun CHEN, Abdennour EL RHALIBI, Tahsin OPOZ
Faculty of Engineering and Technology, Liverpool John Moores University, Liverpool, United Kingdom [email protected], [email protected], [email protected], [email protected]
Abstract – Nowadays, many small or medium size
manufacturing companies face significant challenges of quality, cost and cycle time in their production life cycle. In order to deal with these challenges, the utilization of knowledge management system in their facilities becomes an appealing solution. However, most their current knowledge management system is not flexible enough and adequate for handling high amount of production data or calculating manufacturing cost of a product adaptively. Therefore, a novel knowledge support system framework for calculating unit product manufacturing cost through a generic cost model becomes necessary for small or medium size companies (SMC) to effectively optimise a manufacturing system in order to produce, repair or remanufacture products with the highest efficiency, best quality performance and lowest cost. This paper presents a generic cost model that considers production time based on sensors in a manufacturing system. This means the basic elements of model would adapt cycle time variation, which is one of the most important data of the generic cost models that will be obtained from the sensors on the machines.
Keywords— Manufacturing; Costing; Control; Optimisation; Knowledge support; System; Sensing; Database; Small or medium size enterprise (SME); Industry 4.0.
Introduction
Nowadays, it is important to serve products to customers responsively with 100% satisfactory in the full product life cycle. However, from time to time, companies have difficulties in fulfilling customer needs in a cost effective way. According to the surveys with the industrial partners, one of the considerable reasons of this problem is that conventional costing methods do not consider the cost variation that related to the various troubles in a manufacturing process. The conventional costing methods do not consider the influence of the process variation and the inefficiency in the production, which would not get penalty in conventional costing. Sometimes, lack of effective machine maintenance and process control could cause quality problems in a manufactured product, which
may need manufacture a new one or return for repair. The consequences of these deficiencies are longer cycle time of production leading to higher manufacturing cost of the products. The longer cycle time spent in the product improvement, delivery process, order filling and all kind of services of a facility introduce instability, generate extra cost and decrease customer satisfaction [1]. On the other hand, higher capital and labour costs in manufacturing that combined with high level of technological and competitive alterations, create difficulties for production companies in developed countries [2].
There are a few research, such as a smart knowledge based system is developed in order to forecast the manufacturing cost modelling of a product at the cognitive design level of product life cycle. Besides, the system contains a CAD solid modelling system, user interface, material excerpting, continuum/machine excerpting, and cost forecasting methods [3]. Moreover, a knowledge-based supplier selection and analysing system that includes cased – based reasoning decision system is created for outsourcing operations at Honeywell Consumer Products Limited in China. As a conclusion, through utilizing the system, the accretive performance of suppliers is updated consistently and automatically based on previous cases [4]. Lastly, an initial version of a hybrid system is enhanced through integrating Case-Based Reasoning (CBR) and Artificial Neural Networks (ANN) as a Product Unit Cost (PUC) estimating model for a Mobile Phone Company. Based on the cost model, a group of qualitative and quantitative factors are evaluated and appointed. Cased Based Reasoning is utilized in order to regain similar case for a new product and Artificial Neural Networks is applied for exploring the relationship between quantitative factors and the estimated PUC. This research presents a new estimation model with high preciseness for mobile phone production companies [5].
Furthermore, there are some researches in which some sensors were being used for quality control of a process: Some cost-effective sensors, including an accelerometer and GPS, were utilized in order to create an accelerometer-based system for gauging road roughness accelerometer-based on the vibrational response of roads for road maintenance [6]. Proceedings of the 25th International Conference on
Automation & Computing, Lancaster University, Lancaster UK, 5-7 September 2019
Moreover, a thermoresistive strain sensor was generated in order to detect the strains that were distributed in a random area of a transparent substrate in roll-to-roll manufacturing. Besides, sequential operations of sensor patterning by inkjet printing, material stabilization by flashlight sintering, thermal creation by Joule heating, and strain analysing by IR inspection can be successfully indicated through thermoresistive strain sensor [7].
As reviewed on available literatures, few sensing information was applied into manufacturing costing. In order to improve the performance of a manufacturing process and customer satisfaction, the paper presents an investigation that combines a database with sensor based cost models that are capable for calculating unit manufacturing cost more accurately and presenting the efficiency of the manufacturing process more clearly to the user. Here, the paper presents initial studies of the development of a knowledge support system framework of a generic cost model for small or medium size companies in order to calculate unit manufacturing cost of a product accurately in a database system that links to sensors in manufacturing systems. Besides, the system can select the most suitable machine in a facility pool for a specific manufacturing process. Moreover, it can give necessary information for the operator to choose manufacturing process steps and manufacturing techniques.
In the next section, there will be methodology of the research, which covers knowledge framework of the database, general cost model for calculating unit manufacturing cost, the experiments of data collection for the cost modelling with a power meter networked by WIFI technology. Subsequently, the benefits of the research will be explained and lastly, there will be a conclusion and future works of the research.
Methodology and Case Studies
The investigation of sensor based costing were conducted in two small size manufacturing companies, which will be expressed as Company 1 and Company 2, in order to give generic view in the study. First, a brief explanation about the content of the knowledge support system framework, subsequently, the creation of the general cost model will be expressed and the experimental tests with a power meter were undertaken in order to collect data for the cost model establishment. Lastly, there will be a description of the testing data transmission process using WI-FI technology.
A. Framework of the Knowledge Support System
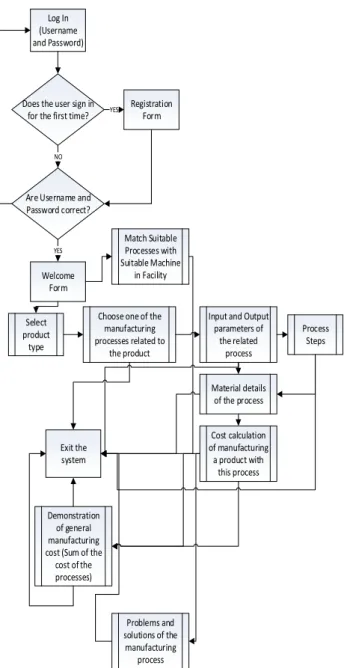
The knowledge support system to be utilized for annual unit manufacturing cost calculation, production process and scheduling optimization, has been generated by using Microsoft Access software. The structure of the knowledge support system is presented as a flowchart in Fig. 1.
According to the flowchart in Fig.1, the user enters the database with a registered user name and associated password. If the user utilizes the database for the first time,
the database leads the user to the registration form. After the user passes registration or log in process, he can choose a product type or match a manufacturing process with an appropriate machine in the facility from welcome form. Thereafter, if the user chooses a product type, the database offers to him the information of applicable manufacturing process. The information of the related process covers input and output parameters of the process, steps of the process, material details of the related product and further, problems that may been come across during the manufacturing process and their solutions. The last major information of the manufacturing process is the cost calculation of a product manufacture with the related process through utilizing general cost model and data obtained from the sensors on the related machine. Lastly, the database gives the annual total manufacturing cost by summing up the process costs that relate to product if the product is made from more than one manufacturing process.
Log In (Username and Password)
Does the user sign in for the first time?
Registration Form YES
Are Username and Password correct? Welcome Form NO YES NO Select product type
Choose one of the manufacturing processes related to
the product
Input and Output parameters of the related process Material details of the process Cost calculation of manufacturing a product with this process Problems and solutions of the manufacturing process Exit the system Demonstration of general manufacturing cost (Sum of the
cost of the processes) Process Steps Match Suitable Processes with Suitable Machine in Facility
B. Generic Cost Model for Calculating Unit Manufacturing Cost
The development of generic cost model for calculating annual unit manufacturing cost will be explained sequentially in following:
• Step 1: An initial time-based cost model was created in compliance with Segmentation Cost Estimation Method (SCEM) with breakdown approach [11-12]. After SCEM was taken into consideration, sub-formulas of the cost model were created as the segments of the cost model. Subsequently, sub-formulas and other cost parameters were gathered under four group: Fixed Cost, Variable Cost, Fixed Overhead and Variable Overhead Cost. Lastly, the related sub-formulas were combined with other cost parameters and initial general manufacturing cost model was obtained.
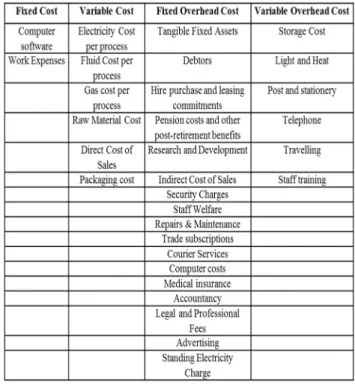
• Step 2: According to the survey with Companies, a core model, which are intermediary cost models between initial cost model and final cost model, were created based on initial general cost model and needs and requests of the companies. The core model is shown in Table I.
TABLE I. THE CORE MODEL PARAMETERS
The core model can be tailored for individual company with some small modification.
• Step 3: After the core model was created, the parameters of the model were combined under four group that were presented in Table 1 in order to generate the general cost model. It is seen that some
parameters need a sub-formula for an accurate calculation subsequent to combination of two core models. The sub-formulas were given in following: Electricity Cost per Process:
Total active energy *electricity price*cycle time (1) Fluid Cost per Process:
Total fluid consumption*unit fluid price*cycle time (2) Gas cost per Process [8]:
(Current Reading(Cubic meter)*Calorific value of
the gas)*1.02264)/3.6 (3)
Direct Cost of Sales:
Hourly salary of the operator*case time (4)
Packaging Cost:
Packaging Equipment Price*Packaging Time (5)
Hire Purchase and Leasing Commitments:
Insurance + Estate taxes + Rent of the facility (6)
Indirect Cost of Sales:
Hourly non-direct labour salaries*Administrate personnel working hours (7) Repairs & Maintenance:
Maintenance price of the machine*Time for machine
maintenance (8)
Storage Cost [9]:
Total Storage area cost/(total number of units shipped during previous 12 months + total number
of units that is stored currently) (9)
• Step 4: Based on the information of the previous steps, the general cost model for calculating annual unit manufacturing cost was created. The parameters of the cost model were showed in Table II.
As it can be seen in Table I and Table II, when the core model and initial cost model were joined, with the difference of the parameters of the core model of Company 1, “Work Expenses” is added into fixed costs and “Standing Electricity Charge” is attached to fixed overhead costs.
As a result of Step 4, the formula of the general cost model was generated and is given as Eq. (10):
Unit Manufacturing Cost= Fixed Cost + Variable Cost+ [Fixed Overhead Cost + Variable Overhead Cost]
(10) Based on the general cost model, this research can make difference in literature with its calculation of the electricity energy cost. The electricity cost of the manufacturing process will be considered as a variable cost, while overall electricity cost is being involved in variable overhead costs. Therefore, with this research, the electricity cost of a manufacturing process will be separated from overall electricity cost of a facility.
C. Obtaining Data from Company 1 for Creating a Core
Model
The experiment, for which is transferring and analyzing data from power meter on a machine to a computer in order to obtain data for calculating electricity energy cost of the manufacturing process, has three stages:
• Observation of individual pressing process steps • Measuring cycle time
• Calculation the cost of electrical energy consumption of the process.
• Calculating utilization rate of the machine during the experiment time.
• Analysing the power graph of the machine. The experiment was done through considering laser sintering process and laser sintering machine in Company 1 for seven days and the power meter was calculated three types of power that are given in the following according to current and voltage data:
• Active (Real) Power: It is power that is utilized or spread essentially in a circuit.
• Reactive (Non-Active) Power: It is known that reactive loads, for instance, inductors and capacitors, do not spread any power. However, they decrease the voltage and draw current. This situation gives a misleading effect that power is actually spread. This “phantom power” is called reactive power.
• Apparent Power: It is the combination of active power and reactive power. [10]
The minimum, maximum and average values of active, reactive and apparent power of laser sintering machine are presented in Table III. These three type of power were evaluated instead one type of power because it can be seen more clearly that whether the real power is utilized in the machine or not. In this situation, the value of average active power is positive; Therefore, it can be seen that real power were utilized during the process. As a reason of it, active power can be considered for the further cost calculations.
After the value of power types were certain, the cost of electrical energy consumption for laser sintering process was calculated based on the Eq. (11):
Cost of Electrical Energy = (Power Consumption (kW)
*Electricity Price (£/kWh) *Machine On Time (h))
(11) Based on power meter calculations, total cycle time is 167.97 hours and electricity price of Company 1 is 0.127 £/kWh. Therefore, considering the value of active energy in calculations, total cost of electricity energy consumption for laser sintering process in six days is £18.13.
The next aim of the experiment is calculating the utilization rate of the laser sintering machine for six days according to Eq. (12):
Utilization Rate of the Laser Sintering Machine = [(Number of Hours the machine works) \ (Total Working
Hours)] *100 (12)
Considering Eq (12), the utilization rate of laser sintering machine for six days is 53.37%.
TABLE III. VALUES OF ACTIVE, REACTIVE AND APPARENT POWER
Power Type Minimum Maximum Average Active Power (W) -0.000 2.085 0.851 Reactive Power (var) 0.000 7.257 1.020 Apparent Power (VA) 0.000 7.296 1.328
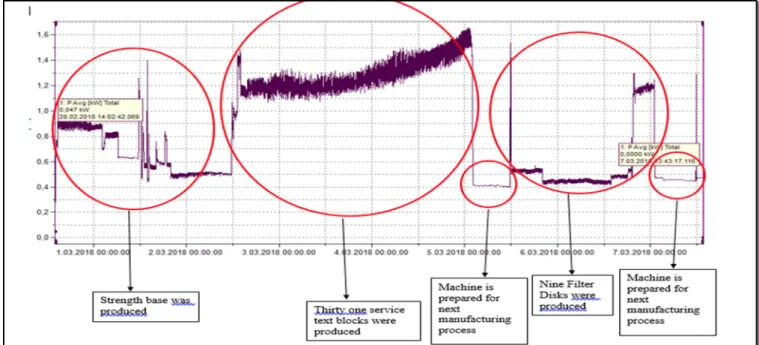
Lastly, active power graph of the laser sintering machine was analysed based on job scheduling document and was showed in Figure 2.
As it can be seen in Fig.2, one component and two types of products were manufactured: strength base as the component, service text blocks and filter disks as the products. Moreover, between the production processes of the products, the machine was prepared for the next process.
It is aimed that the evaluation process of the power graph will be automated through a suitable rule based expert system in the future.
Same experiment were done for Company 2 through assembling the power meter on cutting machine. As a result of the experiment, total electricity energy cost for Company 2 is £82.15 and the utilization rate of cutting machine is 42.15% for six days.
D. The Experiment with WIFI Technology of the Power
Meter
The aim of the experiment is testing WI-FI technology of the power meter in order to provide transferring data from the sensors on the machines to the database via internet; when this aim will be fulfilled, Industry 4.0. approach can be achieved in a facility. The steps of the experiment are given in following:
• The power meter was assembled to the milling machine in the laboratory of Liverpool John Moores University and machine started working. • It started logging and saving the voltage and
current data of the milling machine.
• The data were transferred from the power meter to the computer every two hours between 9:36 am and 15:36 pm without interfering the power meter while the power meter was still logging.
• When it was 15:36 pm, the power meter and the machine were shut down and the power meter disassembled from the machine
• The cost of milling process during the experiment time was calculated through general cost model that was explained in Section B.
After the steps of the experiment were performed, it is seen that the experiment proceeded for 6 hours 14 minutes 46 seconds and the number of current and voltage data that were collected in 6 hours 14 minutes is 375.
Fig. 2. Active Power Graph of Company
The last step of the experiment is the calculating manufacturing cost of milling process during the experiment. Therefore, the parameters of milling process cost calculation are given in following:
• Operator Cost
• Aluminium Cost (Material Cost) • Oil Cost
• Electricity Energy Cost
It is seen that only direct manufacturing cost parameters were considered while calculating manufacturing cost. Besides, electricity energy and total manufacturing cost were calculated according to Eq. (11) and Eq. (10). Therefore, the
cost of the milling process during 6 hours 14 minutes is £71.84.
As a conclusion of the experiment, it is seen that data transfer can be accomplished from power meter that is assembled to the machine to the computer with WI-FI technology without interfering the power meter while it was working. This kind of data transfer can provide Industry 4.0 approach in a manufacturing facility.
Potential Benefits of Sensor Based Costing Method As discussed above, it could be concluded that potential beneficial outcomes of the research are:
• Providing rational decision-making mechanism for the optimization of manufacturing processes in terms of cost, productivity and quality.
• Offering precise applicable sensor based cost model for SMC to analyse the unit manufacturing cost of individual product.
• Ensuring the improvement of service efficiency and quality.
• Setting a foundation for Industry 4.0 approach in a manufacturing system through the sensor based cost model.
• The sensors that will be applied on machines in a facility show efficiency of production and the power level of the machine, which is one of the outcomes of the sensors, indicates potential quality problems and productivity problems of the manufacturing process.
Conclusion and Future Works
This research presents the studies of the development of a knowledge support system framework with a generic cost model for small or medium size companies. The system is capable to calculate annual unit manufacturing cost of a product accurately in considering the machine utilisation rate. Through the power monitoring the process performance can be assessed and such information can be stored in a database for future reference.
In order to obtain more reliable result from the cost models and to track the manufacturing process more effectively, a manufacturing process efficiency parameter, which is the utilization rate of the machine, will be integrated into the cost model directly providing a good mechanism to identify the best operation strategy.
As it is explained in the Section D, the active power-time graph of a machine, which shows its power levels during the observation time, can be acquired from a power meter on the machine. Based on the related track of the power level, utilization rate of the machine could be determined automatically by apply a suitable machine learning threshold method. In this way the real time dynamic costing would
become possible, which will significantly improve the manufacturing costing accuracy and effectiveness.
REFERENCES
[1] Meyer, C., 2010. Fast Cycle Time: How to Align Purpose, Strategy, and Structure for Speed. New York: Simon and Schuster.
[2] Yin, Y., Stecke, K. E., Swink, M. & Kaku, I., 2017. Lessons from seru production on manufacturing competitively in a high cost environment. Journal of Operations Management, 49(51), pp. 67-76
[3] Shehab, E. & Abdalla, H., 2001. Manufacturing cost modelling for concurrent product development. Robotics and Computer Integrated Manufacturing, Volume 17, pp. 341-353..
[4] Choy, K., Lee, W., Henry, C. L. & Choy, L., 2005. A knowledge-based supplier intelligence retrieval system for outsource manufacturing. Knowledge-Based Systems, Volume 18, pp. 1-17
[5] Chang, P., Lin, J. & Dzan, W., 2012. Forecasting of manufacturing cost in mobile phone products by case-based reasoning and artificial neural network models. J Intell Manuf., Volume 23, pp. 517-531.
[6] Bidgoli, M. A., Golroo, A., Nadjar, H. S., Rashidabad, A. G., & Ganji, M. R. (2019). Road roughness measurement using a cost-effective sensor-based monitoring system. Automation in Construction, 140-152.
[7] Liao, K.-H., An, C.-H., & Lo, C.-Y. (2019). Continuous inkjet-patterned and flashlight-sintered strain sensor for in-line off-axis detection in Roll-to-Roll manufacturing. Mechatronics, 95-103.
[8] Gas, B. (2019, April 18). Your Energy Bill - How Energy Bills Calculated? Retrieved from British Gas: https://www.britishgas.co.uk/products-and-services/gas-and-electricity/tips-and-advice/energy-bill-cost.html
[9] Raley, T. (2019, April 19). How to Calculate Warehouse Storage Costs. Retrieved from Sciencing:
https://sciencing.com/how-5869978-calculate-warehouse-storage-costs.html
[10] Tutorials, E. (2019, April 18). Power in AC Circuits. Retrieved from Electronics Tutorials: https://www.electronics-tutorials.ws/accircuits/power-in-ac-circuits.html
[11] Niazi, A., & Dai, J. S. (2006). Product Cost Estimation: Technique Classification and Methodology Review. Journal of Manufacturing Science and Engineering, 563-575.
[12] Aroba, J., Cuadrado-Gallego, J. J., Sicilia, M.-A., Ramos, I., & Garcia-Barriocanal, E. (2008). Segmented Software Cost Estimation Models based on Fuzzy Clustering. Journal of Systems and Software, 1944-1950.