Application of Wireless Sensor Network based on LoRa
in City Gas Meter Reading
https://doi.org/10.3991/ijoe.v13i12.7887
Kun Wang
Xi'an Aeronautical University, Xi'an, China
Abstract—At present, the common meter reading method in gas meter read-ing system is manual. The meter reader enters the meter readread-ing system to cal-culate the cost after getting the reading. This work is not only labour-intensive, but also inefficient. In addition, incorrect reading may occur due to human er-rors. With the development of the wireless communication technology, a wire-less communication technology named LoRa for long-distance and low-power-consumption devices appeared. LoRa is a wireless communication technology with long transmission distance, low power consumption, low transmission speed, low complexity and low cost. It is mainly used in automatic control and internet of things. Through the comparison and analysis of several wireless communication technologies, a gas meter reading platform based on LoRa spread spectrum and wireless sensors is proposed. First of all, this paper briefly introduces the LoRa wireless communication technology and machine vision technology. Secondly, it gives a detailed introduction to the overall design of the system which includes system architecture design, information acquisition terminal, image acquisition module and wireless sensor module. Finally, an ex-periment is carried out in a residential area. The results show that the gas meter reading platform based on LoRa and wireless sensor network has a high practi-cal value.
Keywords—LoRa, wireless sensor network, gas meter reading
1
Introduction
In many cities, most of the gas meters are still traditional mechanical ones, which require meter readers to enter users’ homes regularly to obtain meter readings. How-ever, with the acceleration of pace of life and the development of urbanization, the success rate of meter reading is becoming lower and lower, which makes it more difficult for gas companies to calculate the gas bill. In this context, the wireless meter reading technology has received great attention and saw significant development [1,2].
gas companies. So, the wireless remote technology is very suitable for new high-rise residential areas [3]. The traditional wireless remote meter reading system has the problems such as complex network, high cost, high power consumption and high error rate. Low Power Wide Area Network (LPWAN) has emerged and received a great deal of attention [4]. Compared with traditional wireless networks, LPWAN requires lower cost and lower power consumption. In addition, it has a strong pene-trating power, which means a greater signal transmission range. Over the years, sev-eral communications technologies such as Sigfox, LoRa and Weightless have ap-peared. Among them, LoRa technology is the most widely used technology in LPWAN [5,6].
For the existing traditional gas meters in the society, due to their economic cost, they cannot be replaced completely by remote wireless meters. For this kind of meter, we can use the machine vision technology and wireless sensor to realize remote meter reading. The basic idea is to convert the mechanical readings into digital signals and transmit them through the LoRa wireless communication technology by adding the image recognition module and the information transfer module on a traditional meter [7]. The meter reading method based on machine vision avoids the waste of resources brought by meter replacement, and effectively improves the economic benefits of gas companies [8].
In this paper, a gas meter reading platform based on LoRa spread spectrum and wireless sensor is proposed through the comparison and analysis of several wireless communication technologies. First of all, this paper briefly introduces the LoRa wire-less communication technology and machine vision technology. Secondly, it gives a detailed introduction to the overall design of the system which includes system archi-tecture design, information acquisition terminal, image acquisition module and wire-less sensor module [9]. Finally, an experiment is carried out in a residential area. The results show that the gas meter reading platform based on LoRa and wireless sensor network has a high practical value.
2
Basic Theory and Technology
Table 1. Parameter comparison
Distance Maximum rate Consumption
Blutooth 10 m 2 M/S Low
LoRa 0~15 km 600 KB/S Low
RFID 0~100 m 10 KB/S Low
Wifi 0~60 m 54 M/S High
ZigBee 0~1500 m 250 KB/S Low
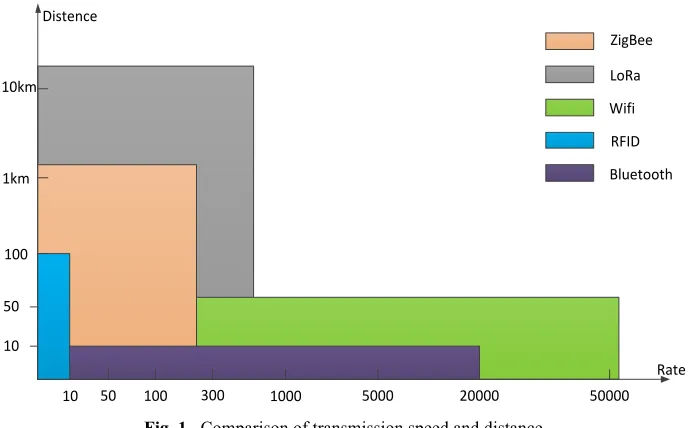
Different wireless communication technologies have different applications, in which the transmission rate and transmission range are the key factors to determining the specific applications. These wireless communication technologies are compared as follows.
!" #" !"" $"" !""" #""" %"""" #""""
!" #" !"" !&' !"&'
()*+,,
-./0 1)2) /345 +67,8..89
/08, 5):8,;<,
Fig. 1. Comparison of transmission speed and distance
As can be seen from the above figure, the higher the data transmission rate is, the farther the communication distance will be, and the greater the power consumption will be. However, LoRa not only achieve long-distance communication, but also requires lower power consumption, so it is very suitable for large-scale networks.
LoRa packets consist of preamble, header, data payload, and CRC payload. The packet format is shown in Figure. 2.
!"#$%&'# (#$)#" *+* !$,'-$) .-$)/*+*
0(1+ 02*!$,'-$) 03*
When the terminal device is initialized, the key parameters, which the system can set, include signal bandwidth (BW), spread spectrum factor (SF) and coding rate (CR). The range of CR and SF are as follows.
1 4
6 12
CR SF
! !
"
# ! !
$ (1) The average transmission speed of the LoRa wireless communication network can be calculated by the following formula.
2SF
T BW
= (2)
Then, the transmission time of the preamble can be obtained by the following for-mula.
( 4.25)
pre pre
T = N + !T (3)
In the above formula, Npre represents the length of the preamble, and its value can be determined by the algorithm. The number of transmission times for headers and payloads can be calculated by the following formula:
( 2 )
8 4 16
max( [ ] ( 4),0)
4
PL SF CRC
pay SF DE
N = ceil ! !+ " CR+ (4)
In the above formula, PL and CRC respectively represent the payload and the number of bytes of the CRC load, which meet the following conditions.
1 255
1 255
PL CRC
! !
"
# ! !
$ (5) Therefore, we can get the transmission time of the header and payload and the CRC load by the following formula.
pay pay
T =N !T (6)
Finally, the formula for calculating the transmission time of the entire packet is as follows.
p pre pay
T =T +T (7)
3
Machine Vision Technology
comprehensive technology, which includes digital processing, mechanical engineer-ing, lightengineer-ing, optical imagengineer-ing, sensor technology, analog and digital video technology, computer technology and human-computer interface technology. The coordination of all technologies constitutes a complete machine vision system [11-12].
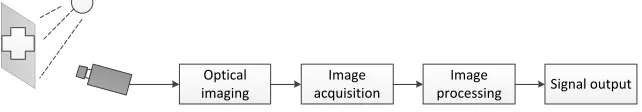
The complete machine vision system consists of an optical imaging module, an image acquisition module, an image processing module and a signal output module. Under certain illumination conditions, the optical imaging module and image acquisi-tion module are used to record the image signals of the target scene. The image pro-cessing module uses the image propro-cessing technology to process the image which is obtained by A/D conversion. Finally, the signal output module is used to extract the interesting feature information and send it out. The structure of the machine vision system is shown in Figure. 3.
!"#$%&'(
$)&*$+* &%./$0$#$1+,)&*-( "21%-00$+*,)&*-( 3$*+&'(1/#"/#
Fig. 3. Structure of the machine vision system
The gas meter reading recognition technology based on machine vision mainly us-es tilt correction technology and image enhancement technology to obtain reading information. When the image acquisition device has a certain angle deviation, it will cause the actual image to produce a certain tilt. When the tilt is large enough, it will affect the subsequent image segmentation. Therefore, the tilt correction technique is an essential step.
Suppose that (x, y) are the coordinates of any point on the image, and the angle be-tween the abscissa is !, then the coordinates can be expressed in the following formu-la. cos sin x r y r
!
!
= " # $ = "% (8) Where, r is the distance between (x, y) and the origin of coordinates. After tilting by the angle !, the coordinate becomes (x1, y1).
1
1
cos( ) cos sin sin( ) cos sin
x r x y
y r y x
! "
"
"
! "
"
"
= # $ = # + #
%
& = # $ = # $ #
' (9)
Thus, the relationship between (x, y) and (x1, y1) can be represented by the follow-ing formula.
0 1
1 0
cos sin sin cos
x x y y
!
!
!
!
" # " # " #= $ %
$ % $& %
' (
The purpose of image enhancement is to improve the quality of images, enrich the amount of information, and enhance the image interpretation and recognition effect.
In general, image enhancement mainly consists of five steps. 1.Count the number of pixels in each grey level of the original image. 2.Calculate the probability density of each grey level in the original image.
( ) l
r l
N p r
N
= (11)
3.Obtain the cumulative distribution function.
0
( )
l
l r l
i
s p r
=
=
!
(12)4.Calculate the output grey level
1
[( 1) ]
2
l l
k =Int m! s + (13)
5.By using the mapping relation of rl and kl, the grey level of the original image is modified, and the enhanced image is obtained.
Due to its high efficiency, high precision and low cost, machine vision is widely used in industrial inspection, automatic driving, intelligent transportation, military and other fields.
4
Design of System Platform
4.1 Design of overall architecture
The wireless meter reading platform based on LoRa mainly consists of terminal nodes, routing nodes, coordination nodes, 4G communication network, server and terminal equipment. The overall structure is shown in the Figure 4.
LoRa network is a typical star topology, and the terminal node can directly interact with the coordination node, which effectively reduces the network complexity and energy consumption. The server is responsible for cost calculation and other business analysis, and the results are shown to users on user terminal.
4.2 Design of system hardware
The hardware structure of new meter is shown in Figure 5.
!!"" $%&'''(()))** !"#$%&'()*
! ! ! ! ! ! ! ! ! !
! ! ! ! ! ! ! ! ! !
! ! ! ! ! ! ! ! ! !
! ! ! ! ! ! ! ! ! !
Fig. 4. Overall structure of wireless meter reading platform based on LoRa
!"#
$%&'()*+,'-'%*'./0(*)12&
341%-'51++&%-64%0&-0176%,+2 81%9&-'*+()*%-7*:4%& ;4<<&)
;1((&)=
>,2+1%-()1+0?&)-7*:4%&
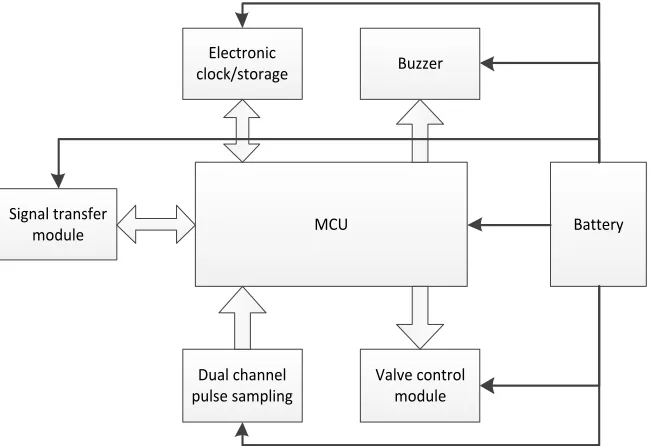
The information acquisition terminal mainly consists of a micro control unit (MCU), a power supply module, buzzer, an electronic clock/storage, a signal trans-mission module, a double channel pulse sampling module and a valve control module.
MCU is the brain of the whole terminal device, which is responsible for controlling the operation of other modules of the terminal and the analysis of the signals. The signal transmission module is responsible for transmitting gas meter information to the routing nodes and transferring the control instructions from the routing node to the MCU. The valve control module is mainly responsible for controlling the gas pipe-line. When receiving the closing instruction from MCU, the valve control module in the gas meter drives the valve to close by a direct current motor. Only when receiving the unsealed instruction, the valve control module will open again. The buzzer is used to make a prompt when the power is low. The function of memory is to provide pow-er-down storage for the system, while the electronic clock provides the time basis for the measurement work of the system.
In order to reduce the power consumption of the equipment, MCU keeps the sleep state before being activated, and periodically monitors the wireless signals. Once the activation signal is received, the MCU will enter the communication program. The terminal has the function of carrying out bidirectional communication with the sink node, which brings it the ability of reading instructions and returning data.
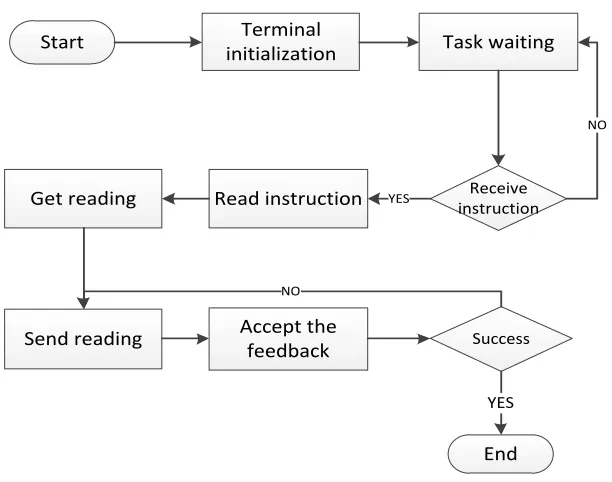
The main working flow of the new terminal which can transfer information by Lo-Ra is shown in Figure. 6.
!"#$" ()("(#*(,#"(-)%&$'()#*+
.&/&(0&+ ()1"$2/"(-) .+()1"$2/"(-)
4&"+$()5
!&)3+$()5 6//&7"+"8&+9&&3:#/; !2//&11 %#1;+<#("()5
=)3 >=!
>=!
?@
?@
5
Experiment and Result Analysis
In order to verify the comprehensive performance of LoRa wireless meter reading network, this paper analyzes from meter reading success rate and meter reading accu-racy. Through cooperation with the gas company, we conducted experiments on the new wireless gas meter in area A. At the same time, in order to verify the perfor-mance of the machine vision module, we carried out experiments by adding relevant modules on traditional mechanical meters in the old residential area B. During the experiment, each meter in residential area was read four times. Generally, we use the success rate Rs to represent the performance of gas meters for transmitting infor-mation over the Lora network.
100% success s
all
N R
N
= ! (14)
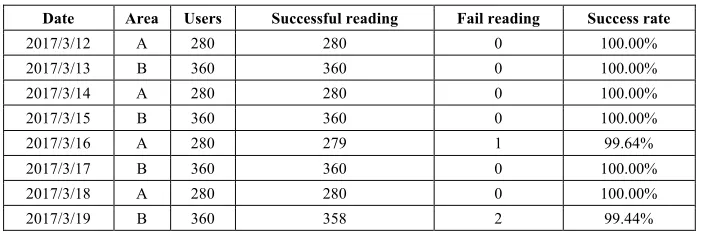
The success rate of meter reading is shown in Table. 2.
Table 2. The success rate of meter reading
Date Area Users Successful reading Fail reading Success rate
2017/3/12 A 280 280 0 100.00%
2017/3/13 B 360 360 0 100.00%
2017/3/14 A 280 280 0 100.00%
2017/3/15 B 360 360 0 100.00%
2017/3/16 A 280 279 1 99.64%
2017/3/17 B 360 360 0 100.00%
2017/3/18 A 280 280 0 100.00%
2017/3/19 B 360 358 2 99.44%
From Table. 2, we can find that the success rate of the new LoRa wireless gas me-ter is 100%, which means that the new meme-ter has a good signaling transmission effect. The reason for this performance is that the LoRa uses low frequency bands, leading to its stronger penetration. What is more, the success rate of old meters added with the machine identification module and signal transmission module is relatively low be-cause of the compatibility between different modules.
In order to verify the accuracy of the two kinds of meters, we randomly sampled some meters from residential area A and B for verification, and the verification results are shown in Table. 3. Meanwhile, !! X is used to represent the accuracy of data collection.
100% correct ac
sample
N R
N
Table 3. The accuracy rate of meter reading
Date Area Sample number Correct Error Accuracy
2017/3/12 A 80 80 0 100.00%
2017/3/13 B 100 96 0 96.00%
2017/3/14 A 80 80 0 100.00%
2017/3/15 B 120 115 1 95.83%
2017/3/16 A 90 90 0 100.00%
2017/3/17 B 100 99 1 99.00%
2017/3/18 A 90 87 0 96.67%
2017/3/19 B 90 90 0 100.00%
Through onsite verification, we found that the accuracy of the meter reading in res-idential area A was 100%, which means that the whole performance of new meters is very excellent. The new type of gas meter fully meets the needs of actual manage-ment. On the other hand, the accuracy of the gas meter combined with different mod-ules is relatively low. Through the analysis, we find that only when the situation like Figure. 7 occurs, the transmitted readings are not correct.
Fig. 7. Meter with failed reading
Since the rotor of the gas meter can deviate from normal operation, the machine vi-sion module cannot extract the correct reading information if the deviation reaches a certain extent. Thus, an excellent image processing algorithm is the key to improving the accuracy. Due to the limited computing power of MPU, and the relatively small memory capacity, the machine vision module cannot run a complex image processing algorithm. In a word, despite some errors in the wireless meter reading system based on machine vision, the errors are basically within the acceptable range, so we still consider it as a very practical solution.
6
Conclusions
LoRas is a wireless transmission technology with low power consumption and long transmission distance, which has been widely used all over the world. In this paper, wireless sensor network and LoRa technology are integrated and applied into the field of gas meter reading, which solves the shortcomings of the traditional method in me-ter reading. The experimental results show that the gas meme-ter reading system based on LoRa wireless communication network has high efficiency and accuracy, and also can effectively reduce the labor costs of gas companies. Besides, with the development of the image recognition algorithm, there will be more excellent algorithms to make up for the shortcomings of existing image recognition algorithms. We believe that in the future, Lora will be more and more popular in various fields, especially in Internet of things.
7
References
[1]Zhang X.C. (2016). A Study of Remote Meter Reading System for Gas Meter based on
Machine Vision, 3-10
[2]Epinosa F., Rendon Rodriguez G. (2015). A Zig Bee wireless sensor network for
monitor-ing an aquaculture recirculatmonitor-ing system, Journal of applied research and technology, 10(3), pp. 380-387.
[3]Jin C.J. (2013). Design and Development of Gas Meter Reading System based on Wireless
Sensor Networks, pp. 4-12.
[4]Luo G.Y. (2016). Lo Ra-based water meter reading system design and implementation,
8-21
[5]Sanderson C., Paliwal K. (2002). Information Fusion and Person Verification Using Seeeh
& Face Infornration, pp. 5-30.
[6]Sun Y. (2000). Hopfield neural network based algorithms for image restoration and
recon-struction �algorithms and simulations, IEEE Transactions on Signal and Processing,
48(7), pp. 2105-2118.
[7]Sahameh S., Saeid M. (2013). Potential application of machine vision to honey
characteri-zation, Trends in Food Science & Technology, 30(2), pp. 174-176. https://doi.org/10.1016/
j.tifs.2012.12.004
[8]Mammarella M., Campa G., Napolitano M.R., Fravolini M.L., Gu Y., Perhinschi M.G.
(2008). Machine vision/GPS integration using EKF for the UAV aerial refueling problem, IEEE Transaction on System Man and Cybernetics, 38(6), pp. 792-800.
https://doi.org/10.1109/TSMCC.2008.2001693
[9]Petajajarvi J. (2017). On the coverage of LPWANs: range evaluation and channel
attenua-tion model for LoRa technology, Internaattenua-tional Conference on ITS Telecommunicaattenua-tions, 13-29.
[10]Lewark U., Antes J., Walheim J. (2013). Link budget analysis for future E-band gigabit
satellite communication links, CEAS Space Journal, 4(1), pp. 41-46
https://doi.org/10.1007/s12567-013-0030-0
[11]Aref M., Sikora A. (2014). Free Space Range Measurements with Semtech LoRa
[12]Ando N., Takashima M., Doi Y., Sugitate Y. (2013). Automatic meter reading system adopting automatic routing technology, IEEE Transmission and Distribution Conference
and Exhibition, 3, pp. 2305-2309. https://doi.org/10.1109/TDC.2002.1177824
8
Author
Kun Wang is Xi'an Aeronautical University of China, Xi'an 710077. She is mainly
engaged in the research of electronics and communication.