2017
College Students' Sleep Quality
College Students' Sleep Quality
Yahya Ahmed AlamirFollow this and additional works at: https://researchrepository.wvu.edu/etd Recommended Citation
Recommended Citation
Alamir, Yahya Ahmed, "College Students' Sleep Quality" (2017). Graduate Theses, Dissertations, and Problem Reports. 5047.
https://researchrepository.wvu.edu/etd/5047
This Dissertation is protected by copyright and/or related rights. It has been brought to you by the The Research Repository @ WVU with permission from the rights-holder(s). You are free to use this Dissertation in any way that is permitted by the copyright and related rights legislation that applies to your use. For other uses you must obtain permission from the rights-holder(s) directly, unless additional rights are indicated by a Creative Commons license in the record and/ or on the work itself. This Dissertation has been accepted for inclusion in WVU Graduate Theses, Dissertations, and Problem Reports collection by an authorized administrator of The Research Repository @ WVU. For more information, please contact [email protected].
College Students’ Sleep Quality
Yahya Ahmed Alamir, BSN, MAP, PhD
Dissertation submitted to the School of Public Health at West Virginia University
in partial fulfillment of the requirements for the degree of
Doctor of Philosophy in
Public Health/ Social and Behavioral Sciences
Keith J. Zullig, M.S.P.H., Ph.D., Chair Sijin Wen, PhD
Hawley Montgomery-Downs, PhD Alfgeir L. Kristjansson, PhD Ranjita Misra, PhD, CHES, FASHA
Social and Behavioral Sciences Department
Morgantown, West Virginia, 2017
Keywords: Sleep quality, College students, NMUPD, BMI, HBM, TPB Copyright 2017 Yahya Alamir
Abstract
College Students’ Sleep Quality
Yahya Ahmed Alamir, MAP
Poor sleep quality among college students increases the risk for lower grade point averages, compromised learning, impaired mood, and motor vehicle accidents; and associated with several unhealthy behaviors and outcomes including substances /drugs use (alcohol and medications), and weight gain. Therefore, we assessed college sleep quality in relation to the NMUPD and BMI among a large sample of college students using the fall 2010-spring 2011 national survey data (American College Health Association - National College Health Assessment (ACHA-NCHA)). In addition, we used theoretical model integrating HBM perception constructs and behavioral intention to describe and predict college students’ sleep quality among a sample of WVU undergraduate students. The goal of this dissertation was to better understand students’ sleep quality. Study results can help in establishing theoretically driven interventions to promote students’ sleep quality.
Poor sleep was common among a large national sample of college students and among WVU college students. The NMUPD was significantly associated with poor sleep quality, and poor sleep quality significantly increases the predicted values of BMI and increases the risk of being overweight and obese. In addition, poor sleep quality was also associated with having more unhealthy days among WVU students. The HBM and the behavioral intention (TPB) have significant roles in prediction poor sleep quality among a sample of WVU college students. Our results extend the current knowledge regarding the association between NMUPD and poor sleep quality, the association between poor sleep quality and overweight and/or obesity, the association between poor sleep quality and poor HRQOL, and the significant roles of HBM and behavioral intention in explaining sleep quality among college students. Moreover, we add to the current literature the influence of the HBM on behavioral intention, which make a very significant combination in predicting sleep quality among college students. Therefore, assessment of college students’ sleep quality should include screening for NMUPD, overweight and obesity, HRQOL as potential risk factors for poor sleep, and may all be interrelated.
Acknowledgement
This project would not have been possible without the love, support, and encouragement I received from my mother, wife, kids, family, and friends. A great and special thank I must send to my mother (Mrs. Marium Alamir) who always prays for me for success. My wife (Mrs. Ebtehal Alamir) and my kids (Master. Ayham, Master. Ayman, and my little girl Maria) have great contributions to my success in producing this work. Always I realize how much they sacrificed so that I could have time away from them to do my work. I really, do not have words to adequately describe my deep gratitude for all they have provided me, though I hope to show them more achievements to come. I am not also forgetting my brothers and sister, my brothers in law, who always standing by me given all kinds of support. Finally, I would like also to thank my friend Mr. Riyadh Alhazmi, who always encourage me to keep the hard work. Thank you all for everything I have got from you that keep me on the hard work every day.
Table of Contents
Abstract ... ii
Acknowledgement ... iii
Introduction ... 1
Sleep: definition and significance ... 1
Trends and prevalence of poor sleep ... 4
Significance and Purpose ... 5
The Relationship between the Nonmedical Use of Prescription Drugs (NMUPD) and Sleep Quality among a National of College Students... 7
Introduction ... 7
Material and Methods ... 10
Instrumentation ... 10 NMUPD ... 10 Sleep Quality ... 11 Covariates ... 12 Data Analysis ... 12 Results ... 12 Sample characteristics ... 12
Sleep and NMUPD ... 13
Associations between NMUPD and sleep ... 13
Discussion ... 14
Limitations ... 19
Conclusion ... 19
The Relationship between Sleep Quality and Body Mass Index (BMI) Measures among a National Sample of College Students ... 21
Introduction ... 21
BMI/Obesity ... 21
Sleep and BMI/Obesity ... 22
Significance and Purpose ... 25
Research Question, Aim, and Hypothesis ... 25
Research questions ... 25
Method ... 27
Study design, Data source and Population ... 27
Instrumentation ... 28
Sleep Quality ... 28
Body Mass Index (BMI) (dependent variable) ... 29
Covariates ... 30
Data Analysis ... 32
Results ... 33
Sample characteristics ... 33
Sleep Quality and the Body Mass Index (BMI) description... 34
The association between sleep and BMI ... 35
Differences in sleep quality among the different BMI classes ... 35
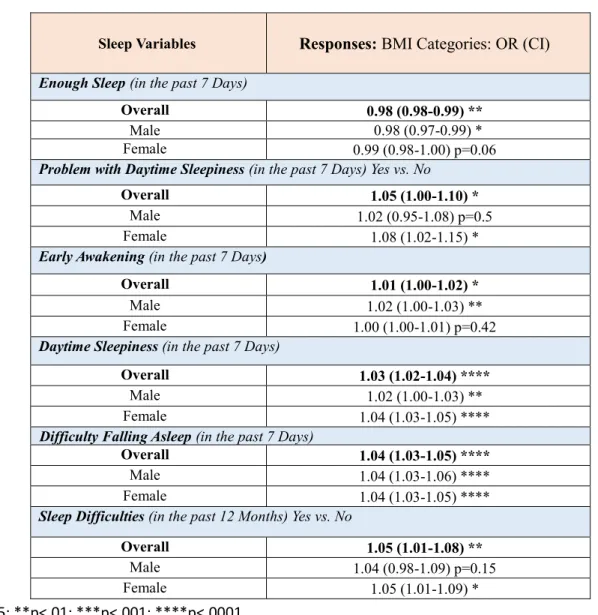
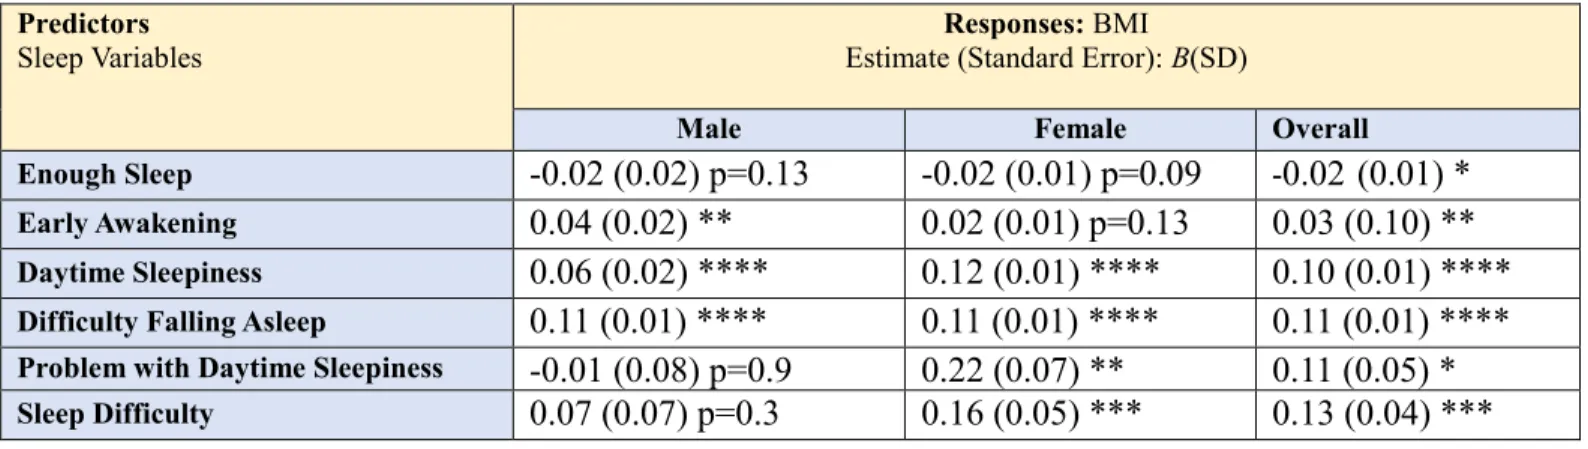
The association between the different sleep quality aspects and BMI measures (multivariate ordinal regression and Linear Regression analyses) ... 37
Discussion ... 38
Limitation ... 43
Conclusion ... 44
A Theory-based Description of Sleep Quality and Its Impact on Health-Related Quality Of Life Using Health Belief Model and Behavioral Intention among a Sample of WVU Undergraduates Students ... 45
Introduction ... 45
Health Belief Model and Theory of Planned Behavior ... 45
Theory based description/prediction of sleep quality ... 45
Significance and Purpose ... 46
Research questions, Aims, and Hypotheses ... 47
Research questions, ... 47
Description of the proposed theoretical framework ... 48
Elements of the framework ... 48
Conceptual and operational definitions of the Model’s elements: ... 49
External factors ... 49
HBM Constructs ... 49
Behavioral Intention (TPB Construct) ... 51
Model assumptions ... 52
Literature Review ... 53
Model’s external factors and sleep (first research question) ... 53
Race/Ethnicity ... 53
Gender ... 53
SES (for both research questions) ... 54
Other key important covariates (second research question) ... 55
Knowledge ... 55
Sleep related factors ... 55
Bedroom environment ... 56
Drinks ... 57
HBM, Behavioral intention and Sleep ... 58
HBM Perception Constructs and sleep ... 58
Behavioral intention and sleep ... 59
Sleep and HRQOL ... 60
Theoretical Rational ... 61
Method ... 62
Study Design, Setting and Population ... 62
Sampling ... 62
Sample size and Power analysis ... 62
Participants’ recruitment ... 63
The Survey (Instruments) ... 65
(see Appendix D) ... 65
Health related quality of life: HRQOL–14 "Healthy Days Measure" ... 65
Sleep Quality Scale (Pittsburgh Sleep Quality Index [PSQI]) ... 67
The Theory of Planned Behavior Instrument (Behavioral Intention) ... 68
The Health Belief Model (HBM) Instrument ... 69
Perceived susceptibility scale: ... 69
Perceived severity scale: ... 69
Perceived benefits scale: ... 70
Perceived barriers scale: ... 70
Questions related to the external variables ... 71
SEM Testing ... 72
Model’s variables ... 73
Results ... 74
Sample characteristics: ... 74
Demographics ... 74
Sleep quality, HRQOL and the behavioral constructs ... 74
Structural Equation Modelling (SEM) ... 75
Multivariate Linear Regression Model ... 77
Discussion ... 78 Conclusion ... 83 Limitation ... 84 Summary ... 84 REFERENCES ... 87 Appendix A ... 99
Aim1, Results’ Tables ... 99
Table 1. Sample Characteristics (F=Frequency, %= percentage) ... 100
Appendix B ... 103
Aim2, Results’ Tables and Figures ... 103
Appendix C ... 124
Aim3, Results’ Tables and Figures ... 124
... 133 Appendix D ... 135 Aim3, Survey ... 135 Appendix E ... 185 Corresponding letters ... 185 Appendix F ... 192 IRB Approval ... 192
Introduction
Sleep: definition and significance
Sleep is described as a complex combination of behavioral and physiological processes (Kryger, Roth, & Dement, 2011). Commonly, sleep is defined as a behavioral state characterized by reduced responsiveness to stimuli, decreased awareness and interaction with the environment, muscle relaxation, and reduced movement (Benca, 2012; Kryger et al., 2011). The physiological definition of sleep refers to a period of intense physiological and neurological activities including changes in the brain activities during the different stages of sleep (McLaughlin Crabtree & Williams, 2009). A typical night’s sleep (e.g. 7-8 hours of sleep duration among adults), passes through an average of four to five recurring cycles; each cycle comprises four stages of sleep. The average length of the first cycle is approximately 70 to 100 minutes, which then increases to an average of 90-110 minutes for the second and later cycles (Benca, 2012; Kryger et al., 2011). Stages of sleep are divided into non-rapid eye movement (NREM), and rapid eye movement (REM) (American Sleep Association [ASF], 2015; Benca, 2012; Kryger et al., 2011; National Institute of Neurological Disorders and Stroke [NINDS], 2014; National Sleep Foundation [NSF], 2015a; Robotham, Chakkalackal, & Cyhlarova, 2011).
NREM sleep consists of approximately 75%-80% of the total sleep duration and
comprises three stages: NREM 1 or stage 1, NREM 2 or stage 2 and NREM 3 or stage 3 (ASA, 2015; Benca, 2012; Kryger et al., 2011; NINDS, 2014; NSF, 2015a; Robotham et al., 2011). In NREM Stage 1, individuals progress through drowsiness and then light sleep. This stage represents an essential bridge between wakefulness and sleep; where eye movement, muscle activity, and breathing all slow down. In general, sleep in this stage can be easily disrupted; and individuals can be easily awakened from sleep (ASA, 2015; Benca, 2012; Kryger et al., 2011;
NINDS, 2014; NSF, 2015a; Robotham et al., 2011). In NREM stage 2, eye movement stops, muscle activity decreases, breathing is regular and slow, and body temperature drops. In this stage, individuals become disengaged from the outside world; they may still hear sounds, but are unable to understand them. Then, individuals move into deep sleep during NREM stage 3 (it is also called slow-wave sleep (SWS)). In this stage, there is no eye movement or muscle activity, and breathing becomes slower. It is difficult to wake in this stage, and individuals become less responsive to, and aware of, sounds. In fact, tissue growth and repair occurs, along with energy restoration in this stage. Dreams can occur, but not as common as random eye movement (REM) stage (ASA, 2015; Benca, 2012; Kryger et al., 2011; NINDS, 2014; NSF, 2015a; Robotham et al., 2011). Finally, REM is the last stage in the sleep cycle, which describes an active stage of the brain and accounts for around 20% to 25% of total sleep duration. In this stage, individuals’ muscle will be completely paralyzed and unresponsive; and more rapid and irregular breathing occurred. The majority of dreams occur in this stage (ASA, 2015; Benca, 2012; Kryger et al., 2011; NINDS, 2014; NSF, 2015a; Robotham et al., 2011). Each sleep stage provides a distinct, significant physiological and neurological function for the health of the body and mind, making it crucial to progress through all sleep stages many times during a single night sleep.
Sleep duration (i.e. the number of sleeping hours per night) is also significant for a good night sleep and important for ensuring going through sleep stages in a repeated cycle. The needed number of sleeping hours per night to complete the typical sleep cycles of sleep stages varies by age group. For example, newborns should have between 16 to 18 hours a day,
preschool-aged children need between 11 to 12 hours, school-aged children should have at least 10 hours, teens need between 9 to 10 hours, and adults (including elderly) are recommended to get between 7 to 8 hours of sleep per day (Centers for Disease Control and Prevention [CDC],
2013; National Institute of Health [NIH], 2012a). Consequently, a good night’s sleep
encompasses both adequate number of sleeping hours and the quality of sleep, as assessed by moving through the stages of sleep. Both sleep duration and sleep quality are significant in describing poor or good (healthy) sleep (Robotham et al., 2011). Seep quality will be used in this document as an overall outcome of sleep behavior that involves both sleep duration and aspects of sleep quality; accordingly, poor sleep quality will be used to describe the concept of short sleep duration with poor aspects of sleep quality, while good, optimal and healthy sleep will be used to describe the concept of having the recommended sleeping hours with good sleep quality aspects.
Sleep is necessary to fight off infection, support the metabolism of sugar, perform well in school, and work effectively and safely (Healthy People, 2015; Robotham et al., 2011). Getting good (healthy) sleep and treating sleep disorders improves health, productivity, wellness, quality of life, and safety on roads and in the workplace (Healthy People, 2015). Conversely, poor sleep can cause sleep disorders such as sleep apnea, insomnia, narcolepsy, and restless legs syndrome (Ram, Seirawan, Kumar, & Clark, 2010; Wells & Vaughn, 2012). In addition, poor sleep has been associated with a host of negative behavioral and health outcomes including substance use (e.g., tobacco and alcohol usage), physical inactivity, violent behavior, mental disturbances, suicide attempts, overweight or obesity, heart disease, drowsy driving, and risk for accidents and injuries (Benca, 2012; Fredriksen, Rhodes, Reddy, & Way, 2004; McKnight-Eily et al., 2011; National Institute of Diabetes and Diagestive and Kidney Diseases [NIDDK], 2012). Poor sleep has also been associated with poor school performance and lower average school grades (Fredriksen et al., 2004; Ming et al., 2011). Collectively, poor sleep and sleep disorders
reduce quality of life and productivity, increase the use of health-care services, and can cause injuries, illness, or deaths (CDC, 2008).
Trends and prevalence of poor sleep
Approximately one-quarter of the U.S. population does not get enough sleep and roughly one in three adults gets less than seven hours of sleep per night (CDC, 2015; NIH, 2013). In addition, nearly 50 to 70 million Americans chronically suffer from sleep and wakefulness disorders (long-term effect of sleep deprivation and sleep disorders) (CDC, 2015; Ram et al., 2010; Wells & Vaughn, 2012). Among adolescents (ages 13-18 years), approximately 70% get less than 7 hours on average school nights (Chen, Wang, & Jeng, 2006; Eaton et al., 2010; Lauderdale et al., 2009; McKnight-Eily et al., 2011; Ming et al., 2011). Moreover, sleep
disorders during adolescence may predict ongoing sleep-related problems in adulthood; such as mood disorders, heart disease, and diabetes (Dregan & Armstrong, 2010; Fredriksen et al., 2004; Lund, Reider, Whiting, & Prichard, 2010; Ming et al., 2011).
Indeed, poor sleep is highly prevalent health issue among college students in the United States (Tsai & Li, 2004), with more than 60% considered poor sleepers (Lund et al., 2010). The most common and prevalent sleep disorders among college students include: sleep apnea,
insomnia, narcolepsy, and restless legs syndrome (Fredriksen et al., 2004; Ming et al., 2011; Ram et al., 2010; Wells & Vaughn, 2012). College students are particularly susceptible to poor sleep quality due to several factors such as maturational changes. In addition, poor sleep in this vulnerable population obstructs higher cognitive functions such as learning, problem solving, and creativity, which increases their risk for lower grade point averages, compromised learning, impaired mood, and motor vehicle accidents (Hershner & Chervin, 2014; Lund, et al., 2010). Furthermore, poor sleep among college students also appear to bring about other unhealthy
sleep deprivation. Moreover, poor sleep has been connected to weight gain, and college years appear to be an important period for increases in overweight status (Curcio, Ferrara, & De, 2006; Lund, et al., 2010 Vela-Bueno, Fernandez-Mendoza, & Olavarrieta- Bernardino, 2009).
Significance and Purpose
Sleep health is one of the newest objectives of Healthy People 2020. The goal for sleep health is to increase public knowledge of how adequate sleep and treatment of sleep disorders improve health, productivity, wellness, quality of life, and safety on roads and in the workplace (Healthy People, 2015). Four different objectives have been established for sleep health (Healthy People, 2015):
1. Increase the proportion of persons with symptoms of obstructive sleep apnea who seek medical evaluation.
2. Reduce the rate of vehicular crashes per 100 million miles traveled that are due to drowsy driving.
3. Increase the proportion of students in grades 9 through 12 who get sufficient sleep. 4. Increase the proportion of adults who get sufficient sleep.
This project intends to contribute in achieving the objective of increasing the proportion of adults (18+ years old) who get sufficient sleep (defined as 8 or more hours for those aged 18 to 21 years and 7 or more hours for those aged 22 years and older, on average, during a 24-hour period) (Healthy People, 2015). It is crucial to study and describe sleep quality among college students; since poor sleep among this vulnerable population increases their risk for several unhealthy behaviors (drugs/substances and medication use), and obstruct their academic achievements. Such research may help in attaining better understanding of students’ sleep
quality, in order to increase the proportion of students who get sufficient sleep, and to prevent sleep-related disorders and/or negative health-related outcomes.
This dissertation aims at examining students’ sleep quality in relation to the nonmedical use of prescription drugs (NMUPD) (Aim #1) and Body Mass Index (BMI) (Aim #2) among a large sample of college students. Aim # 3 attempts to describe sleep quality of West Virginia University (WVU) college students using the Health Belief Model (HBM) and behavioral intention form the Theory of Planned Behavior (TPB). The three aims utilized cross-sectional designs. Aim #1 and Aim #2 analyses was based on secondary data, using the fall 2010-spring 2011 American College Health Association - National College Health Assessment (ACHA-NCHA). Aim #3 was based on primary data collection obtained from a sample of undergraduate students attending WVU.
The Relationship between the Nonmedical Use of Prescription Drugs (NMUPD) and Sleep Quality among a National of College Students.
Introduction
Prescription medications designed to treat pain, anxiety, sleep disorders and other medical problems have proliferated in the U.S. However, their increased availability has also lead to increased nonmedical use (NMU). Nonmedical use of prescription drugs (NMUPD) refers to the use of medication for reasons, or in ways, or in amounts, not intended by a doctor; taken without a prescription; or taken by someone other than the person for whom they are prescribed (National Institute on Drug Abuse [NIDA], 2015; Substance Abuse and Mental Health Services Administration [SAMHSA], 2015).
There were 15 million indiviuals, aged 12 years or older, who engaged in NMUPD, and NMUPD is more common than use of any other drug, with the exception of marijuana (Hughes, Williams, Lipari, Bose, Copello, & Kroutil, 2016; SAMHSA,2015). Lifetime prevalence of NMUPD is 20% among college students for at least one prescription medication class (i.e. sedatives, opioids, or stimulants) (McCabe, West, Teter, & Boyd, 2014). In addition, college students also have the highest NMU of opioid painkillers (McCabe & Teter, 2007). NMU of antidepressants is unexplored in many large-scale epidemiological surveys. However, 8% of Americans 12 years or older used antidepressants between 2005 and 2008 for reasons other than depression (Pratt, Brody, & Gu, 2011). Such usage increased from 2.4% to 10.8% between 2007 and 2010 among adults (National Center for Health Statistics [NCHS], 2014).
The most commonly reported reasons for NMUPD among college students are to “stay awake to study” and/or to “increase concentration” (Clegg-Kraynok, McBean, & Montgomery-Downs, 2011; McCabe & Teter, 2007). However, the association between NMUPD and sleep
quality among college students has not been generally explored, with the exception of stimulant use. Clegg-Kraynok (2010) found that college students not only have poorer sleep quality and shorter sleep duration than adolescents but also are more likely to use psychostimulants nonmedically (defined as stimulants used for the treatment of Attention-Deficit/Hyperactivity Disorder [ADHD]) to compensate for shortened sleep; students with lifetime NMU of
psychostimulants report poorer sleep quality and more sleep disturbance than nonusers (Clegg-Kraynok, et al., 2011).
However, the association between sedative, painkiller, and antidepressant use and sleep quality has not been explored among college students, and only sparsely in the general
population. Sedatives are often referred to as sleep aids (Chong, Fryar, & Gu, 2013). Chong et al. (2013) reported that noninstitutionalized U.S. adults who obtain either fewer than five hours or more than nine hours of sleep, use sleep aids in higher proportions (6.0% and 5.3% respectively). Use of sleep aids is also high among adults who report sleep-related disorders and trouble
sleeping (Chong et al., 2013).
Painkillers can significantly disrupt sleep architecture in healthy adults ( Dimsdale, Norman, DeJardin, & Wallace, 2007). Dimsdale et al. (2007) found both sustained-release morphine sulfate and methadone use significantly reduced deep sleep and increased stage N2, resulting in overall sleep quality disturbance. Studies of adolescents’ use of pain relievers showed they have more trouble sleeping (in the past six months) than nonusers (McCabe, West, and Boyd, 2013). Poor sleep quality was also reported by 80.6% of prescription opioid users compared to healthy controls (Hartwell, Pfeifer, McCauley, Moran-Santa, & Back, 2014). The prescription opioid-dependent group also had shorter sleep duration, longer sleep latency, and more awakening times.
Antidepressants, on the other hand, change and improve sleep architecture, specifically
by decreasing the amount of REM sleep and increasing its onset latency in both healthy individuals and depressed patients (Lam, 2005; Wilson & Argyropoulos, 2005). These effects
vary by drugs, with some short-term sleep disturbance early in treatment (e.g.,
clomipramine and the selective serotonin receptor inhibitors [SSRIs]), while others are sleep-promoting (e.g., amitriptyline and the newer serotonin 5-HT2-receptor antagonists)
(Wilson & Argyropoulos, 2005).However, some antidepressants drugs may cause insomnia and daytime sleepiness (Lam, 2005; Mayers & Baldwin, 2005). In general, sleep improved with
effective antidepressant treatment within 3–4 weeks (Wilson & Argyropoulos, 2005). The current literature on NMUPD and sleep quality among both college students and in the general population are limited because: (1) many large-scale epidemiological surveys of prescription drug use have not included NMU of antidepressants; and (2) they have not explored important demographic and behavioral covariates, including sleep disorders and other gateway drugs (NMU of stimulants, in particular, is associated with increased use of other drugs including alcohol, cocaine, cigarettes, and marijuana) (Hershner & Chervin, 2014;McCabe & Teter, 2007).
Therefore, our study purpose was to use a large, national college student sample to examine the associations between four classes of NMUPD (antidepressant, painkillers,
stimulants, and sedatives) in the past 12 months and five aspects of sleep quality(Enough Sleep, Early Awakening, Daytime Sleepiness, Difficulty Falling Asleep, and Problem associated with Daytime Sleepiness) in the past seven days. Specifically, we sought to take into consideration known limitations, and to include important demographic and behavioral covariates that have not been controlled in previous studies. Given the relatively exploratory nature of the study, no specific hypotheses were developed. However, in line with the extant literature, we expect a
positive association between NMUPD and sleep quality as reflected by five aspects of sleep behavior. We examined potential associations that may exist with any NMUPD, as well as within each drug class individually.
Material and Methods
This study utilized data from the fall 2010 and spring 2011 National American College Health Association-National College Health Assessment (ACHA-NCHA). We were granted access to these data through a formal request to the American College Health Association. There were 42 and 129 institutions that participated in the fall 2010 (n=30,263) and spring 2011
(n=116,254) NCHA, respectively. However, we selected only those schools (39 and 129 during fall-2010 and spring-2011, respectively) that surveyed all available students or used a random sampling technique (N=135,874; ACHA, 2011). The overall response rates were 30.9% and 28.5% for fall 2010 and spring 2011, respectively. Missing values (missing at random), n=2,663 and 16,321 individuals, were excluded from descriptive analysis and from inferential analysis, respectively.
Instrumentation
NMUPD
The independent variables included four classes of nonmedical prescription drugs:
antidepressants, painkillers, sedatives, and stimulants. The four questions used to assess NMUPD were: “Within the last 12 months, have you taken any of the following prescription drugs that were not prescribed to you: (1) [Antidepressants (e.g., Celexa, Lexapro, Prozac, Wellbutrin, Zoloft)]; (2) [Pain killers (e.g., OxyContin, Vicodin, Codeine)]; (3) [Sedatives (e.g., Xanaz, Valium)]; (4) [Stimulants (e.g., Ritalin, Adderall)]?” Response options for each question were 1) yes or 2) no.
Sleep Quality
The dependent variables measured aspects of sleep quality.Specifically,we assessed sleep quality in the past seven days, as reflected by participants’ experiences with:Enough Sleep, Early Awakening, Daytime Sleepiness (frequency), Difficulty Falling Asleep, and Problem with Daytime Sleepiness (magnitude). Two aspects of Daytime Sleepiness have been assessed: the frequency of feeling sleepy during the day, and the magnitude of feeling sleepy (problem associated with sleepiness during the day). The following questions were chosen to match the study aim: 1) Enough Sleep = “On how many of the past 7 days did you get enough sleep so that you felt rested when you woke up in the morning?”; 2)Early Awakening =“In the past 7 days, how often have you awaken too early in the morning and couldn’t get back to sleep?”; 3) Daytime Sleepiness = “In the past 7 days, how often have you felt tired, dragged out, or sleepy during the day?”; 4) Difficulty Falling Asleep =“In the past 7 days, how often have you had an extremely hard time falling asleep?”; 5) Problem with Daytime Sleepiness = asked “In the past 7 days, how much of a problem have you had with sleepiness during your daytime activities?” Response options for the first four questions ranged from zero to seven days; response options for question five was: 1= no problem at all, 2= a little problem, 3= more than a little problem, 4= a big problem, and 5= a very big problem.
For analysis purposes, particularly descriptive and Chi-square tests, we grouped each sleep quality measure into three groups based on the literature (Becker, Adams, Orr, & Quilter, 2008): Enough Sleep (6-7 days = optimal, 2-5 days = middle, and 0-1= poor). Early Awakening, Daytime Sleepiness, and Difficulty Falling Asleep were coded as: (6-7 days = poor, 2-5 days = middle, and 0-1= optimal). Finally, Problem with Daytime Sleepiness was coded as: (optimal = having no problem with sleepiness, poor = combining having a little, more than a little, a big, and a very big problem with sleepiness during the daytime activities).
Covariates
Study covariates (Table 1) included gender, race, age, body mass index (BMI) (obtained from the reported height and weight), other substance use (i.e. cigarette, alcohol, and marijuana use in the past 30 days), diagnosed medical disorders (depression, insomnia, ADHD, sleep-related disorder), and overall perceived stress (participants were asked to rate their overall level of stress they have experienced in the past 12 months, on a five-point Likert scale ranges from no stress to tremendous stress). These covariates were included because of known associations with sleep quality, NMUPD, and to control for any interrelated effects between the proposed
covariates, NMUPD and poor sleep (Hershner & Chervin, 2014;McCabe & Teter, 2007; Tsai & Li, 2004).
Data Analysis
Descriptive statistics were followed by inferential ordinal regression models to examine the associations between any NMUPD (antidepressants, painkillers, sedatives, and stimulants) in the past 12 months, and sleep quality in the past seven days (Enough Sleep, Early Awakening, Daytime Sleepiness, Difficulty Falling Asleep, and Problem with Daytime Sleepiness) as ordinal variables; while controlling for the study covariates using SAS 9.4. We excluded gender from the covariates when modelling based on gender.
Results
Sample characteristics (N=135, 874)
Sample characteristics are displayed in Table 1 (Appendix A). The majority of participants were female (65.3%), and Non-Hispanic white (68.1%). Around 66% had used alcohol in the past 30 days, roughly 15% reported smoking cigarettes during last 30 days and around 15.4% using marijuana during the same period.
Sleep and NMUPD
Table 2 (Appendix A) presents participants’ experiences with the five different aspects of sleep quality in the past seven days; 22% of students reported not getting Enough Sleep (0-1 day/week); 24.3% reported having 2-5 days/week of Early Awakening and could not get back to sleep; 62.3% reported Daytime Sleepiness for 2-5 days/week; and 28.5% had Difficulty Falling Asleep during 2-5 days/week. In addition, the majority of students (90%) reported having Problems with Daytime Sleepiness in the past seven days.
Females (69.6%) reported more frequently than males (30.4%) did that they had 0-1 days of Enough Sleep; females also reported more days of Daytime Sleepiness (72.7%) than males (27.3%) for 6-7 days/week. In addition, having 6-7 days of Early Awakening and 6-7 days of having Difficulty Falling Asleep were higher among females (69.4% and 69%, respectively) than males (30.6% and 31%, respectively). Having Problem with Daytime Sleepiness was also higher among females (66.6%) than males (33.4%).
Fourteen percent of students reported NMUPD, in at least one class, in the past 12 months (Table 2). Among those who reported NMUPD, 7.5% reported use of painkillers, 7.4% use of stimulants, 4% use of sedatives, and 3% use of antidepressants, with females reporting higher usage than males in all classes.
Associations between NMUPD and sleep
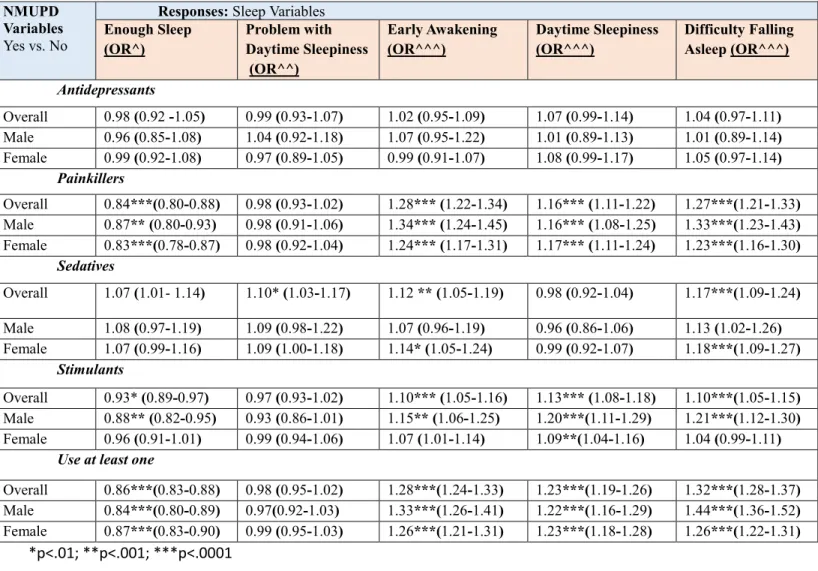
Results of the ordinal regression analysis (Odds Ratio, [95% Confident Interval]) are in Table 3 (Appendix A). Significant associations were found between NMUPD and sleep
behaviors after adjusting for covariates. Students who reported NMUPD in at least one class of prescription drugs in the past 12 months had significantly fewer days of getting Enough Sleep (0.86 [95% CI = 0.83-0.88]), more days of Early Awakening (1.28 [95% CI = 1.24-1.33]), Daytime Sleepiness (1.23 [1.19-1.26]), and more days of having Difficulty Falling Asleep (1.32
[1.28-1.37]). Among students who reported NMUPD, males reported significantly more days of Early Awakening (1.33 [1.26-1.41]) than females (1.26 [1.21-1.31]), and more days of having Difficulty Falling Asleep (1.44 [1.36-1.52]), than females (1.26 [1.22-1.31]).
In general, analyses did not differ when analyzing each drug class separately, even after controlling for covariates. Students who reported NMU of painkillers reported significantly fewer days of getting Enough Sleep (0.84 [0.80-0.88]), significantly more days of Early
Awakening (1.28 [1.22-1.34]), more days of Daytime Sleepiness (1.16 [1.11-1.22]), and having Difficulty Falling Asleep (1.27 [1.21-1.33]) (p<.0001). Among painkiller users, males reported significantly more days of Early Awakening (1.34 [1.24-1.45]) than females (1.24 [1.17-1.31]), and more days of having Difficulty Falling Asleep (OR=1.33[1.23-1.43]), than females
(OR=1.23[1.23-1.43]).
This pattern was consistent for the NMU of stimulant use with the exception that males had fewer days of getting Enough Sleep (0.88 [0.82-0.95]), having more days of Early
Awakening (1.15 [1.06-1.25]), and having Difficulty Falling Asleep (1.21 [1.12-1.30]). Finally, NMU of sedatives was significantly associated with Problem with Daytime Sleepiness (1.10 [1.03-1.17]), more days of Early Awakening (1.12 [1.05-1.19]), and having Difficulty Falling Asleep (1.17 [1.09-1.24]). Among sedatives users, only females reported significantly more days of Early Awakening and Difficulty Falling Asleep (1.14 [1.05-1.24], and 1.18 [1.09-1.27] respectively).
Discussion
To our knowledge, this is the first study that has examined association between NMUPD (antidepressant, painkillers, sedatives, and stimulants), and sleep quality using a large, national sample of college students. These results have revealed that poor sleep is highly prevalent among
college students across all five measured aspects of sleep quality. The majority of students (90%) reported Problems with Daytime Sleepiness, and about 62.3% reported Daytime Sleepiness for 2-5 days/week; this is consistent with prior research on poor quality sleep (Tsai & Li, 2005; Lund et al., 2010). Female students reported poorer sleep quality, and that they felt more tired, dragged out, or sleepy during the day (Daytime Sleepiness) than did males, suggesting females have poorer sleep quality than males (Tsai & Li, 2005).
While 14% of students reported NMUPD in the past 12 months, this is less than a previous report of 20% lifetime use (McCabe et al., 2014). McCabe et al. (2009) reported that 45% of college students had used painkillers, 46% had used sedatives, and 61% had used stimulants in their lifetime. Among adults, NMUPD has increased from 2.4% to 10.8% between 2007 and 2010 (NCHS, 2014). Nevertheless, the lower prevalence of NMUPD in this study is likely due to our assessment of NMUPD in the past 12 months as opposed to lifetime use. In addition, the survey had included the first part of the NMUPD definition (inappropriate use of a legitimate prescription), the numbers here may have been much higher if the other ways of NMUPD (e.g. use of medication for reasons, or in ways, or in amounts, not intended by a doctor) were included in the questions.
Consistent with our expectations, findings confirm a significant association between NMUPD (during the past 12 months) and poor sleep quality, even after controlling for key covariates (Babcock & Byrne, 2000; Chong et al., 2013; Clegg-Kraynok ,2010 & 2011;
Dimsadale et al., 2007; Hartwell et al., 2014; Hershner & Chervin, 2014; McCabe et al., 2013). However, no significant association was found between antidepressants use and poor sleep, possibly due to the fact that most antidepressant drugs have few short-term effects on sleep and with longer-term use eventually promote sleep (Wilson & Argyropoulos, 2005). The most
consistent short-term effect of antidepressants is on REM sleep (Lam, 2005; Wilson & Argyropoulos, 2005). However, some classes of antidepressants may cause insomnia, and daytime sleepiness in the early stage of treatment (Lam, 2005; Mayers & Baldwin, 2005). Therefore, the use of antidepressants (either medical use or NMU) during the past year may have beneficial effects on sleep among both depressed and non-depressed students (Wilson &
Argyropoulos, 2005). However, additional research on the association between antidepressants and sleep should assess potential risks and benefits of NMU.
In our study, any NMUPD was significantly associated with reduced days of Enough Sleep; increased days of Early Awakening, Daytime Sleepiness, and having Difficulty Falling Asleep. Hence, our findings suggest a pattern of poor sleep quality among students who engage in NMU of any prescription drug class.
Similar to NMUPD overall, NMU of stimulants significantly reduced days of Enough Sleep; increased days of Early Awakening, Daytime Sleepiness, and having Difficulty Falling Asleep; which concurs with prior studies of poorer sleep quality, shorter sleep duration, and sleep disturbances among users than nonusers (Clegg-Kraynok ,2010 & 2011). Thus, our results support research demonstrating that stimulants increase sleep latency, decrease sleep duration, and lead to increase sleep disturbance (Babcock & Byrne, 2000; Hershner & Chervin, 2014). Since stimulants increase dopamine levels in the brain, the result may be a sense of euphoria, improved mental alertness, focus and concentration, increased physical endurance, reduced appetite, extended wakefulness, increased energy levels, enhanced self-esteem, and elevated mood (Caplan, Epstein, Quinn, Stevens, & Stern, 2007; Khantzian, 1997; United States Drug Enforcement Administration [U.S. DEA], 2015). College students’ use stimulants to stay awake and study because stimulants delay sleep and increase alertness and wakefulness (Babcock &
Byrne, 2000; Clegg-Kraynok, 2010 & 2011; Hershner & Cherwin, 2014). However, regular use of stimulants may disrupt brain activity where an individual’s cycles between an improving and worsening mood thereby negatively impacting sleep patterns. Thus, our findings extend
knowledge on the impact of stimulants on sleep patterns and sleep quality among college students.
NMU of painkillers showed a similar pattern of associations with sleep quality and duration as did stimulants and overall NMUPD. NMU of painkillers has been found to be associated with less sleep duration, longer sleep latency, increase trouble sleeping and more awake time among adults (McCabe et al., 2013; Hartwell et al., 2014). Although opioids (e.g. hydrocodone, oxycodone, morphine, and codeine) are prescribed to relieve pain as they inhibit the transmission of pain signals (NIH, 2016b), misuse and abuse is common because they
produce euphoria in addition to pain relief (NIH, 2016; SAMHSA, 2016). Opioid painkillers also interrupt sleep by increasing wakefulness (which may lead to having difficulty falling asleep), increasing the number of shifts in sleep-waking states (increasing wake time), decreasing total sleep time (getting insufficient sleep), and affect sleep stages (reducing deep sleep and increasing light sleep) (Dimsdale, et al., 2007;Hartwell, et al., 2014).
The interrelated effects between chronic pain/severity, painkillers, and poor sleep quality in adults and among prescription opioid dependents are supported by previous studies (Dimsdale, et al. 2007; Hartwell, et al., 2014). Both pain severity and opioid use disrupt sleep (Hartwell, et al., 2014); however, opioid use disturbs sleep even in pain-free individuals (Dimsdale, et al. 2007). Although our cross-sectional research design precludes temporal conclusions regarding the role of opioid use in sleep disruption, our analyses did control for sleep-related disorders.
Findings highlight the importance of including painkiller use and pain assessments when assessing sleep quality among college students.
NMU of sedatives was significantly associated with Problem with Daytime Sleepiness; more days of Early Awakening early; and having Difficulty Falling Asleep. Although our study controlled for depression, a large body of literature suggests that individuals who engage in NMU of sedatives also suffer from depression (Conway et al., 2006; Brunette et al., 2003). Sedatives decrease central nervous system activity (Apantaku-Olajide, 2011) to produce a drowsy or calming effect. However, risk of addiction is high, especially when used with opioids and stimulants (SAMHSA, 2009) to compliment the psychoactive (euphoric) effects (Hernandez & Nelson, 2010).
Sedatives slow brain activity andcause a relaxing effect that is helpful for people with anxiety or sleep problems, but also cause sleepiness (NIDA, 2016). Therefore, dependence on and tolerance for NMU of sedatives for euphoric effects can lead to adverse health outcomes, including sleep disturbance (Chong et al., 2013). Interestingly, sedatives are often refereed to and used as sleep aids, and the rate of their use is high among those who suffer from short (<5 hours) and long (>9hours) sleep (Chong et al., 2013). This may be done to compensate for short sleep; conversely, long sleep is non-optimal and may result from high sedatives use. Regardless, although the current study cannot be used to deduce causation, the association between NMU of sedatives and sleep supports the potential for drug use leading to poor sleep quality.
Finally, we found significant gender differences in NMUPD and sleep. Associations were generally stronger among males for NMU of stimulants and among females for NMU of
sedatives. Possibly these variations can be explained by the following. Though, among the nonmedical users of stimulants there are more females 61% (5, 881) than males’ (39%, n= 3,
781), the physiological characteristics of females may play an important role in the effect of stimulants which may hinder the impact they may have on sleep. Among sedatives users there are more females (62%) than males (37%).In addition, females had poorer sleep quality as shown in our results and previous studies (Tsai & Li, 2004), and suffer from having more days of Early Awakened and Difficulty Falling Asleep than males which has been exacerbated by
sedative use.
Limitations
Results should be interpreted in the context of several study limitations. These data were cross-sectional and self-reported, and thus vulnerable to potential recall bias and socially
desirability for subjective measures. The analyses were limited to questions available from this national survey, specifically the participants’ sleep in the past seven days. Assessing sleep over just one week may not reflect typical sleep behavior. The ACHA did not include additional potential confounding variables such as caffeine use, which may also influence sleep patterns and behaviors (Hershner & Chervin, 2014). Finally, since colleges self-select to participate in the ACHA survey, results cannot necessarily be considered generalizable to the larger U.S. college population.
Conclusion
Despite these limitations, our study included several strengths. Among them, the finding that poor sleep was common in this sample of college students and that these results show significantly increased odds ratios for poor sleep with NMUPD. Our study extends the current literature by revealing associations between NMUPD and sleep in terms of several specific aspects of poor sleep quality, but also among several classes of prescription drugs based on gender. We submit that assessment of both sleep quality and NMUPD behavior among college
students should the other, potentially synergistic, risk factor in screening and treatment initiatives and research, toward better understanding and improving college students’ sleep health,
The Relationship between Sleep Quality and Body Mass Index (BMI) Measures among a National Sample of College Students
Introduction
BMI/Obesity
Body Mass Index (BMI) is a useful measure of overweight and obesity, and considered as an important and reliable indicator of obesity prevalence in large populations (Carpenter et al., 2013; NIH, 2012b). Among adults, BMI is used as a screening tool to identify possible weight problems (CDC, 2015a; NIH, 2012b). BMI is calculated from a person's weight and height. The standard weight status categories associated with BMI scores for adults are (CDC, 2015;
NIDDK, 2012): underweight (BMI = < 18.5), normal weight (BMI= 18.5-24.9), overweight (BMI= 25-29.9), and obese [three classes:1,2, and 3, (BMI of 30 or greater)]. Overweight and obesity refer to body weight that is greater than what is considered healthy for a certain height (NIH, 2012b). In the United States, the obesity epidemic is increasing among all age groups and remains a leading public health problem (Food Research & Action center, 2015). Among adults, more than two-thirds are considered to be overweight or obese; and more than one-third (or 78.6 million) are obese (CDC, 2015a; NIDDK, 2012; NIH, 2012b).
Overweight and obesity increase the risk for many chronic diseases and health problems including, but not limited to, coronary heart disease, hypertension, arthritis, diabetes, stroke, certain cancers, kidney diseases, sleep apnea and respiratory problems (CDC, 2015; U.S. National Library of Medicine, 2015). Several factors that contribute to weight gain and obesity include genetics, family, environment, culture, medicine, and sleep, particularly lack of sleep. Moreover, it has been found that lack of sleep may make it harder to lose weight (CDC, 2015; NIDDK, 2012).
Sleep and BMI/Obesity
Overweight and obesity are also related to sleep problems. Poor sleep in general is connected to overweight and obesity, as people who sleep less prefer foods that are higher in calories and carbohydrates, which can lead to overeating, weight gain, and obesity (NIDDK, 2012). In children and adolescents, poor sleep is consistently associated with higher BMI (Magee & Hale, 2012; Marshall, Glozier, & Grunstein, 2008; Mitchell, Rodriguez, Schmitz, & Audrain-McGovern, 2013; Patel & Hu, 2008; Storfer-Isser, Patel, Babineau, & Redline, 2012).
Furthermore, it has been found that each additional hour of sleep is associated with decreases in BMI at different BMI precentiles among children (from 10th to 90th) (Mitchell et al., 2013).
In the adult literature, the association between sleep quality (good or poor sleep) and overweight or obesity is still unclear. Numerous studies have shown a strong association between short sleep duration and elevated BMI and increased risk for obesity among adults (Anic, Titus-Ernstoff, Newcomb, Trentham-Dietz, & Egan, 2010; Bjorvatn et al., 2007; Cappuccio et al., 2008; Ford et al., 2014; Gangwisch, Malaspina, Boden-Albala, & Heymsfield, 2005; Lauderdale et al., 2009; Marshall et al., 2008; Moraes et al., 2013; Patel & Hu, 2008; Wheaton et al., 2011). However, Mezick, Wing, and McCaffery (2014) reported that shorter and less efficient sleep was associated with increased BMI among women only. On the contrary, Meyer, Wall, Larson, Laska, and Neumark-Sztainer (2012) found an existing association between sleep duration and BMI in men, but not women. Other cross-sectional studies either claim a relationship between long sleep duration and obesity, or no association between either short or long sleep duration and BMI (Magee & Hale, 2012; Marshall et al., 2008; Nagai, Tomata, Watanabe, Kakizaki, & Tsuji, 2013; Patel & Hu, 2008; Xiang et al., 2009).
obesity also exist. Identical to studies with adults, the majority correlate short sleep duration with increased BMI, and increased risk for obesity. For example, Quick et al. (2013) examined the association between weight-related behaviors (i.e., eating, exercise), sleep duration (short : < 7 hours, adequate: 7-8 hours, and long >8 hours), and BMI of college students (N=1252; 18-24 years) from nine U.S. Universities. The results showed that as sleep duration increased to
adequate number of sleep, BMI declined and physical activity increased. This result supports the link between short sleep duration and increased BMI. Likewise, Chang and Chen (2014) in their examination of the association between poor sleep quality, BMI, and health-related physical fitness among college freshmen, found that poor sleep is associated with higher BMI and low performance of physical fitness.
In addition, among a sample of 207 college students enrolled at a large southeastern university, Todigala, Holcomb, and Kanneganti (2008), found that 42.8% of morbidly obese students and 50.1% of obese students reported usual sleeping hours of five or less. Similarly, Quick et al. (2013) found that poor sleep and sleep disturbances were significantly and highly prevalent among overweight and obese students. Moreover, Chen et al. (2013) reported in a cross-sectional study that staying up at night (few hours of sleep) increases the risk of being overweight. Likewise, in a prospective study of chronotype (morning [early bed- and wake time preferences], neutral, or evening types [late bed- and wake time preferences]) as predictors of increased weight gain and body mass index (BMI) among 137 college freshmen; Culnan, Kloss, and Grandner (2013) concluded that evening types had a significantly greater BMI gain (p<0.05) when compared with morning/neutral types. However, Vargas, Flores, and Robles (2014),
included sleep disturbances in the examination of the association between sleep duration and BMI among a convenience sample of 515 college students. They concluded that only sleep
disturbance, and not duration, was associated with overweight status (odds ratio 1.66, 95% confidence interval [1.08, 2.57]).
Similar to adults, other studies have found no association between sleep behaviors and BMI, overweight and or obesity among college students (Kamath et al., 2014; Melton, Langdon, & McDaniel, 2013; Wuertz, Chia, & Lee, 2012). Wuertz et al. (2012) investigated the
relationship between BMI and sleep quality, and between physical activity and sleep quality among a convenience sample of 68 female students. Results indicated a significant association between poor sleep and low physical activity, but no association with BMI. In a cross-sectional analyses, no association was found between sleep duration and BMI (Kamath et al., 2014). In an investigation of students' sleep disturbances and key demographics (e.g., obesity classification, gender, race, year in college), sleep disturbance was not found to be a predictor of overweight or obesity (Melton et al., 2013).
Other studies have examined the relationship between sleep and eating behavior among college students. Quick et al. (2015) sugget that competent eaters (i.e., intra-individual approach to eating and food-related attitudes and behaviors) have better overall sleep quality and fewer sleep-related issues than less competent eaters. Accordingly, it has been concluded that poor sleep quality and low eating competence were associated with overweight/obesity. Among female college students, Makino, Hashizume, Yasushi, Tsuboi, and Dennerstein (2006) found that fewer sleeping hours is one of the most important factors associated with abnormal eating attitudes. In fact, poor sleepers suffer from high uncontrolled eating behaviors (Shoff et al., 2009). Uncontrolled eating behaviors can be explained by the fact that short sleep duration affects appetite regulatory hormones by decreasing leptin and elevating ghrelin, which lead to increased appetite (Taheri, Lin, Austin, Young, & Mignot, 2004). In addition, Spaeth, Dinges,
and Goel (2013) claimed that the weight gain due to sleep restriction (i.e., four hours in bed for a total of five consecutive nights) resulted from the consumption of extra calories particularly during late night hours. This is a metabolic explanation of the reported changes in BMI and risk for obesity due to short sleep duration. Essentially, sleep helps maintain a healthy balance of the hormones that induce hunger (ghrelin) or feelings of being full (leptin) (CDC, 2015).
Significance and Purpose
Among college students, the association between sleep quality (poor/good) and BMI, obesity or weight gain is still not sufficiently explored. The studies which have been conducted: 1) presented inconsistent findings, 2) have not controlled for important covariates, such exercise and diet restriction to lose weight, and 3) most studies have used convenience or selective samples. Therefore, additional investigation is warranted to examine the relationship between sleep behavior and BMI among college students with paying intention to important covariates. The main purpose of this study is to assess students’ sleep quality in relation to BMI using a large national sample, with a long term objective of clearly supporting the literature that affirms the association between sleep and BMI, particularly among college students. Consequently, study results may inform strategies and /or intervention programs to enhance students’ sleep habits and prevent weight gain and obesity among college students.
Research Question, Aim, and Hypothesis
Research questions This aim seeks to answer the following questions:
1. Primary Questions:
1.1 Are there differences in sleep quality among the different BMI groups in a large sample of college students in the United States?
sample of college students in the United States?
1.2.1Does having more days of sleep quality impact BMI amongst a large sample of college students in the United States?
2. Secondary Questions:
2.1. What is the prevalence of poor sleep amongst a large sample of college students in the United States?
2.2. What is the prevalence of overweight and obesity amongst a large sample of college students in the United States?
Aim(s) and hypotheses 1. Primary aims and hypotheses:
1.1. To assess the differences in sleep quality amongst the different BMI categories amongst a large sample of college students in the United States.
1.2. To assess the association between sleep quality and BMI amongst a large sample of college students in the United States
1.2.2 To determine whether having more days of sleep quality increase the chance of decreasing or increasing BMI amongst a large sample of college students in the United States?
Hypothesis:
1.1 We expect an existence of differences in sleep quality among the different BMI categories, as poor sleep is expected to be prevalent in the higher levels of BMI classes (overweight and obesity) than underweight and desired weight groups. The expected differences may confirm the existence of association between sleep behavior
particularly poor sleep and BMI, especially overweight and obesity classes amongst a large sample of college students in the United States.
1.2 We expect, based on the literature that increases in sleep quality may associated with decreases in BMI.
2. Secondary aims and hypotheses:
2.1. To assess the prevalence of poor sleep amongst a large sample of college students in the United States.
Hypothesis: poor sleep is expected to be prevalent amongst a large sample of college students in the United States.
2.2. To assess the prevalence of overweight and obesity amongst a large sample of college students in the United States.
Hypothesis: overweight and obesity is expected to be prevalent amongst a large sample of college students in the United States.
Method
Study design, Data source and Population
This study utilized the fall 2010-spring 2011 National American College Health
Association-National College Health Assessment data (ACHA-NCHA). We were granted access to these data through a formal request to the American College Health Association. ACHA-NCHA provides the largest, most comprehensive data on the health of US college students. The participating institutions in this study include 42 and 129 postsecondary institutions who self-selected to participate in the fall 2010 and spring 2011 ACHA National College Health Assessment, respectively, totaling 30,263 (fall, 2010) and 116,254 (spring 2011) surveys completed by students. However, only schools that surveyed all students or used a random sampling technique were included in the analysis of ACHA-NCHA. Therefore, the final data set
consisted of 30,093 (fall, 2010) and 105,781 (spring 2011) students for a total sample of 135,874 (ACHA, 2011). Nine health topics are covered in the survey including general health; diseases and injury prevention; academic impact; violence, abusive relationships and personal safety; alcohol, tobacco, and other drug use; sexual behavior; nutrition and exercise; mental health; and sleep (ACHA, 2011). Both surveys (Fall 2010 and Spring 2011) have 65 questions with sub questions that cover a variety of concepts related to the nine health topics. The overall response proportions were 30.9%, and 28.5 % for Fall 2010 and Spring 2011 respectively. Missing values (missing at random), n=2, 663 and 20, 419 individuals, were excluded from descriptive analysis and from inferential analysis, respectively.
Instrumentation
Sleep Quality
The study’s independent variables measured aspects of sleep quality in the past seven days and in the past 12 months. Specifically, (in the past seven days), we assessed sleep quality as reflected by participants’ experiences with: Enough Sleep, Early Awakening, Daytime Sleepiness (frequency), Difficulty Falling Asleep, and Problem with Daytime Sleepiness
(magnitude). Two aspects of Daytime Sleepiness were assessed: the frequency of feeling sleepy during the day, and the magnitude of feeling sleepy (problem associated with sleepiness during the day). In the past 12 months, we assessed sleep quality as reflected by participants’
experiences with Sleep Difficulties. The following questions were chosen to match the study aim: 1) Enough Sleep = “On how many of the past 7 days did you get enough sleep so that you felt rested when you woke up in the morning?”; 2) Early Awakening = “In the past 7 days, how often have you awaken too early in the morning and couldn’t get back to sleep?”; 3) Daytime Sleepiness = “In the past 7 days, how often have you felt tired, dragged out, or sleepy during the day?”; 4) Difficulty Falling Asleep = “In the past 7 days, how often have you had an extremely
hard time falling asleep?”; 5) Problem with Daytime Sleepiness = “In the past 7 days, how much of a problem have you had with sleepiness during your daytime activities?”; and 6) Sleep
Difficulties= “ Within the last 12 months, has any of the following been traumatic or very difficult for you to handle: Sleep Difficulties?” Response options for the first four questions ranged from zero to seven days; response options for question five was: 1= no problem at all, 2= a little problem, 3= more than a little problem, 4= a big problem, and 5= a very big problem; and question six has yes or no response options.
For analysis purposes, particularly descriptive and Chi-square tests, we grouped the first four questions of sleep quality measure into three groups based on the literature (Becker, Adams, Orr, & Quilter, 2008): Enough Sleep (6-7 days = optimal, 2-5 days = middle, and 0-1= poor). Early Awakening, Daytime Sleepiness, and Difficulty Falling Asleep were coded as: (6-7 days = poor, 2-5 days = middle, and 0-1= optimal). Problem with Daytime Sleepiness was coded as: (optimal = having no problem with sleepiness, poor = combining having a little, more than a little, a big, and a very big problem with sleepiness during the daytime activities).
Body Mass Index (BMI) (dependent variable)
BMI is the dependent variable that may be influenced by the independent sleep quality variables.BMI was calculated from the reported height and weight,and is a continuous variable. The calculation for computing BMI was weight (kg) / [height (m)]2. The continuous BMI
variable was recoded into the following categories identified by the World Health Organization: Underweight (BMI <18.5), Healthy/Desired Weight (18.5-24.9), Overweight (25-29.9), Class I Obesity (30-34.9), Class II Obesity (35-39.9), and Class III Obesity (BMI ≥40). Specifically, two questions weredesigned to obtain height and weight: 1) “Height in feet and inches?”,
participants were asked to indicate their height in feet and inches; 2) “What is your weight in pounds?”, participants were asked to indicate their weight in pounds.
Covariates
Study covariates (Tables 1b & 1c; Appendix B) include gender, race, age, exercise, diet and pills to lose weight, Nonmedical use of prescription drugs [NMUPD] in the past 12 months (Antidepressants, painkillers, sedatives and stimulants), other substance use (i.e. cigarette use, alcohol use, and marijuana use in the past 30 days), diagnosed medical disorders (depression, insomnia, Attention deficit Hyperactivity Disorder (ADHD), sleep-related disorder), and overall perceived stress. These covariates were included because of known associations with sleep quality, and to control for any interrelated effects between the proposed covariates, poor sleep and BMI (Hershner & Chervin, 2014; McCabe & Teter, 2007; Tsai & Li, 2004). The specific questions considered when adjusting for covariates with BMI follow:
Demographics: 1) “What is your gender? ” (Male or Female); 2) “How do you usually describe yourself?”, responses included: White-not Hispanic, Black-not Hispanic, Hispanic or Latino, Asian or Pacific Islander, American Indian or Alaskan, Biracial or Multiracial, and Others; and 3) “What is your age?”.
Drugs/substance use: 1) “Within the last thirty days, on how many days did you use: Cigarettes?”; 2) “Within the last thirty days, on how many days did you use: Alcohol (beer, wine, liquor)?” 3) “Within the last thirty days, on how many days did you use: marijuana?”. Responses were: Never used; have used, but not in last 30; 1 - 2 days; 3 - 5 days; 6 - 9 days; 10 - 19 days; 20 - 29 days; and/or used daily.
Prozac, Wellbutrin, Zoloft)]; 2) “Within the last 12 months, have you taken any of the following prescription drugs that were not prescribed to you [Pain killers (e.g., OxyContin, Vicodin,
Codeine)]; 3) “Within the last 12 months, have you taken any of the following prescription drugs that were not prescribed to you[Sedatives (e.g., Xanaz, Valium)]; 4) “Within the last 12 months, have you taken any of the following prescription drugs that were not prescribed to you
[Stimulants (e.g., Ritalin, Adderall)]?” Response options to each question were no or yes. A separate set of questions asked about the medical use of those drugs of which data was not used in the present analyses.
Diagnosed medical disorders and the overall stress level: 1) “Have you ever been diagnosed with Depression?”,responses for this question were no or yes; 2) “Within the last 12 months, have you been diagnosed or treated by a professional for any of the following: Insomnia?”;
3) “Within the last 12 months, have you been diagnosed or treated by a professional for any of the following: Attention Deficit and Hyperactivity Disorder (ADHD)?”; 4) “Within the last 12 months, have you been diagnosed or treated by a professional for any of the following: Other Sleep Disorder?”, responses were: no; yes, diagnosed not treated; yes, treated with medication; yes, treated with psychotherapy; yes, treated with meds+ psychotherapy; and/or yes, other treatment. And for the overall perceived stress level the question was: “Within the last 12 months, how would you rate the overall level of stress you have experienced?” the responses were: no stress, less than average stress, average stress, more than average stress, and/or tremendous stress.
Exercise: 1) “On how many of the past 7 days did you: Do moderate intensity cardio or aerobic exercises for at least 30 minutes?; 2) “On how many of the past 7 days did you: Do vigorous intensity cardio or aerobic exercises for at least 20 minutes?” 3) “On how many of the
past 7 days did you: Do 8-10 strength training exercises for 8-12 repetitions each?”; responses for those questions range from 0-7 days.
Exercise, diet and pills to lose weight: 1) “Within the last 30 days, did you do any of the following: Exercises to lose weight?”; 2) “Within the last 30 days, did you do any of the
following: Diet to lose weight?”; 3) “Within the last 30 days, did you do any of the following: Vomit or take laxatives to lose weight?”; 4) “Within the last 30 days, did you do any of the following: Take pills to lose weight?”; no or yes were the responses options.
Data Analysis
Descriptive statistics were followed by Chi-square, ordinal regression models, and linear regression models, to examine the associations between sleep quality (in the past seven days, and past 12 months (Enough Sleep, Early Awakening, Daytime Sleepiness, Difficulty Falling Asleep, Problem with Daytime Sleepiness, and Sleep Difficulty) as ordinal and binary variables and BMI (as categorical and continuous variables). Chi-square was used to compare BMI categories in term of sleep quality particularly poor sleep, followed by multivariate ordinal regression to test the association between sleep quality and the categorical BMI variables, and multivariate linear regression to test the association between sleep quality and the continuous BMI variable while controlling for the study covariates using SAS 9.4. We excluded gender from the study
covariates when modelling by gender. The effect size was measured by R value, which is the square root of R2; correlation was judged as (R=.1: small effect, R=.3: moderate effect, and R=.5: large effect).
Results
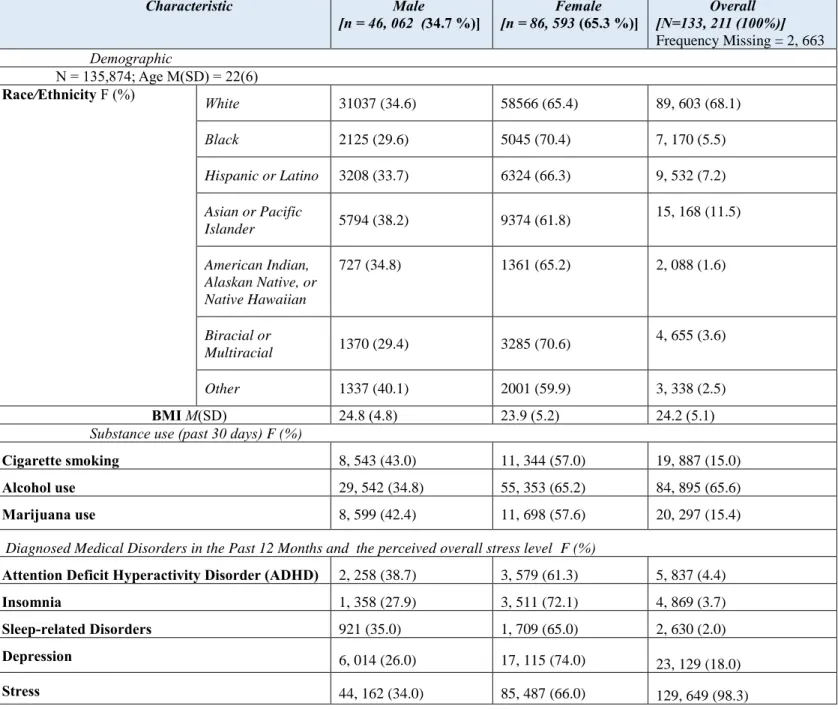
Sample characteristics
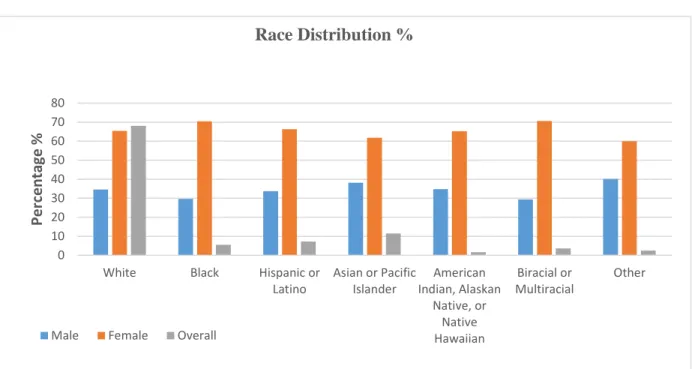
Table 1 and Figures 1 & 2 (Appendix B) present sample characteristics. Participants included 86,593 females (65.3%) and 46,062 males (34.7%) students (Mean age=22.0, SD=6.0). Students were primarily White (68.1%). However, the lowest presentation of ethnicity has been recorded for American Indian, Alaskan Native, or Native Hawaiian (1.6%) (Table 1a). The majority of students (65.6%) reported using alcohol in the past 30 days; whereas 15% and 15.4%, respectively, reported cigarette smoking and marijuana use in the past 30 days (Table 1b).
Table 1b, also illustrates the frequencies and percentages of NMUPD [four classes: Antidepressants, Painkillers, Stimulants, and Sedatives (in the past 12 months)], the diagnosed medical disorders (in the past 12 months), and the overall perceived stress level. Approximately 14% of students reported the nonmedical use of at least one class of prescription drugs. The highest usage rates have been reported for painkillers (7.5%; n=9,826), followed by 7.4%
(n=9,661) for stimulants. However, only 4% (n=5,338) reported sedatives use, and 3% (n=4,006) reported antidepressants use. Gender differences reveal that females have higher usage rates than males for all the classes; almost as twice as males. For example, 68.5% of antidepressants users were females, compared to 31.5% males (Figure 2b).
Most students (98.3%) reported stress level of average and above; and approximately 18% reported being diagnosed with depression (Table 1b). In addition, in the past 12 months, 4.4% of students reported being diagnosed and/or treated for ADHD, 3.7% for insomnia, and only 2% of students have been diagnosed and/or treated for sleep-related disorders (Table 1b). A
Females who have reported stress, depression and have been diagnosed and/or treated for
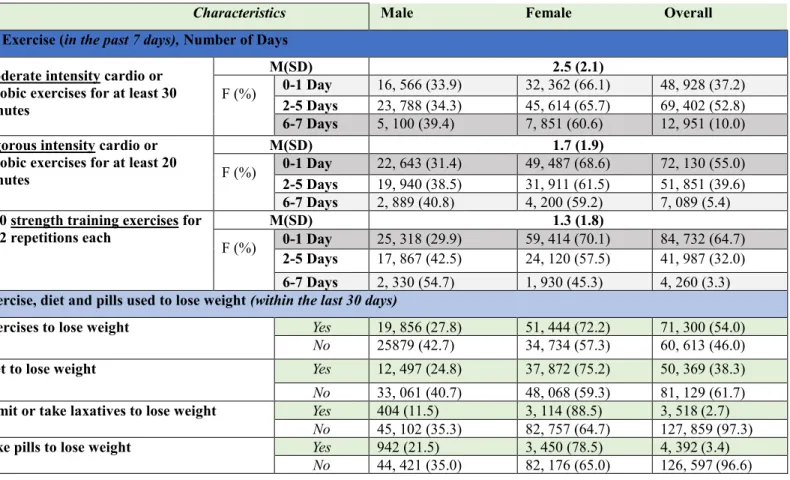
ADHD, insomnia and sleep-related disorders were higher than males, almost double (Figure 2c). Table 1c, shows three different levels of exercise behaviors (moderate intensity, vigorous intensity, and strength training exercises) practiced by students in the past 7 days; and four different ways used by students to lose weight in the past 30 days (exercises, diet, vomit or taking laxatives, and taking pills). Exercising for 2-5 days/week was reported by most students for the three different levels of exercises. Among students who did moderate intensity cardio or aerobic exercises for at least 30 minutes in the past 7 days, 52.8 % exercised for 2-5 days, while only 10% did for 6-7 days. Vigorous intensity cardio or aerobic exercises for at least 20 minutes in the past 7 days, have been reported by 39.6% students for 2-5 days, and only 5.4 % of students who exercised for 6-7 days. In addition, 32% of students practiced 8-10 strength training
exercises for 8-12 repetitions each for 2-5 days/week, and just 3.3% who did for 6-7 days/week. Females in general had more days of exercises of at various intensity than males, except of doing 8-10 strength training exercises for 8-12 repetitions each for 6-7 days, 54.7% were males
compared to 45.3% females (Figure 2d). The most common reported ways of losing weight were exercise and diet (54% and 38% respectively) (Table 1c). However, using pills, vomiting or taking laxatives to lose weight were also reported by 3.4% and 2% (respectively) of students. Females were more likely than males in using these weight lose strategies (Figure 2e).
Sleep Quality and the Body Mass Index (BMI) description
Table 2 and Figure 3 present participants’ experiences of six different aspects of sleep quality (in the past 7 days and past 12 months), and the overall BMI and BMI classifications distribution among students. In the past 7 days, about 22% of students reported not getting Enough Sleep (0-1 day/week); 24.3% reported having 2-5 days/week of Early Awaken; 62.3%


![Table 3a: Frequencies and percentages [F (%)] of different sleep behaviors among the different classes of BMI (Chi-square <.0001)](https://thumb-us.123doks.com/thumbv2/123dok_us/10310554.2939871/116.1188.56.1153.240.814/table-frequencies-percentages-different-behaviors-different-classes-square.webp)
![Table 3b: Frequencies and percentages [F (%)] of sleep difficulties (in the last 12 months) among the different classes of BMI (Chi-square](https://thumb-us.123doks.com/thumbv2/123dok_us/10310554.2939871/117.1188.56.1159.107.503/table-frequencies-percentages-difficulties-months-different-classes-square.webp)