A Machine Learning Framework for
Automatic Human Activity
Classification from Wearable Sensors
Edmond J. Mitchell, B.Eng.
School of Electronic Engineering
Dublin City University
Doctor of Philosophy(Ph.D)
Supervisor
Prof. Noel. E. O’Connor
Declaration
I hereby certify that this material, which I now submit for assessment on the programme of study leading to the award of PhD is entirely my own work, that I have exercised reasonable care to ensure that the work is original, and does not to the best of my knowledge breach any law of copyright, and has not been taken from the work of others save and to the extent that such work has been cited and acknowledged within the text of my work.
Signed:
Edmond Mitchell
ID No.: 59108002
Contents
Declaration ii List of Figures xi Abstract xii Acknowledgements xiii Publications xiv 1 Introduction 1 1.1 Research Objectives . . . 4 1.2 Research Contributions . . . 5 1.3 Thesis Outline . . . 7 2 Technical Background 10 2.1 Introduction . . . 102.2 Digital Signal Filtering . . . 10
2.2.1 Filtering . . . 10
2.2.2 Butterworth Filter . . . 12
2.3 Signal Feature Extraction . . . 13
2.3.1 Fourier transform . . . 13
2.3.2 The Wavelet Transform . . . 14
2.3.3 The Discrete Wavelet Transform . . . 15
2.3.5 Applications . . . 19 Industrial . . . 19 Healthcare . . . 20 2.4 Sensing . . . 22 2.4.1 Accelerometers . . . 23 2.4.2 Electrocardiography . . . 25 2.4.3 Applications . . . 26
Healthcare and Assisted Living . . . 27
Sporting & Leisure Applications . . . 29
Industrial Applications . . . 31
Entertainment and Games . . . 32
Other Application Areas . . . 33
2.5 Sensor Fusion . . . 34
2.6 Machine Learning . . . 36
2.6.1 Bayes Theorem . . . 36
2.6.2 Regression & Classification . . . 37
2.6.3 Generative & Discriminative Models . . . 37
2.6.4 Supervised & Unsupervised learning . . . 39
2.6.5 Concepts, Attributes and Instances . . . 40
2.6.6 Classifiers . . . 40
Support Vector Machine (SVM) . . . 41
K Nearest Neighbour (K-NN) . . . 41
Classification tree . . . 43
Artificial Neural Network . . . 43
Classification Evaluation . . . 44
2.7 Heuristic Approach to Optimisation . . . 45
2.7.1 Genetic Algorithm . . . 45
2.7.2 Applications . . . 48
2.8 Conclusion . . . 49
3 Unimodal Human Action Recognition 50 3.1 Introduction . . . 50
3.1.1 Discussion . . . 54
3.2 Evaluating a Subjects Performance . . . 55
3.2.1 Introduction . . . 55
3.2.2 Motivation . . . 55
3.2.3 Feature Extraction System . . . 57
3.2.4 Filtering . . . 58
3.2.5 Grade Classification . . . 61
3.2.6 Conclusion . . . 64
3.3 Recognising Specific Activities . . . 66
3.3.1 Data Capturing System . . . 66
3.3.2 Targeted Activities and Experimental Methodology . . . 68
Normalisation . . . 72
3.3.3 Approach and Results . . . 73
Experiment 1 . . . 74
Experiment 2 . . . 76
Experiment 3 . . . 81
Experiment 4 . . . 82
3.3.4 Conclusion . . . 84
4 MultiModal Human Action Recognition 89 4.1 Introduction . . . 89
4.2 Related Work . . . 89
4.3 Experiments with a single type of sensor . . . 91
4.3.1 Target & Application . . . 92
4.3.2 Data Collection . . . 93
4.3.3 Methodology and Results . . . 94
4.3.4 Conclusion . . . 97
4.4 Experiment with multiple types of sensors . . . 98
4.4.1 Early Fusion . . . 99
4.4.2 Late Fusion . . . 99
4.4.3 Target Application & Motivation . . . 102
4.4.4 Data Collection . . . 103
4.4.5 Methodology and Results . . . 106
Early Fusion Experiment . . . 109
Late Fusion Experiment . . . 112
4.4.6 Conclusion . . . 113
5 Parameter Selection Optimisation using a Genetic Algorithm115 5.1 Introduction . . . 115 5.2 Related Work . . . 118 5.3 Experiments . . . 119 5.3.1 Benchmarking . . . 121 5.3.2 Experiment 1 . . . 122 Aim . . . 122 Methodology . . . 122 Results . . . 123 5.3.3 Experiment 2 . . . 127 Aim . . . 127
Methodology and Results . . . 127
5.3.4 Experiment 3 . . . 129
Aim . . . 129
Methodology and Results . . . 129
5.4 Conclusion . . . 130
6 Conclusion 132 6.1 Thesis outline . . . 132
6.2 Suggestions for Future Work . . . 135
A Sample Signals from Section 3.3.2 136
List of Figures
1 DWT decomposition of signalx[n] . . . 16 2 System overview of the DWT decomposition and classification
process [1] . . . 20 3 A single axis accelerometer, containing a mass suspended by a
spring. The distance dof the mass with respect to the sensor housing is calculated and is a function of acceleration and the direction of gravity with respect to the direction of distance measurement. The unit vector n represents the sensitive axis of the sensor. [2] . . . 24 4 A single axis accelerometer showing how energy generated by
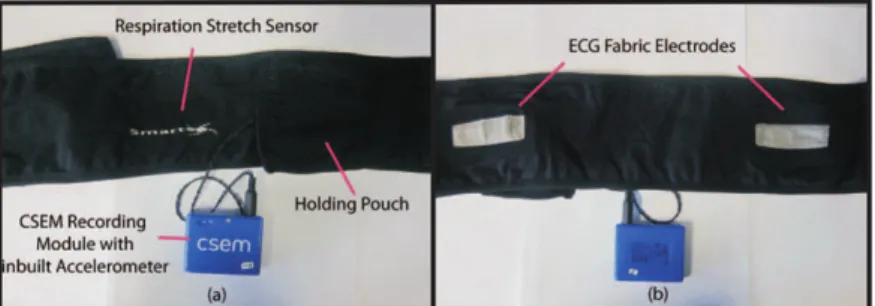
a force charges an electrical circuit which can be measured [3] 24 5 Smartex Wearable Wellness System. (a) Respiration sensor
positioned at the front centre of the band. Accelerometer lo-cated in the CSEM recording module which is housed in the indicated pouch. (b) Fabric ECG electrodes located on the inside of the chest strap. . . 26 6 A on-body wireless sensor system for measuring activities
dur-ing snowboarddur-ing in real-time . . . 30 7 XBee accelerometer sensor box for integrating dance motion
with interactive visualizations (with a quarter shown for size comparison)[4]. . . 32 8 Wireless Breathing Monitoring T-Shirt . . . 58
9 Unfiltered Breathing Signal . . . 59
10 Filtered Breathing Signal . . . 59
11 Reference Signal Recording with Real-time graphing. . . 60
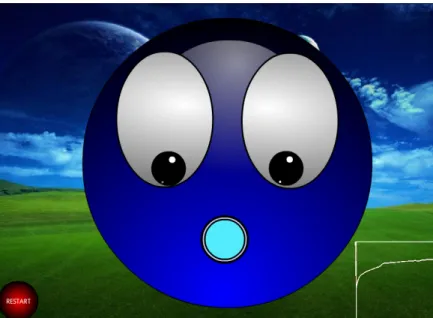
12 Graphical User interface - User attempting to emulate reference signal . . . 61
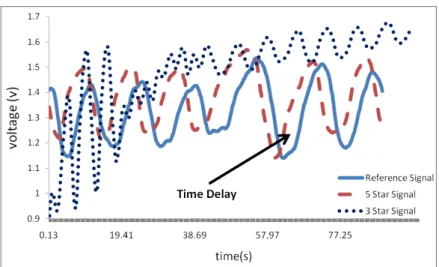
13 Comparisons of two signal classifications . . . 62
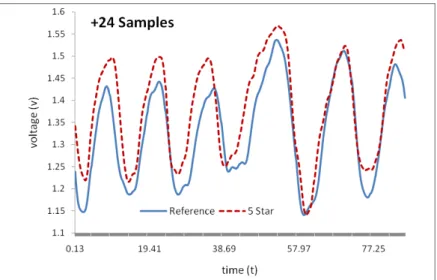
14 Plot of Reference and 5 Star Signal once time delay has been removed using correlation coefficient . . . 63
15 State Machine Diagram of Breathing Feedback System . . . . 65
16 Location of Smartphone. . . 68
17 HTC Desire Smartphone with ae2 coin for scale . . . 70
18 Average classifier family accuracy for experiment 2 . . . 77
19 Effect of DWT Levels on classification accuracy . . . 78
20 Effect of window length on average accuracy . . . 79
21 Effect of choice of wavelet . . . 80
22 Average model accuracy for each experiment . . . 81
23 Single activity accuracy results for each approach . . . 82
24 Placement of two inertial sensor units on the thigh and shank as well as their local coordinate system in a global coordinate system is illustrated. . . 93
25 F1 score comparison between one sensor and two sensors . . . . 98
26 Early Fusion scheme. Features are fused before a concept is learned . . . 100
27 Late Fusion scheme. Features from three individual sensors are used to learn four individual concepts. Confidence scores
determine the outputted class . . . 101
28 Smartex Wearable Wellness System. (a) Respiration sensor positioned at the front centre of the band. Accelerometer lo-cated in the CSEM recording module which is housed in the indicated pouch. (b) Fabric ECG electrodes located on the inside of the chest strap. . . 104
29 Simple example of a decision tree with three input features X, Y and Z. . . 108
30 Impact of changing the input signals on the determined F1 score using an early fusion approach. . . 111
31 Impact on the determined F1 score of changing the input sig-nals using a late fusion approach. . . 113
32 Genetic algorithm process . . . 117
33 Comparison of GAs with different population sizes . . . 124
34 Average amount of solutions required before optimum solution found . . . 125
35 Performance comparison of population sizes 50 and 60 . . . 126
36 Experiment 2 - Football Dataset Results . . . 128
37 Experiment 2 - Hockey Dataset Results . . . 129
38 Player Stationary . . . 136
40 Player Jogging . . . 137
41 Player Sprinting . . . 137
42 Player Hitting the Ball . . . 138
43 Player Tackling . . . 138
44 Player Soloing with the Ball . . . 139
45 User Jumping on a Box . . . 139
46 User Sprinting . . . 140
47 User Hitting the Ball . . . 140
48 User Walking . . . 141
Abstract
A Machine Learning Framework for Automatic Human
Activity Classification from Wearable Sensors
Edmond Mitchell
Wearable sensors are becoming increasingly common and they permit the capture of physiological data during exercise, recuperation and ev-eryday activities. This work investigated and advanced the current state-of-the-art in machine learning technology for the automatic clas-sification of captured physiological data from wearable sensors. The overall goal of the work presented here is to research and investigate every aspect of the technology and methods involved in this field and to create a framework of technology that can be utilised on low-cost platforms across a wide range of activities. Both rudimentary and ad-vanced techniques were compared, including those that allowed for both real-time processing on an android platform and highly accurate post-processing on a desktop computer. State-of-the-art feature extraction methods such as Fourier and Wavelet analysis were also researched to ascertain how well they could extract discriminative physiological infor-mation. Various classifiers were investigated in terms of their ability to work with different feature extraction methods. Consequently, complex classification fusion models were created to increase the overall accu-racy of the activity recognition process. Genetic algorithms were also employed to optimise classifier parameter selection in the multidimen-sional search space. Large annotated sporting activity datasets were created for a range of sports that allowed different classification models to be compared. This allowed for a machine learning framework to be constructed that could potentially create accurate models when applied to any unknown dataset. This framework was also successfully applied to medical and everyday-activity datasets confirming that the approach could be deployed in different application settings.
Acknowledgements
I would like to take this time to thank Prof. Noel E. O’Connor for providing me with opportunity to conduct research in a field that I have always been interested in. I would also like to thank him and Dr. David Monaghan for their constant guidance and advice over the past couple of years. None of this work would of occurred without the funding provided by Clarity and Science Foundation Ireland so I am immensely grateful towards those bodies. I would also like to thank all my colleagues who I have collaborated with and thank everyone else whom I have interacted with in DCU who made me feel welcome here. Most importantly I wish to thank my parents for their constant support and encouragement I have received throughout my whole life.
Publications
List of Publications Journal
E Mitchell, D Monaghan and N.E. O’Connor. Classification of Sporting Activities Using Smartphone Accelerometers. Sensors. 2013; 13(4):5317-5337.
A Ahmadi, E Mitchell, C Richter, F Destelle, M Gowing , N.E. O’Connor and K Moran. Towards Automatic Activity Classifica-tion and Movement Assessment During a Sports Training Session. IEEE Internet of Things Journal.
Peer reviewed international conference/workshop
A Ahmadi, E Mitchell, C Richter, F Destelle, M Gowing , N.E. O’Connor and K Moran. Automatic activity classification and movement assessment during a sports training session using wear-able inertial sensors. In Body Sensor Networks, 16-19 June 2014, Zurich, Switzerland.
K Sweeney, E Mitchell, J Gaughran, T Kane, S Coyle and N.E. O’Connor and D Diamond. (2013) Identification of sleep apnea events using discrete wavelet transform of respiration, ECG and accelerometer signals. In: Body Sensor Networks 2013, 5-10 May, Boston, MA.
E Mitchell, S Coyle, NE O’Connor, D Diamond, T Ward. Breath-ing feedback system with wearable textile sensors. Body Sensor Networks (BSN), 2010 International Conference on. ISBN: 978-1-4244-5817-2
E Mitchell, S Coyle, A Doherty, A Smeaton, N.E. O’Connor and D Diamond (2010) Smart tablecloths - ambient feedback of domestic electricity consumption. In: iHCI 2010 - 4th Irish Human Com-puter Interaction Conference, 2-3 September 2010, Dublin, Ireland. ISBN 1872327885
S Coyle, E Mitchell, T Ward, G May, N.E. O’Connor and D Diamond (2010) Textile sensors for personalized feedback. In: IAPMA2010 - ECIR2010 workshop on information access for per-sonal media archives, 28 March 2010, Milton Keynes, UK.
S Coyle, E Mitchell, T Ward, G May, N.E. O’Connor and D Di-amond (2009) Wearable sensors and feedback system to improve breathing technique. In: UNCSR 1st Annual Symposium, 22 Oc-tober, Dublin, Ireland.
1
Introduction
Up until the beginning of the millennium computers had been predom-inantly associated with the traditional desktop personal computer with the mouse and keyboard being the main methods of input. Today com-puters are becoming more pervasive and are embedded within our smart-phones, personal music players, auto-mobiles, clothing, watches and even glasses. In fact it is difficult to imagine an object that will not contain a computer at some stage in the future. The vision of ubiquitous com-puting is that, eventually, computers will disappear and become part of our environment, fading into the background of our everyday lives [5]. Therefore the ultimate goal in ubiquitous computing is that these un-seen computers will autonomously gather contextual information from users and their bodies to enhance their everyday life. With computers today being embedded in smaller and smaller devices and being made available in more and more aspects of daily living, the goal is to find novel methods for humans to interact with this new era of computing technology
One avenue of research in this regard would be to curtail the amount of explicit interaction that users are forced to endure in order to commu-nicate with computers. Implicit interaction implies that instead of the user having to directly communicate with the computer, the computer itself can determine the users requirements. In order for a computer to calculate the users requirements, it first must be able to sense the raw contextual information it can use to infer judgement within a particular situation. Sensors allow computers to detect and record changes in the users environment or physiology. These sensors are able to capture the current state of the user, their environment and their context, i.e their
name, their location relative to the sensor, their current activity and the current state of their environment.
Current research in computers that are contextually aware focuses on the use of sensors either on the user or in their environment to capture data that can be used to infer the users context. This contextual infor-mation can be used by a computer to automatically detect the current requirements of the user, thus eliminating the requirement of the user to interact with the device. This, not only, increases productivity and efficiency but also allows users to react to different scenarios naturally without having to input information directly into a device.
As technology advances and more efficient manufacturing techniques are discovered the cost to invent and construct sensors is lowered. In turn, the quantity of data available from different sensor modalities in-creases. With this increase the potential to fuse data from different modalities allows researchers to infer new contextual information that could not be discovered from a single modality.
In this work a new class of context aware computing is explored. Au-tomatic activity recognition aims to recognise the actions and events of a user utilising either physiological data captured from the body or data captured from the users environment. This research area has reached prominence in machine learning communities due to its ability to provide unobtrusive information to the user in areas such as medicine, human computer interaction and sport. The main research contribution out-lined in this thesis focuses on using physiological data captured from sensors worn on the body to recognise a wide range of human activities. Firstly, the capability of a system to recognise a single activity is introduced, which would allow the system to evaluate a users perfor-mance. This type of technology has many applications in health and in
sport where patients need to perform rehabilitation exercises and ath-letes want to hone their techniques and skills. Secondly, a single sensor system is employed to automatically recognise a range of complex ac-tivities. This technology again has various applications in health and sport. Thirdly, multiple sensors are combined in order to provide higher levels of accuracy in specific applications that involve more complex ac-tivities, making them very difficult to distinguish using a single sensor. Then sensors of different modalities are fused together so that any weak-ness in contextually recognizing human actions or activity in one sensor can be remedied from data from another sensor of a different modality. Finally a search-space parameter optimisation algorithm is introduced that allows the whole classification process to be sped up as well as increasing the overall classification accuracy.
Wearable sensors are used along with advanced feature extraction techniques and machine learning methods to capture, train and test classification models in order to automatically recognize the user’s ac-tivity. One of the main advantages of using wearable sensors, as oppose to sensors built into the infrastructure of a stadium is the ability to ob-serve the world from a 1st person perspective, continuously, and lacking
the requirement of any outside infrastructure. In this thesis activity recognition with wearable sensors will be shown to have the capacity to create new applications and to enhance current ones used in the areas of sport and health.
The main goal of this work is to create a machine learning framework for automatic human activity classification. This framework will allow the creation of accurate classification models for any annotated dataset. These models will be created from a variety of advanced feature selection parameters as well as a multitude of classifiers. This framework will
also contain state of the art optimisation procedures to ensure efficient parameter selection.
1.1 Research Objectives
There are several research objectives associated with creating a machine learning framework for automatic human activity classification. The initial objective is to outline the classification process from the sens-ing of physiological information to the output of a recognised activity. To simplify this, the first step is to examine whether it is possible to identify a single desired activity. The capability to evaluate a desired activity accurately permits the creation of a wide range of rehabilitation applications for people and also the creation of training applications for athletes. The chapter also presents the research contributes of this work and cites examples where the framework was applied successfully.
The next research objective is to investigate novel approaches to automatically identify various different activities with a single wearable sensor. This would allow users to have a permanent record of activities accomplished at a specific time or time intervals. To accomplish this objective, novel data mining and machine learning techniques will have to be inspected to ascertain their ability to perform this task. The category of sensor and the location where it will be placed on the user is paramount to the success of this goal. This is a challenging task as a single sensor can only capture physiological from a signal modality. Every classification model requires features from the raw data to be inputted into it in order to yield accurate results. Therefore extracting the most discriminative features from the raw sensor data is an extremely important objective for this work.
sensor of the same type to different locations on a user can yield greater classification accuracy results than a single sensor approach. With mul-tiple sensors, the issue of fusion arises, of which there are two different approaches when fusing sensor data together for classification purposes, therefore both early fusion and late fusion need to be investigated.
One more research objective is to ascertain the plausibility of combin-ing one or more sensors of a different modality and investigatcombin-ing whether any weakness in recognizing a human action or activity by one sensor can be remedied from data from another sensor.
A machine learning framework for automatic human activity clas-sification will have many parameters that need to be selected before a model can be generated. Researchers must generally limit the parame-ters investigated otherwise the process will take an unreasonable amount of time. This limitation in parameters can lead to the situation where potential models that provide higher accuracy are not investigated and therefore this is highly undesirable. Parameter selection optimisation procedures will examined to see whether they can negate this outcome.
1.2 Research Contributions
A wearable sensor network is a network of intelligent physiological sen-sors can be integrated into a wearable computing network. Wearable sensor networks have an important role to play in future healthcare de-livery and management by sensing the body and interpreting physiolog-ical data. To this end an interactive system was developed that helped patients perform respiratory exercises, and maintained the interest of children during these exercise sessions. This wearable system classifies breathing technique into separate grades and provides visual feedback to the user through a graphical user interface. The exercise sessions can
be repeated using the same reference signal, which means that medical staff need not be present for the exercise, thereby improving efficiency in the hospital.
Utilizing the accelerometer in the commonly available smartphone to recognise human activities has added various novel contributions to this thesis. The accelerometers in smartphones are less accurate than more expensive professional units, which adds to the difficulties in processing this data. Smartphones have been used to identify common day to day activities in the literature however to the best of our knowledge it is the first time they have been used accurately in a sporting context. This technology is easily available to athletes and allows them to track their sporting performance over the course of a training season. Using a smartphone placed on athletes back, this thesis introduces a set of algorithms to detect key movement and sporting activities including walking, standing still, jogging, sprinting, tackling, hitting a ball and soloing with a ball. These algorithms were shown to create accurate models for two different field sports.
An analysis into the use of cheap and easy to use respiration, ECG and accelerometer sensors for the classification of sleep apnea events was concluded. Standard polysomnography tests can be prohibitively expensive therefore the ability to pre-test for sleep apnea using a cheap and accurate system could allow the tests to be preliminarily carried out outside of the clinic environment. Therefore a cheap reusable wearable system consisting solely of a t-shirt was created that allowed different apnea events to be recognised. Additionally a comparison of early and late fusion approaches for multimodal sensor fusion was carried out. It was concluded that the early fusion approach outperformed the late fusion approach. There are very few instances of this test in literature
so it is beneficial to have conducted it.
Finally having a large set of possible parameters for any problem presents a significant time investment problem. The more permutations that must be investigated increases the length of time to conduct any experiment. To overcome this problem, a final contribution is presented, in which a novel classification parameter selection procedure is presented which allows users to search through a list of permutations for the most accurate solution with a significant increase in speed. This genetic al-gorithm approach was shown to decrease the time to locate the best classification parameters with an 87.5% decrease in time required on av-erage. Additionally the novel approach presented shows how the GA can permit a much larger parameter search space to be investigated which was shown to identify model parameters with higher accuracy than the model found within a smaller space. This in turn allows more accurate models to be created than a standard brute force approach.
1.3 Thesis Outline
Chapter 2 explores the technical background of preprocessing the raw sensor data before looking at the literature for advanced feature ex-traction. Then physiological sensors and their relevant applications are described in detail for classification purposes followed by a look at the different data fusion techniques which are investigated on their appli-cability for multimodal sensor fusion. After this chapter there is an exploration at the state of the art machine learning techniques, which are used for to create classification models in this work. Finally state of the art parameter selection optimisation techniques are introduced, which were to hasten the classification model creation process. Rele-vant literature is presented as a basis for the framework design choices
presented in this thesis.
Chapter 3 describes the challenges which were overcome in order to perform human activity recognition using a single sensor. This chapter outlines the feature extraction techniques required to initially evaluate a users activity performance before creating algorithms to identify various different sporting activities. A number of experiments are undertaken in order to ascertain the best approach to creating a classification model. A black box experiment is compared to a thorough investigation of all pa-rameters. These two approaches are then compared to a final approach where each activity has its own specialised classifier. All methods pro-posed are compared to a literature benchmark for evaluation purposes. Different feature extraction techniques such as DWT, FFT and some simple time domain techniques were implemented for comparison pur-poses.
Chapter 4 explores the challenges encountered when creating a mul-timodal human action recognition system. Advantages from using two accelerometers versus a single accelerometer to identify different training activities performed by a subject are presented. As the results prove, sensor fusion can significantly improve the accuracy rate for classification models. Early fusion and late fusion are the two techniques used in this chapter to fuse data from different sensors. Experiments are conducted that use both early and late fusion to fuse the data from ECG,respiration and accelerometer sensors. Results prove that even though early fusion requires less computational time, it is similarly accurate at detecting human activities as a late fusion approach. After evaluating those two approaches, results obtained when using different permutations of three sensors of different modality are presented in this chapter. Results in-dicate that adding a sensor which captures physiological data that is
already being accurately measured by a different modality can decrease classification accuracy.
Chapter 5 takes the results of all the model parameter permutations discovered in section 3.3 and uses them to test different genetic algo-rithms. This chapter explains why genetic algorithms can help optimise the parameter selection process. It also goes into detail on the role of each parameter that makes up the genetic algorithm and process behind it. Three experiments are conducted to investigate the genetic algo-rithms suitability to optimise the process of parameter selection. The first experiment explores the use of different population sizes and com-pares each GA to the brute force approach. Experiments were conducted 100 times each to give a fair representation of each populations ability. The second experiment increases the number of parameter permutations by a factor of ten but the number of possible solutions investigated was limited at the same amount as in section 3.3. This showed that the ge-netic algorithm could locate a new superior solution in the same amount of time it took the brute force algorithm to search through a search space one tenth of the size. The final experiment investigated whether this new superior models could of been extrapolated from original best performing models in section 3.3.
Chapter 6 succinctly presents the overall conclusions and briefly ex-plores the research contributions and discusses directions for future work.
2
Technical Background
2.1 Introduction
This chapter presents an overview of the background literature required to understand the techniques employed in the core work of this thesis. Initially signal processing techniques that enhance the ability to dis-criminate between different signal types are presented. Then discrete wavelet transforms and fast Fourier transforms are introduced as they are required for signal feature extraction for automatic human activity classification. The current state of the art in inertial sensing is inves-tigated which allows the fusing of sensor data from separate and dif-ferent sensors. Automatic activity classification using signal processing and sensor fusion is greatly strengthened by utilizing the best machine learning methods available. Finally genetic algorithms are presented as a means to search large parameter spaces.
2.2 Digital Signal Filtering
2.2.1 Filtering
A filter is a component that is devised to change the spectral content of an inputted signal in a required manner. Filtering is commonly used to improve the quality of a signal and extract relevant information from a signal. Common filtering objectives include improving signal quality and de-interlacing previously combined signal components. In this work filtering is employed to improve the classification process by removing unwanted noise from sensor data.
Filtering is a process that allows a desired range of frequency com-ponents to pass in a signal called the passband while attenuating all other frequency components called the stopband. A digital filter is a
mathematical algorithm implemented in software that manipulates an inputted digital signal to create a digital output signal that achieves a wanted criteria.
Filters can be classified in terms of their magnitude response. These are lowpass, highpass, bandpass, and stopband filters. A low-pass filter passes signal components under a desired frequency while attenuating signal components over this cutoff frequency. A high-pass filter passes signal components over a desired frequency while attenuating signal com-ponents lower than this cutoff frequency. A bandpass filter combines a low-pass and high-pass filter to only allow frequencies components within a desired range to pass. A stopband filter again combines a low-pass and high-pass filter to only attenuate frequencies components within a de-sired range. Filters can also be categorized in terms of their impulse response. The two possibilities are a finite impulse response (FIR) filter and a infinite impulse response (IIR) filter. The FIR filters impulse re-sponse is of finite duration because it settles to zero in finite time. For a linear and time-invariant FIR filter of order N, each value of the output sequence is a weighted sum of the most recent input values. This can be seen in equation 1 where x[n] is the input signal, y[n] is the output signal, N is the filter order and bi is the value of the impulse response
at the i’th instant y[n] = N X i=0 bi·x[n−i] (1)
The advantages of a FIR filter over a IIR filter include the fact that it has no feedback. This causes no rounding errors to be compounded by repeated iterations. This also makes FIR filters inherently stable. y[n] will always be a finite number since the largest value it can attain is
P
biI where I is the largest input.
The IIR filters impulse response is of infinite duration because it does not become exactly zero past a certain point, but continues indefinitely. It can be seen in equation 2 where P is the feedforward filter order, bi
are the, Q is the feedback filter order feedforward filter coefficients, ai
are the feedback filter coefficients, wherex[n] is the input signal andy[n] is the output signal.
y[n] = 1 a0 ( P X i=0 bix[n−i]− Q X j=1 ajy[n−j]) (2)
The main advantage digital IIR filters have over FIR filters is that they require less memory and cpu iterations to achieve a required filter re-sponse characteristic for any magnitude. IIR filters require a lower order
Q than a FIR filter to achieve the same results. Also, certain desired responses are not practical to construct with FIR filters.
2.2.2 Butterworth Filter
A Butterworth filter is a popular IIR filter used in DSP. It is a maximally flat magnitude filter and was first invented in 1930 by the engineer and physicist Stephen Butterworth[6]. Its frequency response is maximally flat in the passband and slopes towards zero in the stopband. Butter-worth filters have a monotonically changing magnitude function with ω
whereas other popular filters such as Chebyshev or Elliptic filters that have non-monotonic ripple in the passband or the stopband. The But-terworth filter was employed in this work to reduce background noise such as when using captured ECG data
2.3 Signal Feature Extraction
Once data is captured, features must be extracted that will allow the identification of activities. Feature extraction is the process of simpli-fying the amount of information required to describe data accurately. Features with higher correlation between similar patterns (intra-class variation) and poorer correlation between dissimilar patterns (inter-class variation) are desirable. Analysis with a large number of variables can require a large amount of computer memory and computation power. More importantly a large input into a classification algorithm can cause overfitting in the training sample which produces models which respond poorly to new samples. Choosing the most discriminative features is key otherwise the model will not be able to distinguish between samples and the classification accuracy will be unsatisfactory. There are many well known general dimensionality reduction techniques used in signal fea-ture extraction such as principal component analysis, Fourier analysis, semidefinite embedding and wavelet analysis.
2.3.1 Fourier transform
The Fourier transform is the cornerstone of discrete signal processing due to its ability to deal with linear time-invariant operators because the output does not depend on the particular time the input is applied. It is also able to deal with uniformly regular signals. While not as complex as the DWT is has been employed to extract features for activ-ity classification problems with success. The discrete Fourier transform (DFT) transforms a definite array of samples of a function into a array of coefficients of a fixed length of complex sinusoids, arranged by their fre-quencies. Therefore it is able to convert information in the time domain
to the frequency domain and vice versa. The fast Fourier transform (FFT) is an algorithm that calculates the discrete Fourier transform (DFT) and its inverse. The FFT is used instead of the DFT because it reduces the number of complex multiplications from N2 to Nlog2(N). For these reasons the FFT was investigated in this thesis.
Use of mean and energy of FFT components has been shown to re-sult in accurate recognition of certain postures and activities [7][8][9]. Frequency-domain entropy is calculated as the normalized information entropy of the discrete FFT component magnitudes of the signal. This feature supports discrimination of activities with similar energy values as more uniform movement patterns may show a single dominant fre-quency component and very low magnitude for all other frequencies. On the other hand complex movements may show various frequencies of a similar magnitude[10].
2.3.2 The Wavelet Transform
The wavelet transform has been used with much success in extracting discriminative features from data to aid in classification [11][12][13]. The wavelet transform is a commonly used function [14] in signal process-ing applications such as decomposprocess-ing, compression, feature extraction, encoding, and signal reconstruction. The Fourier transform is the cor-nerstone of discrete signal processing due to its ability to deal with linear time-invariant operators or uniformly regular signals but for sig-nals that have transient properties, the Fourier transform is not ideal as it requires a large number of coefficients to represent a localized event. Wavelet bases, like Fourier bases, reveal the signal regularity through the amplitude of coefficients, and their structure leads to a computa-tionally efficient algorithm. However, wavelets require few coefficients
to represent local transient structures due to being well localized. The technical computing software MATLAB [15] has toolboxes which allow for the extraction of DWT coefficients from a data signal [1].
A wavelet is an oscillating function about zero which includes both the analysis and window functions. By shifting the wavelet over the signal and correlating the two, time information can be calculated. To decompose a signal into a set of basis functions called wavelets requires a pair of waveforms that represent the high frequencies and low frequen-cies. The wavelet function corresponds to the high frequency details of the signal while the scaling function corresponds to the low frequency parts of the signal [1].
2.3.3 The Discrete Wavelet Transform
Using the Discrete Wavelet Transform (DWT), any signal can be decom-posed into a group of discrete wavelet coefficients. Almost all DWTs use filter banks for the analysis and reconstruction of a signal which may contain either finite impulse response or infinite impulse response filters. The filter banks contain high and low frequency filters to derive the fre-quency content of the signal in the sub-bands. Therefore the DWT decomposes a discrete signal into two sets of coefficients; approximation and detail. After the filtering, half of the samples can be eliminated according to the Nyquist’s rule, since the signal now has a highest fre-quency of π2 radians instead ofπ. The signal can therefore be subsampled by 2 by discarding every other sample [1].
Using the same method the resulting approximation coefficients are then split into new approximation and detail coefficients. This procedure is iteratively executed to create a group of approximation coefficient vectors Ai and detail coefficient vectors D1, D2, . . . , Di at the ith level,
Figure 1: DWT decomposition of signal x[n]
as outlined in Figure 1. There are N2i elements in the approximation
vector Ai and N2i elements in the detail vector Dj (where j = 1, . . . , i)
when the original signal has N elements[1].
The choice of the so called “ mother wavelet” is crucial as it generates all the wavelet functions that determine the properties of the resulting wavelet transform which in turn relates to the transform’s performance in any application. Currently there is no standardized way to select the mother wavelet and the choice depends on the application. The most important and commonly considered parameters when choosing a wavelet are its number of vanishing moments, its regularity, compact-ness and symmetry. A wavelet has p vanishing moments only if the
wavelet scaling function can generate polynomials up to degree p−1. More vanishing moments means that the scaling function can represent more complex functions which allows for a sparser set of wavelet coeffi-cients. The regularity gives an approximate measure of the number of continuous derivatives that the wavelet function possesses. The regular-ity therefore gives a measure of the smoothness of the wavelet function with higher regularity implying a smoother wavelet[1].
The compactness of the wavelet (size) is also important. For exam-ple, Daubechies second order is fast to compute but the narrowness in time implies a very large width in frequency. Alternatively, wavelets with large compact support such as the Coiflet order 22 are smoother, have finer frequency resolution and are usually more efficient at de-noising. Thus, a balance between analysis accuracy and computational time is required. The symmetry properly indicates whether the filters have a linear phase, which is an important characteristic to provide perfect reconstruction. Symmetric wavelets show no preferred direction in time, while asymmetric wavelets give unequal weighting to different directions[1].
In signal processing the most commonly used wavelets are Haar, Daubechies, Coiflet, Symlet, bi-orthogonal and reverse bi-orthogonal. Coiflets and Symlets evolved from the Daubechies wavelet. Daubechies, Coiflet and Symlet are orthogonal and compactly supported wavelets. Daubechies wavelet is asymmetric, is compactly supported and has minimum-phase associated scaling filters. Coiflet is near symmetric, is complactly supported and has the highest number of vanishing moments. Symlet has the least asymmetry, is compactly supported and has linear-phase associated scaling filters. These wavelets suffer poor regularity[1].
and are compactly supported wavelet pairs. Bi-orthogonal wavelets are also symmetrical, resulting in linear-phase filters, which are needed for perfect signal reconstruction. Bi-orthogonal (BO) wavelets utilize two different wavelets; one for decomposition and the second for reconstruc-tion. Exact reconstructions are possible with FIR filters. Reverse bi-orthogonal wavelets swap the BO wavlets synthesis and analysis parts. Due to being bi-orthogonal processing time is increased[1].
2.3.4 Energy of the DWT
In this work features of sensor signals are extracted using the DWT and fed into various classification algorithms in order to correctly iden-tify a person’s current activity. Various DWT decomposition levels can be explored however each increment in level increases the overall com-putational time required. The total energy ET at level i of the DWT
decomposition is given by [16]: ET =AiATi + i X j=1 DjDjT (3)
where Ai is the approximation coefficient at level i and Di is the
detailed coefficient at level i. One feature that can give discriminating results is the energy ratio in each type of coefficient [16]. EDRA
rep-resents the energy ratio of the approximation coefficients while EDRD j
represents the energy ratio of the detail coefficients.
EDRA= AiATi ET (4) EDRDj = DiDjT ET j = 1, . . . , i (5) With the EDRs calculated a foundation has been created for
de-tailed information features to be extracted. In [16] Ayrulu-Erdem and Barshan found that the normalized variances of the DWT decomposi-tion coefficients and the EDRs provided the most informative features for a different albeit similar problem to that investigated in this thesis. Specifically they investigate extracting the informative features of gyro-scopic signals using the DWT decomposition and provide them as input to multi-layer feed-forward artificial neural networks for leg motion clas-sification. They investigated the performance of their approach using different informational features such as normalized means, minimums and maximums of the EDRs and obtained superior performance. As such it is proposed to adopt the approach in this work. The variances of the coefficients are calculated over each DWT coefficient vector at the
ith level
Ai, D1, D2, D3, ..., Di (6)
Therefore, at theith level there arei+1 variance values calculated for each axis segment, totalling 3(i+ 1) features for an accelerometer signal. The amount of EDR features is equal to the amount of DWT coefficients. Adding these features to the variances gives a total of 6(1 +i) features at level i. Figure 2 provides an overview of how this approach fits into a complete classification pipeline [1].
2.3.5 Applications Industrial
Tools that can accurately predict the lifespan of equipment in indus-try allow the optimization of resources and reduce the number of delays.
Figure 2: System overview of the DWT decomposition and classification pro-cess [1]
Saravanan et al. in [17] utilizes extracted features from the DWT to diagnose faults in a gear box. The vibration signals of a spur bevel gear box in different conditions were recorded. The DWT was used to extract features from all possible types of transients in the vibration signals and these features were passed into an artificial neural network for classifi-cation. Vibration signals obtained during the microdrilling process were used in [18] for Drill Wear Monitoring. The DWT with statistical esti-mations of the signal energy distribution was again employed to extract features describing energy spikes quantitatively. Non-destructive auto-matic identification of defects in equipment or produced goods improves safety and lowers costs. The authors in [19] present a method to detect a variety of rail-road wheel-bearing faults using audible acoustic signals at a variety of different train speeds. FFT and DWT features were both implemented with each achieving accurate results.
Healthcare
as the automatic detection and classification of cardiac abnormalities [20]. This can facilitate the diagnosis of cardiac disorders and diseases more easily and quickly than current methods.
In [20] the authors propose a method to accurately classify ECG ar-rhythmias through a combination of wavelets and artificial neural net-works. The capability of the DWT to decompose a signal at various resolutions allows accurate extraction of features from non-stationary signals like ECG. Their method is efficient at differentiating the natural sinus rhythm and 12 different arrhythmias. Heart rate variability (HRV) is a widely employed quantitative marker of the autonomic nervous sys-tem and can be used as a predictor of a person’s risk to cardiovascular diseases. In [21] Acharya et al. uses the FFT to extract the power spec-tral densities of the HRV to determine to which of nine cardiac classes a person belongs.
Detailed contextual information regarding a user’s activities can be used to encourage people to lead a less sedentary lifestyle and therefore become more active and healthy. In [10] the authors use the FFT to ex-tract features from five small biaxial accelerometers worn simultaneously on different parts of the body. A dataset was created with twenty sub-jects who self annotated twenty different daily activities. The authors then investigated the performance of different classification algorithms achieving high results. Nyan et al. in [22] created a system that used DWT features to detect falls. When a fall was detected a SMS was auto-matically sent indicate someone has fallen and to summon professional medical assistance.
2.4 Sensing
Motion detection is the process of detecting a change in position of an object relative to its surroundings or the change in the surroundings rel-ative to an object. Calculating a person’s change in momentum involves deciphering their movement in a three dimensional space and is a chal-lenging undertaking. The amount of academic literature which deals with wearable inertial sensors in the area of automatic activity classi-fication has began to grow in recent years largely due to the relatively recent drop in cost of inertial sensors.
While chapter 3 describes the state of the art in using inertial sensors for automatic human activity classification, the following section more generally introduces inertial sensing and its applications.
Accelerometers have been used for human activity recognition in a large amount of existing work [23][24][25]. Research has shown that accelerometers can be used to identify human activity for high energy actions such as walking, jogging, jumping, etc [26]. In sports, accelerom-eters have been used to monitor elite athletes in competition or training environments. In swimming applications, accelerometers have allowed the comparison of stroke characteristics for a variety of training strokes and therefore have helped perfect swimming technique [27]. When used in competitive rowing and coupled with other monitoring techniques such as impeller velocity, they allow for the study of intra and inter stroke phases as a means to assess performance and this has been used by competition rowers to improve performance at national and interna-tional competitions [23].
2.4.1 Accelerometers
The authors in [2] describe a single axis accelerometer as a mass, sus-pended by a spring in a housing as seen in Figure 3. The mass is per-mitted to shift in one direction which is the sensitive direction of the accelerometer. The deracination of the mass is the contrast between the acceleration a and gravity g along the selected axis given by the unit vector n. sA,n, a electrical signal is directly connected to these physical
properties as seen in equation 7.
sA,n =kA,n(a−g)·n+oA,n (7)
An, k defines the scaling factor whileAn, o defines the offset. There-fore a tri-axial (3D) accelerometer can be constructed by combining three single axis accelerometers.
Parvis et al. in [28] created an algorithm that allows the change in orientation to be described by the changes by the change in the three axes. The output vector SyA can therefore be related to the starting
acceleration and gravity by equation 8.
Sy
A =S a−Sg (8)
The vector is using a coordinate system and therefore there is a S on the left side of a vector to indicate this. A 3D accelerometer can be used to the calculate angle for activities in which the acceleration is lower than the gravity vector. The angle is calculated by measuring the angle of the sensor axes to the gravity vector. One negativity is that the rota-tion around the vertical cannot be quantified since if the device is spun around the gravity vector Sy
illus-Figure 3: A single axis accelerometer, containing a mass suspended by a spring. The distance d of the mass with respect to the sensor housing is calculated and is a function of acceleration and the direction of gravity with respect to the direction of distance measurement. The unit vectornrepresents the sensitive axis of the sensor. [2]
Figure 4: A single axis accelerometer showing how energy generated by a force charges an electrical circuit which can be measured [3]
trates a single axis capacitive accelerometer. Capacitive accelerometers measure the difference in electrical capacitance, caused by acceleration, to alter the output of an powered circuit. The measuring node comprises of two parallel plate capacitors (CS1 and CS2) performing in a differ-ential mode. These capacitors work in a bridge circuit, together with two defined capacitors, and change the peak voltage created by an oscil-lator when the device experiences acceleration. This value is captured by a detection circuit which is then amplified and outputted [3]. While undergoing a consistent acceleration, the capacitance is constant, which results in a signal corresponding to uniform acceleration. By layering three capacitive accelerometers at alternate angles in an XYZ fashion, a 3D accelerometer can be assembled. The investigation of accelerometer signals in this work are gathered on a 3D accelerometer device with an output detailed by Equation (8), after being calibrated on the logic of Equation (7).
2.4.2 Electrocardiography
Electrocardiography (ECG) is a transthoracic interpretation of the elec-trical activity of the heart over a fixed period of time [29]. This activity is determined by electrodes affixed to the skin. This noninvasive sensor is used to calculate and record the regularity of heartbeats. This infor-mation can be used to infer the size and position of the heart chambers, whether the heart has suffered any damage and the effects of medica-tion or devices used to regulate the heart such as a artificial cardiac pacemaker.
When the heart muscle depolarizes during each heartbeat, a small electrical development on the skin transpires. This development can be monitored and amplified by a ECG device. initially each cell in
Figure 5: Smartex Wearable Wellness System. (a) Respiration sensor posi-tioned at the front centre of the band. Accelerometer located in the CSEM recording module which is housed in the indicated pouch. (b) Fabric ECG electrodes located on the inside of the chest strap.
the heart has a negative charge across it cell membrane. The arrival of positive ions, Na+ and Ca++ boosts the negative charge to zero which is called depolarization. This kicks off the processes in the cell that make it contract. A healthy heart will have a regular progression of depolarisation waves that are formed by the sinoatrial node. These waves advance through the atrium before making their way through the ventricles. The ECG detects this as small rises and falls in the voltage between the two electrodes. An example of an ECG that was used in this work can be seen in Figure 5.
The human heart rate can alter widely according to the body’s cur-rent physical activity. This includes the curcur-rent oxygen absorption rate and need to excrete carbon dioxide. Physical exercise, sleep, anxiety, stress, illness and ingesting are some of the many activities that can instigate change in the heart rate [30].
2.4.3 Applications
This section presents applications for automatic human activity classi-fication systems where unobtrusive monitoring is desired. First appli-cations for healthcare and assisted living are described. Following that
applications are presented. Additionally for completeness two other ap-plication groups are presented; industrial apap-plication uses and applica-tions for the entertainment and gaming industry.
Healthcare and Assisted Living
Automatic human activity classification systems and context-aware computing is often motivated by the desire to create new healthcare ap-plications and technologies for the ageing population. People all over the world are living longer due to recent improvements in public health, nutrition and medicine. Ironically this is creating new problems in the healthcare system as the percentage of elderly people in society is in-creasing due to longer life expectancy. It is foreseen that emerging tech-nology can solve these problems for example by allowing the elderly to become more independent and therefore require less direct assistance by medical professionals.
Systems have been designed that aim to prevent conditions and ac-cidents prevalent in the elderly population before they occur. Sensors which have gathered physiological data over a long period of time to identify changes or unusual patterns in a user’s daily activities which can indicate early symptoms of diseases such as alzheimer’s disease and thus help prevent them. Automatic recognition of small changes in daily activities is a popular area of research. Accelerometers can log vast amounts of data over long periods of time and thus have the capability to give user’s summaries of daily activities [31] or applications which accumulate data from physiological sensors [32] [33] allow doctors and care givers to give better service as they can better determine the current health state of a patient
Detailed contextual information of a users activities can be used to encourage people to lead a less sedentary lifestyle and therefore become more active and healthy. Accelerometers in mobile phones were used by Maitland et al in [34] to increase the awareness of daily activity lev-els. By monitoring daily activity levels they can provide regular detailed summaries and use this information to encourage the user when appro-priate. In [35] Consolvo et all describes a similar method where inertial sensors are employed for automatic activity recognition so that when a positive activity such as walking a certain distance durning the day is achieved by the user, a feedback system displays virtual rewards on a mobile phone screen. Andrew et all in [36] utilizes localisation data as well as inertial data on a mobile phone to suggest contextual physical activities. One such example is suggesting to walk to the next bus stop when there is ample time before the next bus will arrive.
Human activity classification systems can be used to diagnose dis-eases and disorders. This can lower healthcare related costs and speed up the time taken to diagnose a patient. In [37] the authors create a real-time monitoring system for cardiovascular disease using a wearable system. They fuse the portability of Holter monitors with a start-of-the-art Smstart-of-the-artphone that can provide an helpful diagnosis solutions. Captur-ing data via a Smartphone instead of a large, bulky contemporary ECG machine allows much more data to be recorded without drastically in-terfering with daily activities.
Recent advancements in wireless communication technology have helped to improve non invasive wearable sensors, which can be used in the home or at a health institution. Wearable sensors that allow motion to be captured can be used for healthcare treatment and diag-nosis [38][39]. Accelerometers and gyroscopes are the most frequently
used inertial sensor used to distinguish between motor movements in the healthcare system [40]. They can be attached to any location on the body as well as specialised equipment to collect inertial data created by patients or even recuperating athletes. Glaros et al [41] incorporates a portable virtual reality interface to help optimize treatment and training procedures during rehabilitation for athletes. It also provides them with instant feedback on mistakes made any time during a training session.
Sporting & Leisure Applications
Sporting applications is another area where inertial sensors have found significant use. In [42] Ermes et al constructed a wearable system that could identify basic everyday activities as well as sporting activities such as playing soccer, riding a bicycle and performing exercise routines such as rowing. A Neural Network classifier was employed to distinguish between different activities. In [26] the authors calculated the amount of energy expended when a selection of daily activities such as walking, running, cycling and driving are performed. Along with these daily activities some sporting activities such as soccer, volleyball, badminton, boxing and table tennis, were analysed .
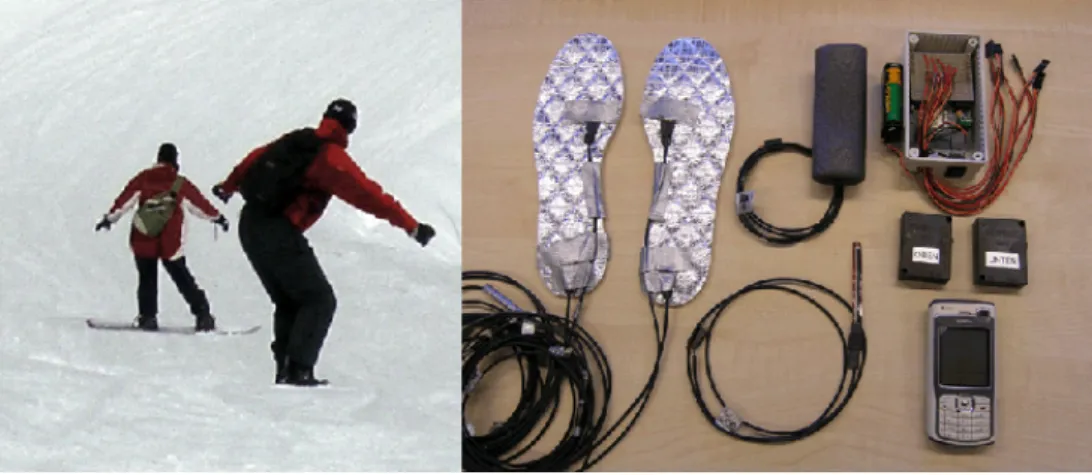
Motion detection in the context of martial arts activities can be iden-tified by fixing a 3D accelerometer to the torso of a subject to capture the unique body acceleration performed. The research conducted in [43] uses accelerometers and gyroscopes attached to the body to identify different actions in Wing Tsun to increase immersion in video games of martial arts. Additionally this same technology could create similar sys-tems for martial arts instruction. In [44], the authors present an on-body wireless sensor system for measuring snowboarding specific activities in real-time (see Figure 6).
Figure 6: A on-body wireless sensor system for measuring activities during snowboarding in real-time
Accelerometers are used to calculate force impacted on the snow-board along with an intelligent wireless network that captures and anal-yses the posture and motion of the snowboarder.
Ghasemzadeh et al. use signal progressing algorithms to calculate the angular rotations of a subject’s wrist during a golf swing in [45]. As in [43] where Heinz is able to find the quality of the martial arts movements performed Ghasemzadeh et al. is able to quantify the users expertise and skill level of the person making the golf swing. The system can then recommend appropriate feedback for the user. Arvind et al. use a double pendulum system to model the golf swing and use accelerometers placed along the body and golf club in [46]. This setup allows them to determine how closely the movements of the user follow a predetermined motion and give an appropriate score.
Commercial systems which employ inertial sensors for sporting appli-cations include Nike+, which monitors an athlete’s sporting activities. A small transmitter device is either embedded or placed on the shoe, which can log all running and jogging exercises. This data can be aggregated over time to allow the user to observe the change in their performance
over time. This sensor can be integrated with additional devices such a smartphone that allows them to engage in challenges with other runners and walkers. The F50 adiZero mi-Coach was first released in 2011 and it features mi-Coach match analysis technology which provides feedback on user performance. Mi-Coach is a three part system including a stride sensor, a heart monitor and a receiver. It tracks a subject’s max speed, number of sprints, distance travelled and number of sprints. This data can be aggregated over time to allow the user to track his/her fitness training performance.
Industrial Applications
In an industrial setting, automatic human activity classification sys-tems can potentially help workers in their responsibilities, reduce acci-dents, improve productivity and increase overall safety in the workplace. Xybernaut has been creating wearable monitoring systems since 1990 that support workers in industry by allowing them to conveniently ac-cess relevant information and to collect suitable data. In [47] Stanford explains that the shipping, airline and telecommunications industries were the first organisations to incorporate intricate wearable technology successfully into their businesses.
The authors in [48] show an example of on body sensors being used in emergency response units, hospitals, aircraft maintenance and motor manufacturing assembly lines. Data collected by the wearable sensors allow activity classification software to provide hands free interactions to data which speeds up the training of new workers and creates a summary of worker activities. The authors in [49] combine information from body worn microphones and accelerometers to recognise activities that are
Figure 7: XBee accelerometer sensor box for integrating dance motion with interactive visualizations (with a quarter shown for size comparison)[4].
characterized by a hand motion and an accompanying sound. They describe a method for the continuous recognition of activities such as sawing, hammering, drilling and grinding.
Entertainment and Games
Increasingly, entertainment systems like home gaming consoles and smart-phones are incorporating player activity classification technology to al-low the creation of a wide range of customised applications for enter-tainment gaming. Accelerometers have been employed to distinguish between different activities in various entertainment contexts. One such area is the performing arts where sensors have been secured to dancers to enhance audience interaction. In [4] the authors investigate lightweight methods for integrating dance motion with interactive visualizations and enhancing audience interaction. The sensors allow dancers to add an ex-tra dimension to their performance with interactive multimedia content that correlates with their movements Their proposed lightweight system can be seen in Figure 7.
The authors in [50] introduce a system for augmented reality-based evaluations of Salsa dancer performances. Their system enables an en-hanced dance visualisation experience, through the augmentation of the original media with the results of their automatic analyses by fusing
data from wireless inertial measurement units and audio sensors. Visualising dancer’s motions is a popular research area as seen in [51][52][53]. Inertial sensors are used in correlation with advanced ma-chine learning technology to recognise different body movements. The data captured by the sensors is logged and then once the performance is finished this logged data is classified which in turn allows the dancers movements to be visualised.
The gaming industry has pushed the introduction of inertial sensors into their products for some time. The hugely successful Nintendo Wii which has sold more than 100 million units has an accelerometer in its controller which allows gesture recognition which is the main method of interacting with the system. Zhang et al. in [54] introduce a system to control a computer game using a wearable motion sensor. Similarly in [43] the author’s employ body worn accelerometers to detect movements which control an avatar in the game.
Other Application Areas
Inertial sensors have been used in other fields for automatic activity classification. In [55] the authors employ wearable accelerometers to recognise soldier activities. These sensors can record the list of activi-ties performed by a soldier during a mission or training exercise which then can be used to automatically generate field or training reports. Ad-ditional this technology can automatically supply vital information to military command to aid timely strategy decisions. Sala et al explains in [56] that activity recognition with inertial sensors can be used to target mobile advertising.
2.5 Sensor Fusion
The vestibular system in the inner ear of biological creatures supplies inertial information which is required for movement, body position and orientation. This system allows humans to achieve efficient head sta-bilisation and perform visual tasks. The knowledge acquired by the vestibular system is required to perform eye movements such as track-ing and gaze holdtrack-ing [57]. It has been established that human vision and the vestibular system fuse neurological signals at a very early processing stage [58]. The inertial information increases the accuracy of the vision system and the visual cues help spatial orientation. This approach of us-ing combinus-ing complementary sensor signals to aid a system can be used in computer science. There are many advantages to sensor fusion and in this thesis, fusion of multiple sensor streams is used, in one example the fusion of accelerometers, ECG and respiration sensors are proposed to increase the overall classification accuracy of a system compared to a solitary sensor stream.
Inertial sensors have been employed for navigation systems as well as guidance of defence systems. Orientation, speed and altitude are cal-culated using accurate accelerometer and gyroscope sensors whose data is fused with localisation technology such as the Global Positioning Sys-tem (GPS) as well as data from radar stations. Each of these sensors is capable of creating vasts amounts of data so therefore intelligent algo-rithms are required that can extract and combine the pertinent pieces of information. All sensors have advantages and disadvantages and no one sensor is a 100% accurate at measuring a physical quantity.
Sensor fusion is the process of fusing the sensory information from two or more noisy sensors to acquire useful information, where data
captured is unique. Sensor fusion has many applications such as auto-matic vehicle guidance, autoauto-matic target recognition in missile guidance, combat surveillance and automated threat detection systems, such as identification friend-foe-neutral (IFFN) systems [59]. Non military ap-plications include movement of materials in manufacturing processes, robotics [60], automatic vehicle guidance such as robotic vacuum clean-ers and also within healthcare devices.
The techniques used to combine the data is drawn from areas such as digital signal processing, statistical evaluation and artificial intelligence [61] [62]. In 1985 the Joint Directors of Laboratories (JDL) created the Data Fusion Group which published a model which separated the different processes associated with data fusion into 6 levels [63]. This model is still in use today and provides researchers important guidelines for data fusion. Other widely used approaches to fuse sensor data are Bayesian Fusion [64] and Kalman Filtering [65]. These methods can be employed to fuse data from various indirect and noisy sensors.
Sensor fusion allows the advantages of one sensor to overcome the disadvantages of another. One example of this is how magnetometers are utilized to reduce integration drift that occurs in gyroscopes. Iron in magnetic equipment interferes with the local magnetic fields and this affects the orientation measurement. This drift problem can be rectified by examining the errors in the gyroscope drift as it will have a different pattern than found in local magnetic field.
There are two approaches to fusion; early and late. The difference between this two approaches is simply when in the classification pipeline results are fused together. Early fusion merges the features of each modality before any machine learning is conducted whereas late fusion merges the features of each modality after some machine learning has
been conducted. These two approaches are described in more detail in section 4.4.
2.6 Machine Learning
Data mining is a methodology which can infer new knowledge by extract-ing information from a data set and transform it into an understandable structure for further use. These structures can lead to potentially useful new information that is not always apparent without intelligent data analysis. Machine learning is a technology which concerns the creation and study of systems that can learn from data and is therefore a branch of data mining. It requires computer programs which are trained to locate patterns in data. The following sections describe the main prin-ciples of machine learning. First, Bayes theorem is introduced, which is the fundamental equation for statistical learning. This is then followed by an introduction to classification and regression before presenting the main differences between generative and discriminative models. Finally supervised and unsupervised approaches in machine learning are de-scribed.
2.6.1 Bayes Theorem
Bayes theorem is widely used to find probabilities in machine learning and is fundamental to Bayesian Networks. In mathematical terms, Bayes theorem states the relationship of the probabilities of A and B, P(A) and P(B), and the conditional probabilities of A given B P(A|B) and
B given A P(B|A) [66]. In its simplest form, it is:
P(A|B) = P(B|A)P(A)
![Figure 1: DWT decomposition of signal x[n]](https://thumb-us.123doks.com/thumbv2/123dok_us/10220720.2925930/31.892.326.680.154.645/figure-dwt-decomposition-of-signal-x-n.webp)
![Figure 2: System overview of the DWT decomposition and classification pro- pro-cess [1]](https://thumb-us.123doks.com/thumbv2/123dok_us/10220720.2925930/35.892.226.751.164.376/figure-overview-dwt-decomposition-classification-pro-pro-cess.webp)
![Figure 4: A single axis accelerometer showing how energy generated by a force charges an electrical circuit which can be measured [3]](https://thumb-us.123doks.com/thumbv2/123dok_us/10220720.2925930/39.892.239.721.758.979/figure-accelerometer-showing-generated-charges-electrical-circuit-measured.webp)