* To whom all correspondence should be addressed.
Application of Modified K Means Clustering Algorithm
in Segmentation of Medical Images of Brain Tumor
Sana Iqbal and Jitendra Sheetlani*
Department of Computer Application,
Sri Satya Science University of Technology and Medical Sciences, India. http://dx.doi.org/10.13005/bbra/2502
(Received: 21 April 2017; accepted: 25 April 2017)
The process of segmenting medical images serves as a vital technique in partitioning the image into different clusters or homogeneous regions. Lots of techniques and algorithms were developed and applied in various applications. Magnetic Resonance Images (MRI) are used for producing images in the soft tissues of human body. The presence of noise in the MRI images of Brain is a multiplicative factor and the reduction of noise is required to obtain good quality in segmentation. However, the concept of accurate segmentation in MRI images is more important and crucial for the proper diagnosis by computational tools aided to perform clinical studies. More clustering algorithms were developed for the segmentation of images from magnetic resonance. However most of them have their limitations and in order to overcome those limitations, a modified version of k means clustering methodology is proposed. The comparison of existing approaches in segmentation such as C-Means Clustering and K-Means Clustering with the Modified version of K Means Clustering is performed to evaluate the performance. Finally certain outcomes were generated in the clustering algorithm of Fuzzy c- means, k-means and modified version of k means for MRI taken in brain and it was observed that the modified version of clustering technique in Kmeans gives better results for the complete performance by measuring parameters such as the index measure of structural similarity, content of structure, mean squared error and analysis of signal noise ratio.
Keywords: Fuzzy C-Means, K-Means, SSIM, SC, PSNR.
Segmentation of an image is a major research topic for many researchers involved in the field of image processing. There are obvious reasons and endless applications in the field of computer vision and analysis of image problem with respect to machine learning strategies are required in every stage of segmentation, in order to detect the specific objects and divide the single image into multiple regions for the consideration of homogeneous streamline to a given criteria, features such as texture, color, motion and etc should be
considered. Clustering technique searches for distinct groups in the space allocated for feature. It is expected that certain specific groups have different structures and it can be differentiated clearly. The task of clustering is to separate the data into several number of partitions and the volume is the feature space is n-dimensional. These partitions have limits between the different groups and they depend on the usages of functions for modeling the distribution of data.
spatially for obtaining images to understand the mechanism of biological functions. The radio frequency (RF) pulse emitted by the MRI machine binds specifically to hydrogen ions. The system sends the pulse to that specific area of the body that needs to be examined. Due to RF pulse, protons absorb the needed energy to spin in a different direction and this condition is called as the resonance in magnetic imaging. The RF pulse is responsible for the proton spin in a specific direction with laminar frequency. This frequency is based on the imaging of the specific tissue and the strength of the magnetic field. MRI has three fields in electromagnetic nature and they are static field, a very strong magnetic field which polarizes the nuclei of hydrogen; gradient field, a weaker field with time variations for spatial encoding; and a weak radio frequency field for manipulation of the hydrogen nuclei to produce measurable signals and those signals are collected through the antenna with radio frequency.
Challenges involved in Image Processing of Brain
The brain is the anterior part of the central nervous system (CNS). Brain tumor is a solid neoplasm in intracranial level. Tumors are created by a process of uncontrolled cell division in the brain. In order to study the 2D image of brain with an axial view point, MRI scan is preferred in most cases because it is less harmful to brain than the CT scan. A patient is subjected to different diagnostic methods for determining the cause for the symptoms. Techniques like obtaining a biopsy to process imaging like taking a MRI or CT scan of the brain is a key concept in understanding the concept of digital pathology. In case of biopsy, pathologist will take a specimen of the brain tissue under the consideration to check the presence of tumor. Pathologists look at the tissue in microscope to check the presence of abnormality. Though biopsy detects the presence of tumor with respect to pathology, doctors must be aware about the extent and location of tumor to perform surgery in brain. Traditional method in hospitals follow the process of segmenting the medical image under consideration and this depends on the perseverance of the physician to get the required region. In traditional method, it is difficult to obtain the location and extent of tumor because resembling
of minute variations between the affected regions of tissues can’t be captured simultaneously [1].
Clustering
Clustering is an iterative technique to portion the Image into clusters. In the clustering method, the number of clusters (K) is an input parameter. Here, the main challenge is to obtain a good quality of the segmented output [2].
Procedure
1. Pick cluster (K) and assign the centres in random method or some heuristic principles.
2. Assign every pixel in the image to the k for minimizing the distance between the pixel and the centre of Cluster.
3. Re-compute the centres of the cluster by taking an average of all pixels in the cluster.
4. Repeat steps 2 and 3, till the convergence is attained.
Note
The Clusters can be selected manually or randomly or based on some criteria. The distance between the pixel and the centre of the cluster is calculated by the absolute difference between a pixel and the centre of a cluster.
Clustering in Image Segmentation
Clustering method is considered as the most important concept in the principle of unsupervised learning and it is involved in finding a structure for a collection of an unlabeled data2.
A definition foe clustering can be “The process of organizing objects into groups whose members are similar in some way”3. A cluster is a collection of
objects which are “similar” and the “dissimilar” objects belong to the other clusters4, 5.
Clustering by Fuzzy C-Means (FCM)
FCM allows one data to get fixed or projected in two or more clusters because in this algorithm allows the pixel to get placed in multiple classes with varying degrees of membership and it is based on the minimization of the following objective [6-9].This technique was introduced in 1981 by Professor Jim Bezdek. The FCM algorithm attempts to partition a finite collection of elements into a collection of fuzzy clusters (say C) with respect to given criteria.
If a partition matrix (Say U) is created in the dataset, then
Where is a numerical value in [0, 1] that tells the degree to which the element belongs to the ith cluster.
Algorithm
Step 1: Select the number of clusters (C), such that
Step 1.1: Assign the exponential weight (¼), such that
Step 1.3: Initialize the patrician matrix and the criteria for termination with the range of “iteration index from 1 to 0”.
Step 2: Calculate the Centres of Clusters
by .
Step 3: Calculate the patrician matrix by
.
Step 4: Calculate the new partition matrix
; if
,
Set 1 = 1+1 and proceed to Step 2.
Clustering by K means
K-means is the simplest among the algorithms in unsupervised learning. The procedure follows the easiest way to classify a data set through the fixed number of clusters in priority basis [10].
This algorithm aims at minimizing an objective function with respect to a squared error function. [11-14].
Algorithm
(i) Place points (K) in the space represented by the objects that are being clustered and these points represent an initial group in centroid.
(ii) Assign each object to a group that has a closer
distance with centroid.
(iii) When all objects are assigned, recalculate the position of the points (K) in centroid.
Note
Repeat (ii) and (iii) until the centroids reach their stagnation [8]. This produces a separation in the objects into groups and based on their groups, the metric can be calculated for a minimized distance.
Modified K means Clustering
Modified K-means algorithm is a popular clustering algorithm in data mining. This algorithm is applied in the fields of bioinformatics, image segmentation and etc., this algorithm is well suited for small datasets. In this manuscript, we propose an algorithm for larger datasets. Modified k-mean avoids the locally optimal solution in some degree and reduces the noise to obtain more accuracy in cluster.
Algorithm
(i) Initialize the image in the MATLAB environment by imread function.
(ii) Convert the image on the basis of L*a*b color space using the make-up form and applying-layer form.
(iii) Calculate mean in each step.
(iv) Classify the colors by cluster label on the basis of k means
(v) Results from k mean is directly proportional to the cluster label.
(vi) Create a segmented image on the basis of color by cluster.
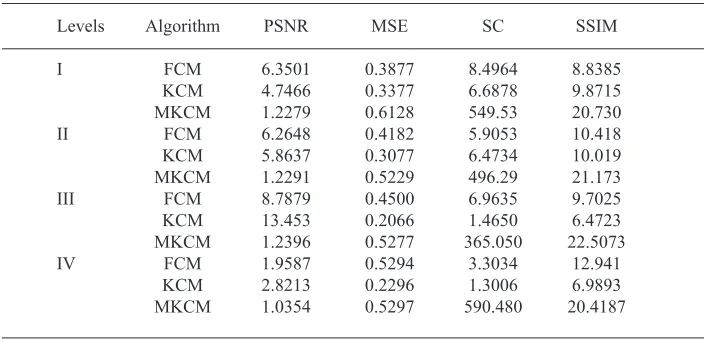
RESULT AND DISCUSSION
Table 1. Evaluation of Performance
Levels Algorithm PSNR MSE SC SSIM
I FCM 6.3501 0.3877 8.4964 8.8385
KCM 4.7466 0.3377 6.6878 9.8715 MKCM 1.2279 0.6128 549.53 20.730 II FCM 6.2648 0.4182 5.9053 10.418 KCM 5.8637 0.3077 6.4734 10.019 MKCM 1.2291 0.5229 496.29 21.173 III FCM 8.7879 0.4500 6.9635 9.7025 KCM 13.453 0.2066 1.4650 6.4723 MKCM 1.2396 0.5277 365.050 22.5073 IV FCM 1.9587 0.5294 3.3034 12.941
KCM 2.8213 0.2296 1.3006 6.9893 MKCM 1.0354 0.5297 590.480 20.4187 Structural Content (SC)
The value of Structural Content (SC) influences the quality of segmented images to a greater
extent and the metric is illustrated as
Here, in( i, j)2 belong to the input image and sag (i ,j)2 belong to the segmented image (target). Similarly m and n belong to row and columns in a matrix. Hence, the value of structural content (SC) is inversely proportional to the image quality.
Structural Similarity Index Measures (SSIM)
SSIM measures the image similarity on the basis of elements like structure, contrast and luminance. The structural similarity indexes (X and Y) were calculated using
SSIM reduces the complexity of computational iterations to increase the performance of assessment in improving the quality of image. In SSIM, the information of an image is defined as attributes that are represented as the structures of the object in visual scene and it’s irrespective of contrasts and mean intensity. SSIM provides a good quality image in prediction and its performance is compared with a wide variety of distortions from the image intensity. The maximum value of SSIM
is achieved only for the identical values of x and y.
Means Squared Error (MSE)
MSE is among many ways for quantifying the difference between the implied values of an approximate and the true quality. MSE is considered as a risk function and the value is taken as analogous to the expected value of the squared error. The MSE is also taken as the error in second moment for including the variance of the approximate value and its bias. For an image of m*n, the MSE can be calculated as
Here, I (i, j) belong to input image and K (i, j) belong to output image.
Note:
1. The value of MSE should always be less than the value of PSNR.
2. Lower the value of MSE of an image means less error and high quality of the image.
Peak Signal to Noise Ratio (PSNR)
PSNR can be explained by the analogues and deformity metric of Mean Square Error (MSE) with respect to the ratio of Peak Signal to Noise. Here Max refers to the value of maximum pixel in the image, where the pixel is represented as 8 bits per sample and the 255 image in bar color contain three values (RGB) per pixel.
Note:
1. If the value of PSNR is above 30, the output has image clarity of 100%.
2. The unit of PSNR is dB (decibel) and it takes value from 0 to .
CONCLUSION
In case of unsupervised method i.e. algorithms based on clustering were proposed for the segmentation of image. The techniques clustering such as fuzzy c mean and k means were tested with respect to different images. The performance of the proposed algorithms is measured using the parameters for segmentation and they were SC, SSIM, MSE, and PSNR. The computational results showed that the image segmentation by K means has a lesser accuracy in result. The algorithm k means takes a minimum numbers of iterations when compare to C means. The KCM algorithm consumes more time and provides good result but the FCM algorithm consume less time in comparison with k means and provide good result. Hence, on the basis of the computation, it can be concluded that the proposed algorithm i.e. “The modified k means” had a better performance than others with respect to the rate of accuracy and convergence.
REFERENCES
1. M.Masroor Ahmed, Dzulkifli Bin Mohamad, “Segmentation of Brain MR Images for Tumor and combining by k means clustering International Journal of Image Processing, 2008; 2(1), pp 27-34.
2. U.M. Fayyad, G. Piatetsky-Shapiro, P. Smyth, R. Uthurusamy, Advances in Knowledge Discovery and Data Mining,AAAI/MIT Press (1996). 3. M.N. Murty, A.K. Jain, P.J. Flynn, and Data
clustering: a review, ACM Computes. Survey, 1999; 31(3); 264-323.
4. A.K. Jain, R.C. Dubes, Algorithms for Clustering Data,Prentice Hall, Englewood Cliffs, NJ(1988). 5. R.T. Ng, J. Han, Efficient and effective clustering methods for spatial data mining, in: Proceedings of the Twentieth International Conference on Very Large Databases, Santiago, Chile; 1994; 144-155620.
6. Xiuyun Li, Jie Yang, Qing Wang, Jinjin Fan, Pang Liu,2010 Research and Application of Improved K-means Algorithm Based on Fuzzy Feature Selection.
7. Shehroz S. Khan, Amir Ahmad,Cluster center initialization algorithm for K-means clustering, Pattern Recognition Letters, 2004; 25; 1293-1302.
8. Bradley, P.S., Fayyad, U.M., Refining initial points for K Means clustering. In: Sharlik, J. (Ed.), Proc. 15th Internat. Conf. on Machine Learning (ICML98). Morgan Kaufmann, San Francisco, CA, 1998; 91-99 621.
9. J u d e h e m a n t h . D , D . S e l v a t h i a n d J.Anitha,”Effective Fuzzy Clustering Algorithm for abnormal MR Brain Image Segmentation”, International/Advance Computing Conference (IACC 2009), IEEE, 2009.