IJEDR1801088
International Journal of Engineering Development and Research (
www.ijedr.org
)
508
Enhancement of Voltage Stability in Power System
Using Voltage Stability Constraint – Optimal Power
Flow and Particle Swarm Optimization Algorithm
1
S.Punitha,
2V.Vijayakumar,
3X.Thomas Britto
1Assistant Professor, 2Assistant Professor, 3Assistant Professor 1Electrical and Electronics Engineering,
1N.S.N College of Engineering and Technology, Karur, India
_______________________________________________________________________________________________
Abstract - In power systems the voltage stability improvement is a worthwhile issue. The customers of power utilization have been increased day by day. Because of this the electrical equipment used in the generation, transmission and distribution are highly modified but all in this three factors the voltage stability is the important factor. Here this research developed a Voltage Stability Constraint – Optimal Power Flow (VSC-OPF) algorithm to improve the voltage stability and reduction in losses of system and another case done here is using PSO (Particle Swarm Optimization Algorithm) to find out the best voltage stability improvement. The standard IEEE 30 bus system has been used to evaluate the projected method. The simulation results demonstrates the effectiveness of the proposed VSC-OPF based on the line voltage stability index and the best voltage stability improvement by the means of PSO algorithm. The results are verified through coding using MATLAB SOFTWARE.
Index Terms - VSC-OPF (Voltage Stability Constraint – Optimal Power Flow Algorithm), voltage stability, VCPI (Voltage
Collapse Proximity Indicator), PSO (Particle Swarm Optimization Algorithm)
________________________________________________________________________________________________________
I. INTRODUCTION
In power system there are number of factors are important for the power transmitting, the factors are the voltage, current,
power factor, generating unit, transmitting capacitance, inductance, resistance, etc.,. Here this research is for the voltage stability in bus system is considered and the results are done to improve the voltage stability. Here the important factor used is the VCPI indicator. This indicator indicates the value between 0 and 1.0. 0- indicates the no load condition and 1.0 – indicates the voltage collapse condition. In literature survey many paper are consider as the reference. To maximise the voltage stability in deregulated system an optimal dispatch with VSC using the bifurcation technique was applied [3], and for reduction of the market cost for the reactive power, the system energy losses, and simultaneously increasing the voltage stability by decreasing the largest LSI (Lmn) of the network is referred[4], the FVSI and LQP are used as objective functions in the optimal location of the FACTS devices for reducing the system losses and the voltage stability raising [5], Voltage Collapse Proximity Indicator has more accuracy and robustness in predicting voltage collapse [6],when we comparing it with Voltage Collapse Proximity Indicator index it has some advantages namely its simple , fast to calculate , flexible for simulating any type of topological and load modifications in system and its application for real time simulation [7], L-index is used as objective function for voltage stability enhancement in both normal [8-11] and contingency conditions [12,13], the reactive power dispatch (ORPD) problem using ant colony optimization (ACO) algorithm [14] is also taken as reference for below voltage stability improvement process. The Voltage Collapse Proximity Indicator has great accurateness and robustness in identifying voltage collapse [15]. Also the VCPI index is simple, flexible for simulating any type of topological and load changing in network and real time simulation. This paper focused on calculating the base case load of each load bus and VCPI value of all load bus. If the load is increased in particular load bus beyond the maximum limit the voltage collapse occurred in the system. The VCPI indicator has two limit values such as (no load condition) and 1 (over load condition).This research consists of the following content the paper is organised with the following contents. The description of VCPI and formula for calculating the VCPI values are given in Section 2. The load flow analysis is explained in Section 3. The problem formulation with various constraints is shown in section 4. The conclusion and future progress in section 7.II. BASIC FORMULA USED
IJEDR1801088
International Journal of Engineering Development and Research (
www.ijedr.org
)
509
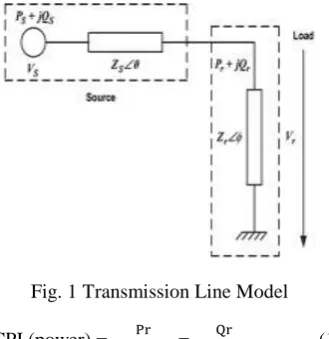
Fig. 1 Transmission Line Model VCPI (power) = Pr
Pr( max) = Qr
Qr (max) (1)
Formula for calculating Prmax and Qrmax are shown below
Pr( max) = Vs2*CosՓ/Zs*4cos2((θ-Փ)/2) (2) Qr(max) = Vs2*SinՓ/Zs*4Cos2((θ-Փ)/2) (3)
Prmax – Maximum Value of Active Power, Qrmax – Maximum value of Reactive power, Vs – is the sending end voltage, Zs – impedence of the line, θ – Angle of line Impedance, Փ = tan−1 Qr
Pr , Փ – Load impedance phase angle.
III. TEST CASE BUS SYSTEM
The IEEE-30 bus system represented in the Fig is used to verify and investigate the effectiveness and performance of proposed approach. The IEEE 30-bus system includes six generators at buses 1, 2, 5, 8, 11 and 13, four transformers at lines 6–9, 6–10, 4– 12 and 28–27, 21 loads and 41 transmission lines. The figure shows the singe line diagram of IEEE-30 bus system.
Fig.2 IEEE Standard Bus System IV. PROBLEM FORMULATION AND OBJECTIVE FUNCTIONS
The objective function subject to several inequality and equality constraints. Minf (x,u (4) Subject to
g(x,u) = 0 (5) h(x,u) ≤ 0 (6)
IJEDR1801088
International Journal of Engineering Development and Research (
www.ijedr.org
)
510
Objective Function a. Fuel Cost (FC)
The important intend is to reduce the fuel cost. The quadratic functions are used to model the generator cost curve can be expressed as
FC=∑𝑁𝑔𝑖=1 (ai+biPGi+ciP 2Gi)$/h (7)
FC – Total fuel cost , Ng – Number of generator buses, Pgi –Active power output of the ith generator and ai, bi, and ci –Fuel cost of ith generator.
b. Voltage Stability Improvement
The acceptable voltage stability level should be maintained under normal, stressed and contingency operating conditions is important in power system operation. For this condition the (VCPIT) is projected as the objective function to maximise the system total stability.
VCPIT is the addition of systems voltage stability indices of all lines it is determined by the expression, VCPIT =∑𝑁𝑖𝑖=1𝑉𝐶𝑃𝐼𝑖 (8)
VCPIi – VCPI for line i, Ni – number for transmission lines in the system. c. Conventional Constraints
There are two categories of constraints are consider in the OPF problem, they are defined between the equation (9-13), i. Equality constraints
PGi− PDi =Vi∑𝑁 𝑉𝑗(𝐺𝑖𝑗𝑐𝑜𝑠𝜃𝑖𝑗 + 𝐵𝑖𝑗𝑠𝑖𝑛𝜃𝑖𝑗)
𝑗=1 (9)
i=1,…..,N
QGi−QDi=V∑𝑁𝑗=1𝑉𝑗(𝐺𝑖𝑗𝑐𝑜𝑠𝜃𝑖𝑗 − 𝐵𝑖𝑗𝑠𝑖𝑛𝜃𝑖𝑗) Eq... (10)
i=1 ,….., N ii. Inequality constraint (consist of system operating and the security limits)
PGi(min) ≤ PGi ≤PGi(max), i=1,..,Ng Eq…….(11) QGi(min) ≤ QGi ≤QGi(max), i=1,..,Ng Eq…...(12) Vi(min) ≤Vi ≤ Vi(max), i=1,…,Ng Eq..…(13)
N-number of total buses in system, PGi –True power & QGi – Reactive power generation both of bus i, PDi –True power & QDi – Reactive power demand both of bus i, Gij – Transfer conductance & Bij – Susceptance both are between bus i and j, the phase angle difference between the voltage at i and j is - θij
d. Voltage Stability Constraint
The system is to be kept clear to voltage collapse condition and to reduce the highest L-index value are the main aim of new voltage stability constraint.
The voltage stability limit in addition is formed as
VCPImax ≤ VCPIlimit Eq…(14)
VCPIlimit - the system security level can be ensured by the desired threshold value VCPImax determines the index maximum value and it is given by
IJEDR1801088
International Journal of Engineering Development and Research (
www.ijedr.org
)
511
V. VOLTAGE STABILITY CONSTRAINT – OPTIMAL POWER FLOW , PARTICLE SWARM OPTIMIZATION EXECUTION AND FLOW CHART
a. Voltage Stability Constraint – Optimal Power Flow
The fmincon toolbox of MATLAB software is used to solve Voltage Stability Constraint – Optimal Power Flow approach.[17] The below flow chart shows the VSC-OPF algorithm
Fig.3 Flow chart of VSC-OPF Algorithm
Steps involved in solving VSC-OPF algorithm are explained below I. Analysis the given system data
IJEDR1801088
International Journal of Engineering Development and Research (
www.ijedr.org
)
512
III. Find VCPI values of all lines by the equation (1). And identify the line with the maximized VCPI index value.
IV. If the aim of the optimisation analysis is to limit the value of the VCPI index between the limit of 0 to VCPIlimit to attain a essential voltage stability limit and to learn the cause of the security voltage on generation cost, then the approach with the VCPI as the voltage constraint is completed as follows
a) Formulate the cost objective function(7)
b) Construct the conventional constraint given by (9)-(13) c) Construct the voltage stability constraint given by(14)
d) Calculate the first and the second derivatives of conventional constraint e) Calculate the first and the second derivatives of the voltage stability constraint f) Solve the optimisation algorithm by the line search method.
V. Main objective is to raise the overall voltage stability and the reduction of the system losses, then the VCPI is used as an objective function. OPF is derived as shown below
a) Formulate the voltage stability objective function (8) Calculate the conventional constraint given by (9) – (13) b) Calculate the derivative of the conventional constraints.
c) Solve the optimisation problem by the line search method
VI.The execution of the algorithm stops when the voltage stability condition has been achieved when the objective function and the control variable converge, if not repeated from step 3.
b. Particle Swarm Optimization
Particle swarm optimization (PSO) is a population based stochastic optimization technique. PSO imparts numerous similitudes to transformative computational procedures, for example, Genetic Algorithm (GA). The framework is instated with a populace of arbitrary arrangements and scans for ideal by refreshing ages. Notwithstanding, dissimilar to GA, PSO has no development administrators, for example, hybrid and transformation. In PSO, the potential solution called particles, fly through the problem space by following the current optimum particles. The detailed information will be given in following sections. The below figure shows the basic flow of the Particle swarm optimization (PSO) algorithm.
IJEDR1801088
International Journal of Engineering Development and Research (
www.ijedr.org
)
513
In this paper work the input of PSO algorithm is given from the (VSC-OPF) approach and the process goes on and the best voltage improved case is taken as the output. By using the Particle Swarm Optimization Algorithm, the best out by giving the input from the proximity indicator is obtained.
VI. OUTPUT AND DISCUSSION
To obtain the result the test bus system used in the proposed paper is IEEE-30 bus system. The IEEE-30 bus system consist of the following elements, Six generators at buses 1,2,5,8,11 and 13, four transformers at lines 6-9, 6-10, 4-12 and 28-27, 41 transmission lines and 21 loads.
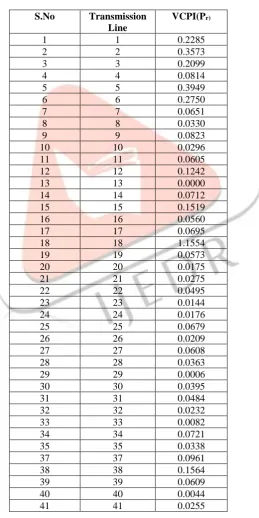
a) VCPI value for all the 41 transmission lines
By using the formula given in equation (1) – (3) the values of VCPI for 41 transmission lines are calculated. The table shows the output VCPI of all the transmission lines
Table 1 VCPI Value with Normal Load Flow S.No Transmission
Line
VCPI(Pr)
1 1 0.2285
2 2 0.3573
3 3 0.2099
4 4 0.0814
5 5 0.3949
6 6 0.2750
7 7 0.0651
8 8 0.0330
9 9 0.0823
10 10 0.0296
11 11 0.0605
12 12 0.1242
13 13 0.0000
14 14 0.0712
15 15 0.1519
16 16 0.0560
17 17 0.0695
18 18 1.1554
19 19 0.0573
20 20 0.0175
21 21 0.0275
22 22 0.0495
23 23 0.0144
24 24 0.0176
25 25 0.0679
26 26 0.0209
27 27 0.0608
28 28 0.0363
29 29 0.0006
30 30 0.0395
31 31 0.0484
32 32 0.0232
33 33 0.0082
34 34 0.0721
35 35 0.0338
37 37 0.0961
38 38 0.1564
39 39 0.0609
40 40 0.0044
IJEDR1801088
International Journal of Engineering Development and Research (
www.ijedr.org
)
514
b. IEEE 30 Bus System Voltage Stability Improvement Case Study
• Case 1: Cost function.
In this case, the minimisation of the fuel cost of generation is considered as an objective function. The generator cost coefficients for the IEEE 30-bus system are defined in result and discussion table.
• Case 2: Cost function with the voltage stability constraint
In this case, the VCPI is included as the voltage stability constraint in the OPF model. This will allow limiting the VCPI index of the most critical line in the system and then increasing the voltage stability margin of the system. Consequently, the optimal solution can satisfy the economic and the system security requirements simultaneously.
• Case 3: Total Sum of the VSI
From the system security point of view, an objective function which incorporates an improvement of the system voltage stability is found to be more efficient. As the VCPI index value indicates the proximity of the system to the voltage collapse, the minimisation of the sum of the voltage stability indices (VCPIT) is selected as an objective function, such that the overall system voltage stability is improved. Thus, the lower the value of the VCPIT, the better the voltage stability.
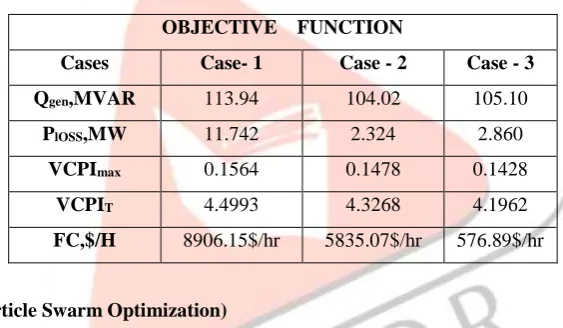
Table 2 Voltage Stability Improvement
OBJECTIVE FUNCTION
Cases Case- 1 Case - 2 Case - 3
Qgen,MVAR 113.94 104.02 105.10
PlOSS,MW 11.742 2.324 2.860
VCPImax 0.1564 0.1478 0.1428
VCPIT 4.4993 4.3268 4.1962
FC,$/H 8906.15$/hr 5835.07$/hr 576.89$/hr
c. Result of PSO (Particle Swarm Optimization)
Here we obtain the best voltage stability improvement between the bus system the input is given form the VCPI indicator and cases are tested through the coding the results are that the best voltage stability improvement in bus system 8. The results are shown in the below table 3.
Table 3 Best Voltage Stability Improvement in Bus System OBJECTIVE FUNCTION
Qgen,MVAR 105.08
PlOSS,MW 0.109
VCPImax 0.4365
FC,$/H 79.43 $/hr
GRAPHICAL OUTPUT
IEEE 30 BUS SYSTEM VOLTAGE STABILITY IMPROVEMENT
IJEDR1801088
International Journal of Engineering Development and Research (
www.ijedr.org
)
515
In this case, the minimisation of the fuel cost of generation is considered as an objective function. The generation cost coefficients and real power loss and VCPI values such as VCPItotal and VCPImax for the IEEE 30-bus system are defined in the table 6.5 of voltage stability improvement.
6.5.2 Cost function with the voltage stability constraint
In this case, the VCPI is included as the voltage stability constraint in the OPF model.The generation cost coefficients and real power loss and VCPI values such as VCPItotal and VCPImax for the IEEE 30-bus system are defined in the table 6.5 of voltage stability improvement.
6.5.3 Total Sum of the VSI
From the system security point of view, an objective function which incorporates an improvement of the system voltage stability is found to be more efficient. The generation cost coefficients and real power loss and VCPI values such as VCPItotal and VCPImax for the IEEE 30-bus system are defined in the table 6.5 of voltage stability improvement.
The graphical comparisons of the various values such as Qgen(MVAR),PlOSS,MW, VCPImax ,VCPIT are shown in below graphs these values are taken from the various there cases which are explained above
Fig.5 Graph for Output Comparison of Qgen(MVAR)
Fig.6 Graph for Output comparison of PlOSS,MW 95
100 105 110 115
Case - 1
Case - 2
Case - 3
Qgen,MVAR
Qgen,MVA R
0
10
20
Case - 1
Case - 2
Case - 3
PlOSS,MW
IJEDR1801088
International Journal of Engineering Development and Research (
www.ijedr.org
)
516
Fig.7 Graph for Output Comparison of VCPImax
Fig.8 Graph for Output Comparison of VCPIT VII. CONCLUSION AND FUTURE ENHANCEMENT
This study presents a novel Voltage Stability Constrained Optimal Power Flow (VSC-OPF)
approach based on static line voltage stability indices to simultaneously improve voltage stability and
minimize power system losses under stressed and contingency conditions. The proposed methodology uses
a Voltage Collapse Proximity Indicator (VCPI) to provide important information about the proximity of the
system to voltage instability. It can be concluded that VSC-OPF is the better solution in terms of improving
voltage stability and Voltage Collapse Proximity Indicator (VCPI) indicates the voltage collapse condition
when the load is increased in IEEE 30 bus system. The three case studies are done using VSC-OPF
algorithm and also the best voltage stability improved bus is find by using PSO algorithm. In future all the
case studies and voltage stability improvement is tested using the Genetic algorithm and also the same case
is tested for IEEE – 57 bus system.
REFERENCES
[1] IEEE/PES Power System Stability Subcommittee: ‘Voltage Stability Assessment: Concepts, Practices and Tools’, special publication, final draft, August 2003
[2] Yamashita, K., Sung-Kwan, J., Li, J., Pei, Z., Chen-Ching, L.: ‘Analysis, control, and economic impact assessment of major blackout events’,Eur. Trans. Electr. Power, 2008, 18, pp. 854–71
[3] Huang, H., Kong, Y., Zhang, J.: ‘The analysis on the L-index based optimal power flow considering voltage stability constraints’, WSEAS Trans. Syst., 2008, 7, pp. 1300–1309
0.135 0.14 0.145 0.15 0.155 0.16
Case - 1 Case - 2 Case - 3
VCPImax
VCPImax
4 4.1 4.2 4.3 4.4 4.5 4.6
Case - 1 Case - 2 Case - 3
VCPIT
IJEDR1801088
International Journal of Engineering Development and Research (
www.ijedr.org
)
517
[4] Bhattacharya, A., Chattopadhyay, P.K.: ‘Application of biogeographybased
optimisation to solve different optimal power flow problems’, IET Gener. Transm. Distrib., 2011, 5, pp. 70–80
[5] Kargarian, A., Raoofat, M., Mohammadi, M.: ‘Reactive power provision in electricity markets considering voltage stability and transmission congestion’, Electr. Power Compon. Syst., 2011, 39, pp. 1212–26
[6] Kumar, M.S., Renuga, P.: ‘Application of UPFC for enhancement of voltage profile and minimization of losses using fast voltage stability index (FVSI)’, Arch. Electr. Eng., 2012, 61, pp. 239–250
[7] Cupelli, M., Cardet, C.D., Monti, A.: ‘Comparison of line voltage stability indices using dynamic real time simulation’. Proc. 2012 Third IEEE PES Int. Conf. and Exhibition on Innovative Smart Grid Technologies (ISGT Europe), 2012, pp. 1–8 [8] Cupelli, M., Cardet, C.D., Monti, A.: ‘Voltage stability indices comparison on the IEEE-39 bus system using RTDS’. Proc.
2012 IEEE Int. Conf. on Power System Technology (POWERCON), Auckland, New Zealand, 2012, pp. 1–6
[9] Bhattacharya, A., Chattopadhyay, P.K.: ‘Application of biogeography based optimisation to solve different optimal power flow problems’, IET Gener. Transm. Distrib., 2011, 5, pp. 70–80
[10]Abido, M.A.: ‘Optimal power flow using particle swarm optimization’, Int. J. Electr. Power Energy Syst., 2002, 24, pp. 563– 571
[11]Niknam, T., Narimani, M.R., Aghaei, J., Azizipanah-Abarghooee, R.: ‘Improved particle swarm optimisation for multi-objective optimal power flow considering the cost, loss, emission and voltage stability index’, IET Gener. Transm. Distrib., 2012, 6, pp. 515–527
[12]Devaraj, D., Roselyn, J.P.: ‘Genetic algorithm based reactive power dispatch for voltage stability improvement’, Int. J. Electr. Power Energy Syst., 2010, 32, pp. 1151–1156
[13]Duman, S., Guvenc, U., Sonmez, Y., Yorukeren, N.: ‘Optimal power flow using gravitational search algorithm’, Energy Convers. Manage., 2012, 59, pp. 86–95
[14]Dai, C., Chen, W., Zhu, Y., Zhang, X.: ‘Reactive power dispatch considering voltage stability with seeker optimization algorithm’, Electr. Power Syst. Res., 2009, 79, pp. 1462–1471
[15]Reis, C., Barbosa, F.P.M.: ‘A comparison of voltage stability indices’ IEEE Mediterranean Electrotechnical Conf., MELECON 2006, 2006, pp. 1007–1010
[16]Lenoir, L., Kamwa, I., Dessaint, L.A.: ‘Overload alleviation with preventive-corrective static security using fuzzy logic’, IEEE Trans.Power Syst., 2009, 24, pp. 134–145
[17]Tarik Zabaiou, Louis-A Dessaint, Innocent Kamwa ‘Preventive control approach for voltage stability improvement using voltage stability constrained optimal power flow based on static line voltage stability indices’ IET Generation, Transmission & Distribution 14th November 2013
[18]Matlab Optimization Toolbox’, (R2011a), The MathWorks Inc., Natick, USA, 2011
[19]Power Systems Test Case Archive, University of Washington, available at:http://www.ee.washington.edu/research/pstca/ [20]Zimmerman, R.D., Murillo-Sánchez, C.: MATPOWER: A MATLAB power system simulation package, available at:
http://www.pserc. cornell.edu/matpower
[21]Lee, K.Y., Park, Y.M., Ortiz, J.L.: ‘A united approach to optimal real and reactive power dispatch’, IEEE Trans. Power Appl. Syst., 1985, PAS-104, pp. 1147–1153
[22]Sundararaju.K, Nirmal Kumar.A, Jeeva.S, Nandhakumar .A ‘Performance Analysis And Locatio Identification Of Statcom On IEEE-14 Bus System Using Power Flow Analysis’ Journal of Theoretical and Applied Information Technology 20th February 2014. Vol. 60 No.2