Development of Multi-model for Cogeneration
System Using Statistical Analysis
Jiao Chen
Changzhou College of Information Technology, Jiangsu, Changzhou 213164, China Email: [email protected]
Tianhong Pan, Yanqin Han
School of Electrical Information & Engineering, Jiangsu University, Zhenjiang, Jiangsu 212013, China Email: [email protected], [email protected]
Abstract—Cogeneration system is a nonlinear multivariate
system with a wide operating regime. The efficiency of electricity generating and thermoelectric conversion coefficient of turbine generator are affected by many factors such as load variation, extracted steam change, and unstable supplied power etc. In this paper, a kind of identification algorithm has been proposed to build the statistical model of generating efficiency. Firstly, key variables are selected by using stepwise regression method. Then, statistical models are built in different operating regimes. The experimental results demonstrate the performance of the presented algorithm. The field engineer can take the developed model as a reference and determine the operating operation of cogeneration system. As a result, the performance of turbine generator is improved and the operating cost is reduced.
Index Terms—cogeneration system, statistical analysis,
stepwise regression, turbine generator
I. INTRODUCTION
The greenhouse effect has being received international attention. Scientists, environmentalists, and governments around the world have being interest in the subject. One of the important strategies to reduce the greenhouse gas emission is to improve the energy utilizing efficiency of system. Before designing the improving strategy, the first thing is needed to identify the model of industrial system. In this paper, a cogeneration system is taken as an example to demonstrate the proposed identification method.
Cogeneration system is an indispensable component of chemical industrial plants, which can generate heat and power at the same time. Therefore, the cogeneration system is widely used in the larger communities and energy-intensive industries.
In order to improve the energy utilization efficiency of cogeneration system, many strategies are proposed, such as adding some aids, improving the thermal performance of cooling tower, replacing the filling materials in cooling tower, and increasing the heat exchange coefficient etc.
[1-5]. Although these methods can improve the system's performance, the cost is high and the normal operation should be broken up. So, it is difficult to implement those strategies in the existing factories.
In practice, some operating conditions are not optimal in the current plants. The improvement of operating mode is also a solution to increase the performance of system. However, the first thing is to build the model before improving energy utilization efficiency. The first principal model based on mass and energy balance is too complicated and difficult to be analyzed and understood the relationship between the different variables of the cogeneration system. Furthermore, some parameters in first principal model are not measured, or the cost of measurement is very high. Therefore, a new method is proposed in this paper. With the help of statistics analysis and data mining methods, a multi-model is identified from input and output data collected from the distributed control system (DCS). Then, the energy optimized strategy can be obtained using the multi-model.
II. COGENERATION SYSTEM DESCRIPTION
In order to demonstrate the proposed method, a cogeneration system is taken as an example (shown in Figure 1) [6]. The cogeneration system includes a cooling tower (CT), two turbine generators (TG6 and TG7), a condenser (CD), and two low pressure heat exchangers (LP1 and LP2). Furthermore, six Fans installed in the top of CT are used to cool the cooling water, and the CT can supply fixed 2.1x10⁷kg/hr volume of cooling water (CW). The CW enters the condenser, which can improve the vacuum of condenser and increases the efficiency of power generation.
First, steam with high temperature and high pressure is generated from the boiler. Then, the steam is introduced into the turbine generators (TG6 and TG7) through the pipe. The TG6/TG7 uses the thermal of steam to generate the power. After that, some of the steam directly go through the low-pressure LP1 and LP2 and reach the boiler to recycle again. The other is cooled by the condenser and becomes the feed water. The condenser uses the pressure difference of steam to generate the
Manuscript received March 25, 2014; revised June 25, 2014; accepted July 1, 2014.
power. Finally, the feed water also enters to the boiler via the two low-pressure LP1 and LP2.
Although the TG6/TG7, CD and CT are independent components, they are really connected each other. The cooler the CW, the higher the vacuum of CD, the more power generation of the TG6/TG7. But, the temperature of CW is cooled by the Fans which are installed in the top of CT. The Fans draw air into CT from top to bottom, and make air and CW exchange the thermal energy. The cooler the CW, the more air volume. It means that we
need more power consumption to cool the CW and get more power generation [6, 7]. So, there is dilemma to determine the number and velocity of Fans.
Before finding the optimal balance between the power generation of TG6/TG7 and power consumption of Fans, the first thing is to find the relationship among different parts in cogeneration system. So, how to identify the model of cogeneration system is a key issue. In this paper, a multi-method using statistical analysis is proposed to achieve this goal.
III. RESEARCH METHODS
A. Machinism Analysis
Through the thermal energy cycle, the efficiency of TG can be easily denoted as:
1 1 2 2,
TG
m m LP LP cout
aP
m H m H m H
η =
− − (1)
where, a=3600 /kJ kW hr⋅ is transfer constant.
m m m
H =P T , H1=PT1 1, HLP2,cout =PLP2,coutTLP2,cout.
As described before, the efficiency of TG is directly affected by the vacuum of condenser. Moreover, the vacuum is dominated by the temperature of CW. In order to analysis the efficiency, the relationship between TG and CW should be rebuilt. As shown in Figure 1, the heat exchange takes place among the LP-2, LP-1 and condenser. So, the enthalpy of feed water (mLP2HLP2,cout) can be denoted as:
2 2, 2 2 3 3
, , ,
( )
LP LP cout last last
CD p w CD out CD in
m H m H m H m H
m C T T
= + +
− − (2)
where,H2 =P T2 2,H3=P T3 3 and Hlast =P Tlast last.
Substituting Eq.2 into Eq.1, the efficiency can be rewritten as:
(
)
1 1 2 2 3 3
, , ,
/
( )
TG m m
last last CD p w CD out CD in
aW m H m H m H m H
m H m C T T
η= − − −
− + − (3)
Also, Eq.3 can be simplified as:
1 1 1 2 2
2 3 3 3 last CD 2,
2, , , ,
( , , , , , , , , ,
, , , , , , , , ,
, , , )
TG m m m
last last LP f
LP f p w CD out CD in
f W m P T m P T m P
T m P T m P T m P
T C T T
η=
(4)
where Pm , P1 , P2 , P3, Plast and PLP2,f are the main steam pressure, the steam pressure in the first stage, the steam pressure in the second stage, the steam pressure in the third stage, the steam pressure in the last stage and the steam pressure in the outlet of LP2. Tm, T1, T2, T3, Tlast and TLP2,f are the main steam temperature, the steam temperature in the first stage, the steam temperature in the second stage, the steam temperature in the third stage, the steam temperature in the last stage and the steam temperature in the outlet of LP2. m1, m2, m3, mlast and
TG
CT
LP2
LP1
Condenser
TG7
system
From BoilerTo Deaerator
Ambient air
To Boiler
m
m,P
m,T
mm
1,P
1,T
1m
2,P
2,T
2m
3,P
3,T
3m
2+m
3T
LP2,fm
fT
LP2,hT
LP1,fT
LP1,hT
CD,fm
lastT
lastP
lastm
CDT
CD,outm
CD,T
CD,inm
cw,outT
cw,outAmbient air
m
airT
Dair,inH
inH
air,inm
cw,inT
cw,inm
airT
Dair,outH
outH
air,outm
cw,inT
cw,inT
G
LP2
LP1
Condenser
From Boiler
To Deaerator
To Boiler
m
m,P
m,T
mm
1,P
1,T
1m
2,P
2,T
2m
3,P
3,T
3m
2+m
3T
LP2,fm
fT
LP2,hT
LPP1,fT
LP1,hT
CDD,fm
lastT
lastP
lastm
CDT
CD,outm
CD,T
CDm
cwT
cw,TG6 system
CD
m are the extraction volume of steam in the first stage, the extraction volume of steam in the second stage, the extraction volume of steam in the third stage, the CW flow rate in the entrance of the CD (kg h/ ). Cp w, is the specific thermal coefficient at the constant pressure (kJ/ (kg⋅℃)). TCD out, and TCD in, are the temperature of CW at the inlet and outlet of CT (℃). f( )⋅ is a unknown
nonlinear function.
In short, the power generation efficiency can be formulated as a function of 22 variables. Unfortunately, some variables are correlated each other, some variables are redundant. Furthermore, it is difficult to build a
statistical model when the dimension of variables increases. So, it is necessary to screen the variables and reduce the dimension before modelling of cogeneration system.
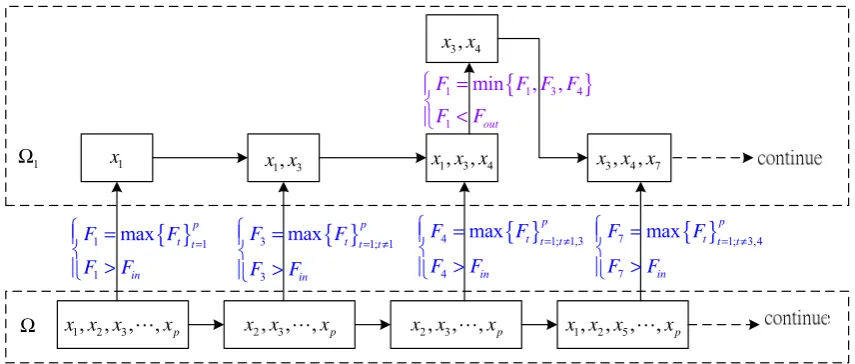
B. Stepwise Regression
In order to get the key variables, stepwise regression is used in this paper. The stepwise regression can select the key variables based on their explanation ability [8, 9]. The procedure is shown in Figure 2. Here, Ω is the original variable set, Ω1 is the selected key variables set,
1, , ,2 p
x x " x are all original variables
The procedure iteratively constructs a sequence of regression models by adding or removing variables at each step. The criterion for adding or removing a variable at any step is usually expressed in terms of a partial F value. Let Fin be the value of variable for adding a
variable to the model, and let Fout be the value of variable
for removing a variable from the model. The requirement of Fin>Fout ensures that inserting a variable is more
difficult than removing one (usually, Fin=4.00, Fout=3.99)
[10]. Firstly, the forward selection step is used to select a candidate variable. Then, the backward elimination step is used to check the existing variables. If the F-values of variables are less than the Fout, the variable with the
minimum F-value is excluded from the model. Or else, the forward step is continued. The loop will stop until there are no variables entering the model and no variables removing from the model.
C. Impact Factors for Power Generation Efficiency DeVilliers presented the optimal operation between turbine generator and cooling tower using the relationship among the heat rate of turbine, vacuum pressure of condenser, and the operated mode of cooling tower [11]. The relationship graph among the heat rate, power generation and vacuum pressure was also proposed.
Based on the graph, the some conclusions were summarized as follows:
(1) The heat rate dropped with the power generation increasing;
(2) Under the high load, the power generation efficiency improvement was limited with the vacuum pressure increased;
(3) Under the low load, the power generation efficiency was significantly affected by the vacuum pressure.
Figure 3 demonstrates the variation of the power generation efficiency under the different loads (low load: the extraction volume of steam in the first stage
1 135 /
m < T H ; high load: the extraction volume of steam in the first stage m1≥135 /T H ). We can conclude
that:
(1) Under the low load, although the vacuum pressure is manipulated in a small range, the influence of vacuum pressure on the power generation efficiency is also revealed.
(2) Under the high load, the power generation efficiency improvement is limited with the load increased. The reason is that the vacuum pressure of condenser is high enough.
1, , , ,2 3 p
x x x " x x x2, , ,3" xp 1
x x x1, 3
2, , ,3 p
x x " x
1, ,3 4
x x x
1, , , ,2 5 p
x x x " x
3, 4
x x
{ }
1 1
1
max p
t t
in
F F
F F
= ⎧ =
⎪ ⎨
>
⎪⎩
{ }
3 1; 1
3
max p
t t t
in
F F
F F
= ≠ ⎧ =
⎪ ⎨
>
⎪⎩
{ }
4 1; 1,3
4
max p
t t t
in
F F
F F
= ≠ ⎧ =
⎪ ⎨
>
⎪⎩
{
}
1 1 3 4
1
min , ,
out
F F F F
F F
=
⎧⎪ ⎨
<
⎪⎩
3, ,4 7
x x x
{ }
7 1; 3,4
7
max p
t t t
in
F F
F F
= ≠ ⎧ =
⎪ ⎨
>
⎪⎩
Ω 1 Ω
So, the vacuum pressure of condenser is a key variable in cogeneration system. If we have ability to adjust the vacuum pressure, the power generation efficiency will be improved.
In practice, the vacuum pressure of condenser is manipulated by temperature of the cooling water. The cooling water becomes warm after absorbing heat in a condenser via circulation; and then it becomes cold after releasing heat in a CT. The colder cooling water enters the condenser, the higher degree of vacuum is achieved
So, inlet temperature of cooling water (TCD in, ) is one of the major variables to determine thermal efficiency η of TG and should be fixed in the statistical model.
D. Other Factors
The stepwise regression is a kind of linear regression algorithm. So, the numerical range and distribution of variables can affect the result of key variables selection. Taking the data in February (2/2 ~ 3/2) for example, the distribution of main steam extraction volume (m1) in the first stage shows two parts (shown in Figure 4). That is means: the data of TG6 should be divided into two parts, i.e. m1,TG6<10 /T hrand m1,TG6 ≥10 /T hr, and the data
of TG7 should be divided into m1,TG7<60 /T hr ,
1,TG7 60 /
m ≥ T hr, also.
On the other hand, the power output of turbine generator is the key variable for energy distribution of power plant. But it is not simply linear relationship between the power output and efficiency. This relationship is shown in Figure 5.
Taking the partitioned data of m1,TG6 <10 /T hr for example, ηTG6 can be described by a quadratic polynomial of WTG6:
2
6 0.7822 6 18.2781 6 0.0106
TG WTG WTG
η = + − (5)
In other words, the square item 2 6 TG
W must be regarded as a candidate for the stepwise regression. It is the same with other three cases.
(a) The relationship between power generation efficiency and extraction volume of steam
(b) The relationship between vacuum pressure and extraction volume of steam
Figure 3 Relationship graph among three key variables
0 10 20 30 40 50 60 70 80 90 100 0
0.5 1 1.5
2x 10
4
m1,TG6 = 10
m1,TG6 (T/hr)
F
re
quenc
y
0 10 20 30 40 50 60 70 80 90 100 0
0.5 1 1.5
2x 10
4
m1,TG7 = 60
m 1,TG7 (T/hr)
F
requ
enc
y
Figure 4 m1 Histogram of TG6 and TG7 in February
10 20 30 40 50 60 70
20 22 24 26 28 30 32 34 36 38 40
η
(%
)
WTG (MW)
y = -0.0106 + 0.7822x2 + 18.2781x R2=88.44%
(a) m1st <10 T/hr
10 20 30 40 50 60 70
20 22 24 26 28 30 32 34 36 38 40
η
(%
)
WTG (MW)
y = -0.0046 + 0.476x2 + 23.9699x R2=71.03%
(b) m1st≥10 T/hr
E. Key Variables Selection
Table 1 shows the selected key variables of TG6 when the extraction steam volume in the first stage is less than 10T/hr. In Step 1, the statistical index R2, which represents the explanation ability, can reach 97.43% when the TLP1,f enters the model. MSE(mean square error) in validation set is 0.1338. If the mLP2 is selected, the
explanation ability R2 only increases 0.97%. So, mLP2
need not be included. As a result, the key variables of
TG6 are WTG, TCD,in, TLP1,f when the extraction steam
volume in the first stage is less than 10T/hr (m1<10T/hr).
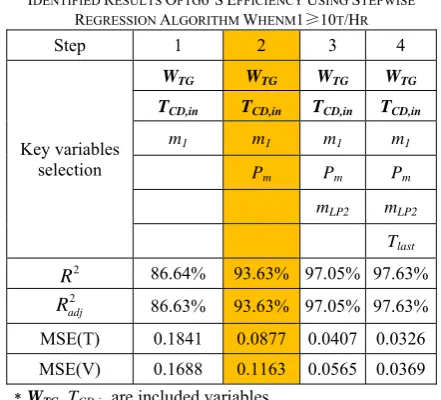
Using the stepwise regression, the result of variables selection is shown in Table 2 when the extraction steam volume in the first stage is greater than 10T/hr (m1≥10T/hr). In this case, the key variables are WTG,
TCD,in, m1, Pm.
So, the multi-model of power generation efficiency of TG6 is formulated as:
2
0 1 6 2 6 3 ,
1
4 ,
6 2
0 1 6 2 6 3 ,
1
4 1 5
10 =
10
TG TG CD in
LP f TG
TG TG CD in
m
W W T
if m T
E W T
if m
m P
β β β β
β η
β β β β
β β
⎧ + + +
<
⎪
+
⎪ ⎨
+ + +
⎪ ≥
⎪ + +
⎩
(6)
Similarly, the operating regime of TG7 can be divided into two parts and the cut point is m1=60T/hr. Using the
stepwise regression, the key variables are {WTG, TCD,in, m1,
Pm} and {WTG, TCD,in, m1, Pm, mLP2} in the two operating
regmies, respectively.
TABLE I.
IDENTIFIED RESULTS OF TG6’SEFFICIENCY USING STEPWISE
REGRESSION WHEN M1<10T/HR
Step 1 2 3 4
Key variables selection
WTG WTG WTG WTG
TCD,in TCD,in TCD,in TCD,in
TLP1,f TLP1,f TLP1,f TLP1,f
mLP2 mLP2 mLP2
Pm Pm
P1st 2
R (%) 97.43 98.40 99.04 99.35
2 adj
R (%) 97.43 98.40 99.04 99.35
MSE(T) 0.1586 0.0985 0.0594 0.0399
MSE(V) 0.1338 0.1081 0.0783 0.0829
*WTG, TCD,in are included variables
T: training data V: validated data
TABLE.2
IDENTIFIED RESULTS OFTG6’SEFFICIENCY USING STEPWISE
REGRESSION ALGORITHM WHENM1≥10T/HR
Step 1 2 3 4
Key variables selection
WTG WTG WTG WTG
TCD,in TCD,in TCD,in TCD,in
m1 m1 m1 m1
Pm Pm Pm
mLP2 mLP2
Tlast 2
R 86.64% 93.63% 97.05% 97.63% 2
adj
R 86.63% 93.63% 97.05% 97.63% MSE(T) 0.1841 0.0877 0.0407 0.0326 MSE(V) 0.1688 0.1163 0.0565 0.0369
*WTG, TCD,in are included variables
10 20 30 40 50 60 70 30
32 34 36 38 40 42 44 46 48 50
η
(%
)
W
TG (MW)
y = -0.0048 + 0.4713x2 + 25.2483x R2=39.30%
(a) m1st <60 T/hr
10 20 30 40 50 60 70
30 32 34 36 38 40 42 44 46 48 50
η
(%
)
W
TG (MW)
y = 0.0044 - 0.3268x2 + 45.5766x R2=1.71%
(b) m1st≥60 T/hr
Figure 6. Relationship between efficiency and power output of TG7
TABLE 3.
IDENTIFIED RESULTS OF TG7’SEFFICIENCY USING STEPWISE
REGRESSION WHEN M1<60T/HR
Step 1 2 3 4
Key variable selection
Gen Gen Gen Gen
TCD,in TCD,in TCD,in TCD,in
m1 m1 m1 m1
Pm Pm Pm
mLP2 mLP2
Tlast 2
R (%) 86.64 93.63 97.05 97.63
2 adj
R (%) 86.63 93.63 97.05 97.63
MSE(T) 0.1841 0.0877 0.0407 0.0326
So, the multi-model of power generation efficiency of TG7 is formulated as:
2
0 1 7 2 7 3 ,
1
4 1 5
7 2
0 1 7 2 7 3 ,
1
4 1 5 6 2
60
=
60
TG TG CD in
m TG
TG TG CD in
m LP
W W T
if m
m P
W W T
if m
m P m
β β β β
β β
η
β β β β
β β β
⎧ + + +
<
⎪
+ +
⎪ ⎨
+ + +
⎪ ≥
⎪ + + +
⎩
(7)
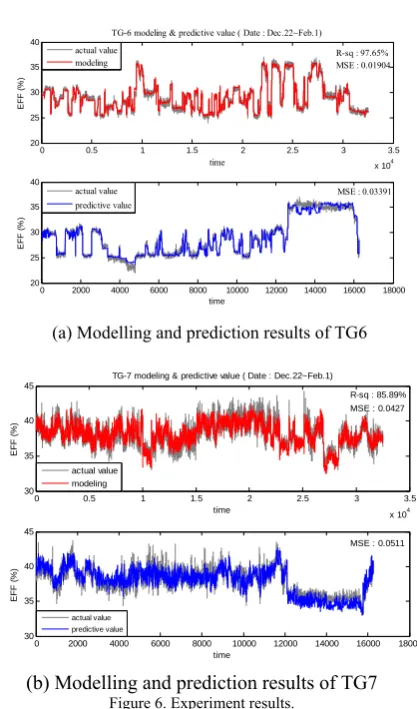
IV. EXPERIMENTS
To validate the proposed algorithm, data covered December 22 to February 1 was selected from the DCS. Two-third was used as training data, and one-third was taken as validated data. The results were shown in Figure 4 (a) and (b).
By using the stepwise regression and multi-model in different operating regimes, the results in training set were R2=97.65%, MSE=0.01904 and R2=85.89%, MSE=0.0427 respectively. The performance in validated data were MSE=0.0339 and MSE=0.0511. The validation results for one year were depicted in Table 5. It can be seen that the developed statistical models have high predicitive accuracy and can be used to describle the the power genration efficiecy of turbine-generator. Of couse, the models also can be used to adjust the vacuum pressure in CD and gain the optimum power generation.
0 0.5 1 1.5 2 2.5 3 3.5
x 104 20
25 30 35 40
EF
F
(
%
)
time
TG-6 modeling & predictive value ( Date : Dec.22~Feb.1) R-sq : 97.65% MSE : 0.01904 actual value
modeling
0 2000 4000 6000 8000 10000 12000 14000 16000 18000 20
25 30 35 40
EF
F
(
%
)
time
MSE : 0.03391 actual value
predictive value
(a) Modelling and prediction results of TG6
TABLE 5.
PERFORMANCE OF THE PROPOSED METHOD
Date TG6 TG7
February 0.0232 0.0333
March 0.0165 0.0333
April 0.0157 0.0339
May 0.0358 0.0481
June 0.0304 0.0424
July 0.0336 0.0511
August 0.0297 0.0544
September 0.0311 0.0335
October 0.0232 0.0423
November 0.0165 0.0304
December 0.0157 0.0307
TABLE 4.
IDENTIFIED RESULTS OF TG7’SEFFICIENCY USING STEPWISE
REGRESSION WHEN M1≥60T/HR
Step 1 2 3 4
Key variable selection
Gen Gen Gen Gen
TCD,in TCD,in TCD,in TCD,in
m1 m1 m1 m1
Pm Pm Pm
mLP2 mLP2 Tlast 2
R 67.33% 81.58% 86.55 % 87.54%
2 adj
R 67.32% 81.57% 86.55% 87.53%
MSE(T) 0.4243 0.2392 0.1746 0.1618 MSE(V) 0.5335 0.3157 0.2051 0.1837
0 0.5 1 1.5 2 2.5 3 3.5
x 104 30
35 40 45
E
FF (
%
)
time
TG-7 modeling & predictive value ( Date : Dec.22~Feb.1)
R-sq : 85.89%
MSE : 0.0427
actual value modeling
0 2000 4000 6000 8000 10000 12000 14000 16000 18000
30 35 40 45
EFF
(
%
)
time
MSE : 0.0511
actual value predictive value
(b) Modelling and prediction results of TG7
V. CONCLUSION
Based on the mass balance and energy balance, the variables which affect the power generation efficiency were formulated. Then, the stepwise regression was presented to select the key variables from the original variables set and reduce the redundant variables. Finally, the multi-model of TG6/TG7 was identified in different operating regimes. Experiment data demonstrated the validation of proposed statistical model and confirmed the performance of the proposed method.
ACKNOWLEDGMENT
This research is supported by National Natural Science Foundation (NNSF) of China under Grant 61273142, Natural Science Foundation of Jiangsu under Grant BK2011466, Foundation for Six Talents by Jiangsu Province and Priority Academic Program Development of Jiangsu Higher Education Institutions (PAPD)
REFERENCES
[1] Z.Y. Huang, R.M. Edwards. “Power generation efficiency improvement through auxiliary system modifications,” IEEE Transactions on Energy Conversion, Vol.18, No.4, 525–529, 2003.
[2] C.C. Chuang, D.C. Sue. “Performance effects of combined cycle power plant with variable condenser pressure and loading,” Energy, Vol.30, No.10, 1793–1801, 2005. [3] H.B. Zhao, L. Cao. “Study on the optimal back-pressure of
direct air-cooled condenser in theory,” In: Proceeding of the Asia-Pacific Conference on Power Energy Engineering, Wuhan, China, 27-31 March, 2009.
[4] F.W. Yu, K.T. Chan. “Optimizing Condenser Fan Control For Air-Cooled Centrifugal Chillers,” International Journal of Thermal Science, Vol.47, No.7, 942–953, 2008.
[5] H.R. Goshayshi, J.F. Missenden. “The investigation of cooling tower packing in various arrangements,” Applied Thermal Engineering, Vol.20, 2000, No.1, 69-80.
[6] T.H. Pan, S.S. Shieh, S.S. Jang, C.W .Wu, J.J. Ou. “Electricity gain via integrated operation of turbine generator and cooling tower using local model network”. IEEE Transactions on Energy Conversion, Vol.26, No.1, 245-255, 2011.
[7] D.L. Xu “Statistical modeling and inferential control of cogeneration system,” Mater Dissertation of Jiangsu University, Jiangsu, Zhenjiang, 2013.
[8] D.C. Montgomery, E.A. Peck, G.G. Vining. “Introduction to linear regression analysis. (3rd edition),” John Wiley & Sons, New York, 2001.
[9] X.D. Zhao, J.F. Lu, H. Zhang “Process data analysis system based on data warehouse in iron & steel enterprise,” Information and Control, Vo.39, 2010, No.2, 112-116.
[10] Heather J. Cordell, H. J., D. G. Clayton. “A unified stepwise regression procedure for evaluating the relative effects of polymorphisms within a gene using case/control or family data: application to HLA in Type 1 Diabetes,” AJHG, Vol.70, 2002, No.1, 124-141.
[11] DeVilliers A., Bosman P. “Optimizing turbine cycle heat rate against cooling tower operations”, Proceedings of the American Power Conference, vol. 61-2, pp.856-861, 1999.
Jiao Chen is an assistant professor in
Changzhou College of Information Technology, Jiangsu, China. Her current research interests include energy conversion, power synthetical assessment, statistical analysis and its application, fault detection and classification etc.
Tianhong Pan received his B.S. degree
from Anhui Agriculture University and M.S. degree from Gansu University of Technology in 1997 and 2000 respectively. And he received his Ph.D. degree in control theory and control engineering from Shanghai Jiao Tong University in 2007. Now he has been a professor in School of Electrical and Information Engineering, JiangSu University, Zhenjiang, China.
His current research interests include multiple model approach and its application, machine learning, virtual metrology, predictive control and Run-to-Run control theory and practice, etc.
Yanqin Han is a master student in