P Pattanaik et al. Volume 3 (2), Suppl. 2015, Page-22-26
CODEN (USA)-IJPRUR,e-ISSN: 2348-6465
Original Article
UPLC Method Development and Validation for Terconazole
in Active Ingredient
Pritosh pattanaik1, *, K V Subrahmanyam2, Harekrishna Roy3
1
Jawaharlal Nehru Technological University Hyderabad Kukatpally, Hyderabad- 500 085, Telangana, India.
2
Samskruti college of pharmacy, Ghatkesar, Hyderabad, Telangana, India.
3
Pratishta Institute of Pharmaceutical Sciences, Durajpally, India
A R T I C L E I N F O A B S T R A C T
_______________________________________________________________________________
1. INTRODUCTION
Quantitative chemical analysis1, 2 is an important tool to assure that the raw material used and the intermediate products meet the required specifications. Drug analysis is the base for the determination of the product. Every year numbers of drugs are introduced into the market. Also quality is important in every product or service, but it is of more importance in
International Journal of Pharma Research and Health Sciences
Available online atwww.pharmahealthsciences.net
Received: 08 Apr 2015
Accepted: 26 May 2015 The objective of the study was to develop UPLC method for the determination ofpurity of Terconazole in API and its validation. Ultra performance liquid chromatoghaphy is a better technique than HPLC in terms of performance and speed, so it was selected. The method was developed using Acetonitrile and Sodium dihydrogen ortho phosphate and Acquity BEH C18 (50×2.1mm, 1.7μ) as a stationary phase at a flow rate of 0.25ml/min. Validation was done by linearity, precision, and robustness studies. The precision was found to be within the limits. The linearity studies indicated the drug obeys Beer’s law and revealed the specified range of linearity for drug was between 80μg/ml and 120μg/ml. The robustness was observed from the insignificant variation in the analysis by changes in flow rate, mobile phase ratio, wavelength, column oven temperature and pH. Forced Degradation study revealed the drug degraded initially by the fluence of acid, alkali, and peroxide. Solution stability study showed the drug was not stable for more than 2 h at 25˚C but stable at 5˚C.
Key words:Terconazole , Antifungal activity, Acquity BEH C 18, method
development and validation
Corresponding author *
Pritosh Pattanaik
External Ph.D , Research Scholar, JNTUH , Hyderabad , Telengana , India, E-mail- [email protected]:
medicine as it involves life. The results of typical quantitative analysis can be computed from two measurements. One is the mass or volume of sample to be analyzed and second is the measurement of some quantity that is proportional to the amount of analyte in that sample and normally completes the analysis. In analytical chemistry 3, it is of prime importance to gain information about the qualitative and quantitative composition of substances and chemical species, that is, to find out what a substance is composed of and exactly how much.
In qualitative analysis, information regarding the presence or absence of one or more compounds of the same suffices. In quantitative analysis, quantity of the substance can be measured. In instrumental analysis, a physical property of a substance is measured to determine its chemical composition. Modern analytical chemistry is classified based on different principles, but most frequently they are divided into two large classes.4, 5
2. MATERIALS AND METHOD
Method Development
UPLC Instrumentation & Conditions:
The UPLC system employed was HITACHI L2130 with D Elite 2000 Software with Isocratic with UV-Visible Detector (L-2400), 25 mg of Terconazole standard was transferred into 25 ml volumetric flask, dissolved & make up to volume with mobile phase. Further dilution was done by transferring 0.2 ml of the above solution into a 10ml volumetric flask and make up to volume with mobile phase.
The standard & sample stock solutions were
prepared separately by dissolving standard & sample in a solvent in mobile phase diluting with the same solvent.(After optimization of all conditions) for UV analysis. It scanned in the UV spectrum in the range of 200 to 400nm. This has been performed to know the maxima of Terconazole, so that the same wave number can be utilized in UPLC UV detector for estimating the
Terconazole. While scanning the Terconazole solution we observed the maxima at 236 nm.
MOBILE PHASE PREPARATION
The mobile phase used in this analysis consists of a mixture of Buffer (triethylamine & pH adjusted to 2.5 with glacial acetic acid) and Acetronitrile in a ratio of 75 : 25. 250 ml of this buffer solution was added and properly mixed with 750 ml of acetronitrile and a homogenous solution is achieved. This mobile phase was filled and sonicated for 15 minutes before using in the experiment
Sample & Standard Preparation For The Analysis
25 mg of Terconazole standard was transferred into 25 ml volumetric flask, dissolved & make up to volume with mobile phase.
Further dilution was done by transferring 0.2 ml of the above solution into a 10ml volumetric flask and make up to volume with mobile phase.6-8
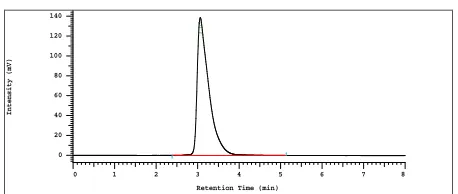
The sample was analysed by UPLC by using the above method and a very nicely resolved peak has been obtained at a Retention Time of about 4.39 min. The respective chromatogram is attached in the following page.
3.07
0 1 2 3 4 5 6 7 8
Retention Time (min) 0
20 40 60 80 100 120 140
Intensity
(
mV
)
Fig 1: UPLC spectrum of Terconazole (20 ppm) in optimized conditions (RT 3.07 min.)
Peak results
Sr no Name RT Area
1 Terconazole 3.07 3046971
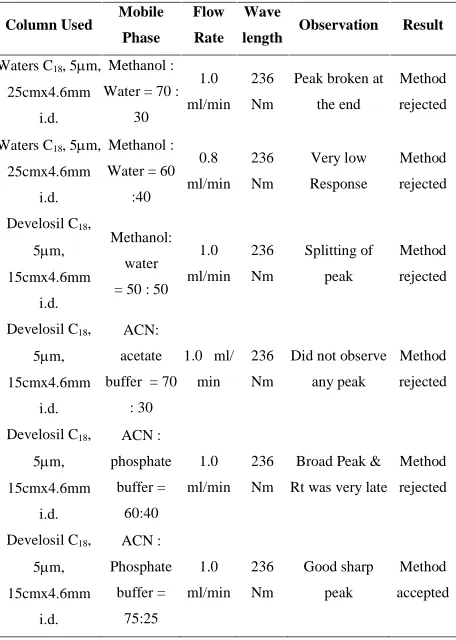
Optimization of chromatographic conditions:
P Pattanaik et al. Volume 3 (2), Suppl. 2015, Page-22-26
Table 1: Summary of Process Optimization
Column Used Mobile Phase
Flow Rate
Wave
length Observation Result
Waters C18, 5m,
25cmx4.6mm i.d.
Methanol : Water = 70 :
30
1.0 ml/min
236 Nm
Peak broken at the end
Method rejected
Waters C18, 5m,
25cmx4.6mm i.d.
Methanol : Water = 60
:40 0.8 ml/min 236 Nm Very low Response Method rejected
Develosil C18,
5m, 15cmx4.6mm
i.d.
Methanol: water = 50 : 50
1.0 ml/min 236 Nm Splitting of peak Method rejected
Develosil C18,
5m, 15cmx4.6mm
i.d.
ACN: acetate buffer = 70
: 30
1.0 ml/ min
236 Nm
Did not observe any peak
Method rejected
Develosil C18,
5m, 15cmx4.6mm i.d. ACN : phosphate buffer = 60:40 1.0 ml/min 236 Nm
Broad Peak & Rt was very late
Method rejected
Develosil C18,
5m, 15cmx4.6mm i.d. ACN : Phosphate buffer = 75:25 1.0 ml/min 236 Nm Good sharp peak Method accepted 2.83
0 1 2 3 4 5 6 7 8
Retention Time (min) -0.8 -0.6 -0.4 -0.2 0.0 Intensity ( mV )
Fig 2 : Chromatogram for Blank
3.05
0 1 2 3 4 5 6 7 8
Retention Time (min) 0 20 40 60 80 100 120 140 Intensity ( mV )
Fig 3 : UPLC spectrum of Terconazole (20 ppm) in optimized conditions (RT 3.05 min.)
Forced degradation studies:
Following protocol was strictly adhered to for forced degradation of Terconazole Active Pharmaceutical Ingredient (API). The API (Terconazole) was subjected
to stress conditions in various ways to observe the rate and extent of degradation that is likely to occur in the course of storage and/or after administration to body. This is one type of accelerated stability studies that helps us determining the fate of the drug that is likely to happen after along time storage, within a very short time as compare to the real time or long term stability testing. The various degradation pathways studied are acid hydrolysis, basic hydrolysis, thermal degradation and oxidative degradation.9, 10
1. Acid hydrolysis: An accurately weighed 25 mg. of
pure drug was transferred to a clean & dry 25 ml volumetric flask. To which 0.1 N Hydrochloric acid was added & make up to the mark & kept for 24 hrs. from that 0.2 ml was taken in to a 10 ml volumetric flask & make up to the mark with mobile phase, then injected into the UPLC system against a blank of HCl ( after all optimized conditions )
3.13
0 1 2 3 4 5 6 7 8
Retention Time (min) 0 10 20 30 40 50 60 70 Intensity ( mV )
Fig 2: Chromatogram showing degradation peak 0.1 N HCl
2. Basic hydrolysis
An accurately weighed 25 mg. of pure drug was transferred to a clean & dry 25 ml volumetric flask. To which 0.1 N Sodium hydroxide was added & make up to the mark & kept for 24 hrs. from that 0.2 ml was taken in to a 10 ml volumetric flask & make up to the mark with mobile phase, then injected into the UPLC system against a blank of . NaOH ( after all optimized conditions )
2.69 3.16
4.84
0 1 2 3 4 5 6 7 8
Fig 4: Chromatogram showing degradation peak in 0.1 N NaOH
Method validation:
Accuracy : Recovery study:
To determine the accuracy of the proposed method, recovery studies were carried out by adding different amounts (80%, 100%, and 120%) of pure drug of TERCONAZOLE were taken and added to the pre-analyzed formulation of concentration 10g/ml. From
that percentage recovery values were calculated.11The results were shown in table-2.
Table 2: Accuracy Readings
Sample
ID
Concentration (g/ml) %Recovery
of
Pure drug
Statistical
Analysis Pure
drug Formulation
S1: 80 % 16 20 100.21 Mean= 100.06%
S.D. = 0.387427
% R.S.D.=
0.387195 S2: 80 % 16 20 99.62
S3: 80 % 16 20 100.35
S4: 100 % 20 20 99.51 Mean=
99.93669%
S.D. = 0.646091
% R.S.D.=
0.6465 S5: 100 % 20 20 100.68
S6: 100 % 20 20 99.62
S7: 120 % 24 20 100.36 Mean=
99.65333%
S.D. = 0.668905
% R.S.D. =
0.671232 S8: 120 % 24 20 99.57
S9: 120 % 24 20 99.03
Precision: Repeatability
The precision of each method was ascertained separately from the peak areas & retention times obtained by actual determination of five replicates of a fixed amount of drug. Terconazole(API) The percent
relative standard deviation were calculated for Terconazole are presented in the table-3.
Table 3: Standard Deviation
UPLC Injection
Replicates of
Terconazole
Area Retention Time
Replicate–1 3046971 3.11
Replicate–2 3050069 3.1
Replicate–3 3041269 3.09
Replicate–4 3056984 3.06
Replicate–5 3054126 3.07
Average 3049884 3.086
Standard Deviation 6147.003 0.020736
% RSD 0.201549 0.671952
Linearity & Range: The calibration curve showed
good linearity in the range of 10 – 60 µg/ml, for Terconazole (API) with correlation coefficient (r2) of 0.994. A typical calibration curve has the regression equation of y = 12436x + 89741 for Terconazole.
Fig 5: Calibration curve of .Terconazole (API).
Method Robustness:
Influence of small changes in chromatographic conditions such as change in flow rate (0.1ml/min), Temperature (20C), Wavelength of detection (2nm) & acetonitrile content in mobile phase (2%) studied to determine the robustness of the method are also in favour of (Table-4, % RSD < 2%) the developed RP-UPLC method for the analysis of Terconazole( API).
Table 4: Result of method robustness test
Change in parameter % RSD
Flow (1.1 ml/min) 0.36
Flow (0.9 ml/min) 0.47
Temperature (270C) 089
Temperature (230C) 0.96
Wavelength of Detection (236 nm) 0.32
Wavelength of detection (240 nm) 0.14 Conc. in µg/ml AUC n=6
0 0
10 1190634
20 2750684
30 4067931
40 5068743
P Pattanaik et al. Volume 3 (2), Suppl. 2015, Page-22-26 LOD & LOQ:
The Minimum concentration level at which the analyte can be reliable detected (LOD) & quantified (LOQ) were found to be 0.05 & 0.15 µg/ml respectively.
3. RESULT & DISCUSSION
To develop a precise, linear, specific & suitable stability indicating RP-UPLC method for analysis of Terconazole, different chromatographic conditions were applied & the results observed are presented in previous chapters. Isocratic elution is simple, requires only one pump & flat baseline separation for easy and reproducible results. So, it was preferred for the current study over gradient elution. In case of RP-UPLC various columns are available, but here C18 Develosil
ODS HG-5 RP 150mm x 4.6mm 5µm particle size column was preferred because using this column peak shape, resolution and absorbance were good. Mobile phase & diluent for preparation of various samples were finalized after studying the solubility of API in different solvents of our disposal (methanol, acetonitrile, dichloromethane, water, 0.1N NaOH, 0.1NHCl). .
4. CONCLUSION
A sensitive & selective RP-UPLC method has been developed & validated for the analysis of Terconazole API. Further the proposed RP-UPLC method has excellent sensitivity, precision and reproducibility.
5. REFERENCES
1. Michael E. S., Ira S. K., Analytical Method Development and Validation, Marcel Dekker, Inc., New York, 1997; 25-29.
2. Connors K.A. A Text Book of Pharmaceutical Analysis. Wiley-Inter science, Singapore, 1999; 175.
3. Willard-H.H., Lynne L.M. Jr., John A., Dean F.A.,Instrumental Methods of Analysis, 7th Edn., CBS Publishers and Distributors, New Delhi ;1-12, 580-610, 614-652.
4. Davidson A.G, Basis of Spectrophotometry, 4th Ed., Part-2, CBS Publishers, New Delhi, 2002; 264-74.
5. Fronk A.S., Handbook of Instrumental Techniques for Analytical Chemistry, 1st Edn., Pearson Education, 2004 ; 7.
6. Skoog D.A., Holler F.J., Nieman D.A., Principle of Instrumental Analysis, 6th ed Reprint, Thomson Brooks/Cole publication, 2004 ; 300-351.(UV) 7. Sharma Y.R., Elementary Organic Spectroscopy,
Principle & Chemical Applications, S. Chand & Company Ltd., New Delhi, 2005; 8.
8. Kalsi P.S., Spectroscopy of Organic Compounds, 5th ed, New Age International Publishers New Delhi, 2002; 7.
9. Braun R.D., Introduction to Instrument Analysis, Pharma Book Syndicate, Hyderabad, 2005; 261. 10. Beckett,A.H., Stenlake J.B., Practical
Pharmaceutical Chemistry, (1997), 4th edition, Part 2, CBS Publishers and Distributors ; 275-337. 11. Jadhav S. M. And Arbad B. R.;
“Spectrophotometric methods for simultaneous
estimation of tinidazole and nimesulide from tablet