Microbial Viability
Stephen P. P. Homby
A thesis submitted for the degree o f
Doctor o f Philosophy
to the
University o f London
Department o f Chemical and Biochemical Engineering
University College London
Torrington Place
London
ProQuest Number: 10046142
All rights reserved
INFORMATION TO ALL USERS
The quality of this reproduction is dependent upon the quality of the copy submitted.
In the unlikely event that the author did not send a complete manuscript and there are missing pages, these will be noted. Also, if material had to be removed,
a note will indicate the deletion.
uest.
ProQuest 10046142
Published by ProQuest LLC(2016). Copyright of the Dissertation is held by the Author.
All rights reserved.
This work is protected against unauthorized copying under Title 17, United States Code. Microform Edition © ProQuest LLC.
ProQuest LLC
789 East Eisenhower Parkway P.O. Box 1346
An increasing number of biotechnology production processes require a whole cell recovery step during downstream processing. Viability loss at this stage is generally undesirable as it can lead to reduced yields and separation difficulties further downstream. Comparisons between the effects of different types of equipment on a single strain of cells is rare. Such information can be invaluable when designing new processes or equipment. This work was carried out in the following stages:
• Production of identical batches of cells for testing • Use cells to develop a reproducible assay test system
• Use the assay system to assess the damage of various concentration techniques on the viable cells
A reproducible batch fermentation for the production of Pseudomonas putida ML2 cells was developed. Both the inoculum and fermentation stages were carried out in fully defined media. The fermentation used a minimum salts media and fructose as a carbon source.
The bioluminescent ATP assay was tested as a novel method for measuring cell damage. The action of separation was simulated at laboratory scale by the use of a high pressure homogeniser. The ATP assay was tested on growth and stationary phase cells and results were compared to standard assay methods such as plate counts and protein release. Cells in stationary phase appeared to undergo a metabolic activation and so ATP analysis proved to be unreliable. Protein assay and plate count techniques were developed to increase reproducibility and accuracy by the use of multiple repeats and statistical analysis.
Batch centrifugation was examined, multichamber bowl centrifugation proved to be less damaging to cells than tubular bowl centrifugation. Continuous centrifugation was carried out using a disk stack centrifuge with intermittent solids discharge. Damage was observed between 0-20% loss of viability. Cells were sampled directly from the separation bowl as well as from the discharged solids. Little difference was observed, suggesting that damage occurs in either the separation or feed zones prior to discharge.
Microfiltration was carried out using a specially devised laboratory scale rig, designed at UCL. Runs were carried out under a number of different operating conditions. Increased cell damage was observed at higher cell concentrations and transmembrane pressures. Unlike centrifugation, results the protein release levels are less than the measured loss of viability suggesting a different mode of inactivation.
Acknowledgements
I would like to thank the following people:
Professor Mike Hoare for his supervision.
John Levesley for his help and advice, and for allowing me to use his membrane rig.
Billy Doyle and Chris Seaton for helping me with the fermentations and processing.
Chapter 1 Introduction
Chapter 2 Fermentation development
Chapter 3 Analytical Development
Chapter 4 Centrifugation
Chapter 5 Microfiltration
Chapter 6 Analysis of results
Chapter 7 Discussion
Chapter 8 Conclusion
Appendices
References
Abbreviations
1 Introduction 1
1.1 Biotechnology 1
1.2 Context of this research 3
1.3 Mechanism of cell damage 5
1.4 Summary of work 7
2 Fermentation development 8
2.1 Introduction 8
2.2 Materials and methods 10
2.2.1 Organism 10
2.2.2 Inoculum preparation 10
2.2.3 Fermentation protocol 12
2.2.4 Assay and monitoring techniques 13
2.3 Results 14
2.3.1 Inoculum development 14
2.3.2 Fermentation development 17
2.4 Discussion 29
3 Analytical Development 33
3.1 Introduction 33
3.1.1 Methods for quantifying cell viability and damage 33
3.1.1.1 Growth analysis 33
3.1.1.2 Physical analysis 40
3.1.1.3 Respiration measurements 41
3.1.1.4 Active dye staining 42
3.1.1.5 Summary 45
3.1.2 Testing for intact cells 46
3.1.2.1 Protein assay 47
3.1.2.1.1 Total soluble protein 49
3.1.2.1.2 Marker enzyme 49
3.1.2.2 Nucleic acid analysis 50
3.1.2.2.1 DNA assay 50
3.1.2.2.2 RNAasay 51
3.1.2.3 Metabolite analysis 52
3.1.2.4 Whole cell tests 52
3.1.2.5 Most suitable test 52
3.1.3 ATP analysis 53
3.1.3.4 Assay techniques 61 3.1.3.5 Comparison between firefly ATP assay and
conventional culture 63
3.1.4 Cell disruption techniques for assay development 66
3.1.4.1 Homogenisation 67
3.1.4.2 Other methods of cell disruption 70
3.1.4.3 Most suitable disruption system 73
3.1.6 Summary of analytical techniques 74
3.2 Materials and Methods 75
3.2.1 Homogenisation 75
3.2.2 Analytical assay techniques 75
3.2.2.1 Optical density 75
3.2.2.2 Dry weight 75
3.2.2.3 ATP 76
3.2.2 4 Viable cell count 76
3.2.2.5 Protein 77
3.2.2.Ô Viscosity 78
3.2.2.7 Biotransformation activity 78
3.2.3 Analytical development 79
3.2.3.1 Fermentation monitoring 79
3.2.3.2 Homogenisation 79
3.3 Results 81
3.3.1 ATP standard curve 82
3.3.2 Fermentation monitoring 83
3.3.3 Homogenisation 89
3.3.3.1 Growth phase cells 89
3.3.3.2 Stationary phase cells 94
3.3.3.2.1 Direct sampling 94
3.3.3.2.2 Activation 98
3.3.3 3 P. putida ML2 disruption characteristics 102
3.3.3.4 The fate of extracellular ATP 103
3.4 Discussion 104
3.4.1 Fermentation monitoring 104
3.4.2 ATP assay development 107
4 Centrifugation 115
4.1 Introduction 115
4.1.1 The use of centrifuges in the biotechnology industry 115
4.1.2 Mechanisms of cell damage due to centrifugation 116
4.1.3 Centrifuge theory 118
4.1.4 Types Of Centrifuge 120
4.1.4.1 Tubular Bowl Centrifuge 121
4.1.4.2 Multichamber Centrifuges 123
4.1.4.3 Imperforate Basket Centrifuge 124
4.1.4.4 Scroll Type Centrifuges 125
4.1.4.5 Disc Stack Centrifuges 126
4.1.5 Modifications to Centrifuges 127
4.1.6 Summary 130
4.2 Materials and Methods 131
4.2.1 Analytical Assay Techniques 131
4.2.2 Bench Top Centrifuges 131
4.2.3 Multichamber Bowl Centrifuge 132
4.2.4 Tubular Bowl Centrifuge 133
4.2.5 Disc Stack Centrifuge 133
4.3 Results 135
4.4 Discussion 137
5 Microfiltration 139
5.1 Introduction 139
5.1.1 Use of membrane separation in biotechnology 139
5.1.2 Types of membrane processing 140
5.1.3 Problems with conventional filtration techniques 143
5.1.4 Microfiltration for whole cell separation 145
5.1.5 Construction of membrane rigs 146
5.1.5.1 Membrane unit 146
5.1.5.2 Pump 148
5.1.6 Effects of membrane process conditions 151
5.1.7 Membrane processing problems and their solutions 154
5.2 Methods And Materials 157
5.2.1 Analytical assay techniques 157
5.2.2 Membrane rig 157
5.3.2 Total recycle of retentate and permeate 166
5.3.2.1 1 bar transmembrane pressure 166
5.3.2.2 4 bar transmembrane pressure 172
5.3.3 Cell concentration mode 178
5.3.4 Microfiltration using back pulsing 182
5.3.5 Viscosity measurements 184
5.4 Discussion 185
5.4.1 Measured results 185
5.4.2 Mechanism of cell damage 185
6 Analysis of results 188
6.1 Introduction 188
6.2 Cell damage 188
6.3 Shear Stress 190
6.3.1 Characterisation of fluid stresses 190
6.3.2 Pump 192
6.3.3 Fermenter 193
6.3.4 Homogeniser 193
6.3.5 Centrifuge 196
6.3.6 Microfiltration unit 199
6.3.7 Summary of shear stresses across range of operations 206
6.4 The effects of exposure to high shear zones on cells 207
6.5 Observed And Actual Inactivation Rate Constants 211
7 Discussion 214
8 Conclusion 221
8.1 Main Findings 221
8.2 Importance of Work 223
Appendices 225
References 276
Abbreviations 289
App 2.1 Indole agar and trace elements solution 225
App 2.2 Inoculum shake flask preparation 227
App 2.3 Fermenter media 230
App 3.1 Variations on the standard plate count 233
App 3.2 Growth delay analysis 237
App 3.3 Firefly luciferase reactions 240
App 3.4 Instructions for carrying out the ATP assay 245
App 3.5 ATP predictions 248
App 4.1 Measured values of centrifugation 252
App 4.2 Centrifuge dimensions 255
App 6.1 Estimation of fermenter shear stress 257
App 6.2 Estimation of homogeniser shear stress 260
App 6.3 Estimation of centrifuge shear stress 263
App 6.4 Estimation of microfiltration rig shear stress 267
List of figures
1.1 Biotechnology production processes 2
1.2 LINK model production system 3
2.1 Fermentation regime PPFl. Fermentation profile 22
2.2 Fermentation regime PPF2. Fermentation profile 23
2.3 Fermentation regime PPF3. Fermentation profile 24
2.4 Fermentation regime PPF4. Fermentation profile 25
2.5 Fermentation regime PPF5. Fermentation profile 26
2.6 Fermentation regime PPF6. Fermentation profile 27
3.1 ATP standard curve 82
3.2 Fermentation LINK27, growth phase monitoring 84
3.3 Fermentation LINK 17, growth phase monitoring 85
3.4 Extended fermentation monitoring SHPP07 87
3.5 Extended fermentation monitoring SHPP08 88
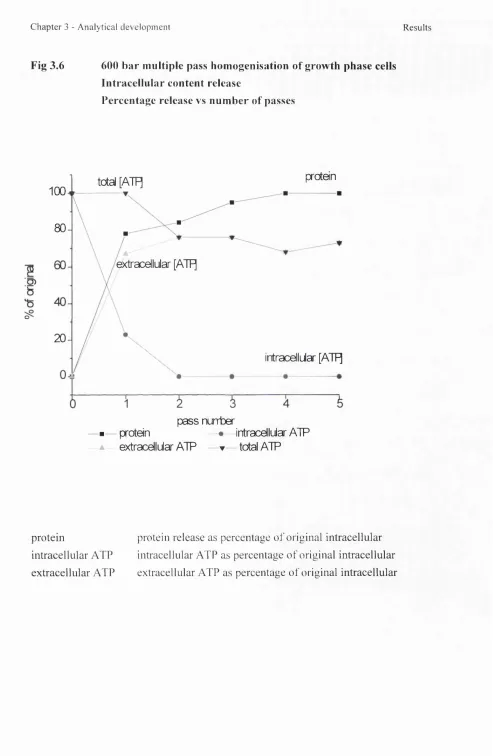
3.6 5OObar multipass homogenisation of growth phase cells 90 3.7 Multiple pass homogenisation of growth phase cells
- protein release 91
3.8 Multiple pass homogenisation of growth phase cells
- intracellular ATP release 92
3.9 Multiple pass homogenisation of growth phase cells
- extracellular ATP 93
3.10 500 bar multipass homogenisation of stationary phase cells 94 3.11 Multiple pass homogenisation of stationary phase cells
- protein release 95
3.12 Multiple pass homogenisation of stationary phase cells
- intracellular ATP release 96
3.13 Multiple pass homogenisation of stationary phase cells
- extracellular ATP 97
3.14 ATP Activation curves SHPP17 99
3.15 ATP Activation curves SHPP21 100
3.16 ATP Activation curves SHPP22 101
3.17 P. putida ML2 resistance to mechanical stress 102
3.18 Extracellular ATP decay 103
3.19 Unit ATP for multiple pass homogenisation 105
3.22 ATP per intact cell vs pass number for multipass homogenisation
of stationary phase cells 113
4.1 Tubular Bowl Centrifuge 4.2 Multichamber Bowl Centrifuge 4.3 Imperforate Bowl Centrifuge 4.4 Scroll Type Centrifuge 4.5 Disc Stack Centrifuge
122 123 124 125 126
5.1 Bio-Design microfiltration rig configuration
5.2 Membrane rig after addition of extra membrane module 5.3 Fermentation SHPP22 total recycle microfiltration run. 5.4 Fermentation SHPP25 total recycle microfiltration run 5.5 Fermentation SHPP35 total recycle microfiltration run 5.6 Fermentation SHPP50 total recycle microfiltration run 5.7 Fermentation SHPP26 total recycle microfiltration run 5.8 Fermentation SHPP34 total recycle microfiltration run 5.9 Fermentation SHPP35 total recycle microfiltration run 5.10 Fermentation SHPP42 total recycle microfiltration run 5.11 Fermentation SHPP51 total recycle microfiltration run 5.12 Fermentation SHPP49 cell concentration microfiltration run 5.13 Fermentation SHPP52 cell concentration run
5.14 Low cell density cross flow microfiltration using back-pulsing 5.15 Measured viscosities vs cell concentration
158 159 167 168 169 170 173 174 175 176 177 179 180 183 184
6.1 Small element of fluid
6.2 Force acting on small element of fluid 6.3 Lab 40 homogeniser high shear area
6.4 Percentage cellular disruption for single pass homogenisation vs estimated shear stress and operating pressure
6.5 Disruption rate constant vs estimated shear stress 6.6 Westfalia CSA 1 disc stack centrifuge
6.7 Inactivation rate constant vs estimated wall shear stress 6.8 Inactivation rate constant vs estimated pump shear stress 6.9 Pressure changes within the microfiltration rig
6.10 Actual rate constant vs estimated shear stress
List of tables
2.1 Variations in Shake Flask 1 media composition
and incubation times 11
2.2 Variations in Shake Flask 2 media composition 12
2.3 Fermentation scale-up conditions 12
2.4 Compositional changes in fermenter media 13
2.5 Cell yields obtained during inoculum deveopment 15
2.6 Summary of fermentation yields and inoculum used 19
2.7 Fermentation data 28
3.1 Properties of protein assays 47
3.2 Resistance of cell types to mechanical stress 67
3.3 Summary of homogenisation trials 98
4.1 Properties of centrifuges 121
4.2 MSB Hi Spin 21 bench top centrifuge results 135
4.3 Sigma 113 bench top centrifuge results 135
4.4 Westfalia KDD605 multichamber bowl centrifugation results 135 4.5 Sharples-Pennwalt IP tubular bowl centrifugation results 136
4.6 Westfalia CSA 1 disc stack centrifugation results 136
5.1 Separation processes that have an energy requirement 141
5.2 Biotechnology industry applications of membrane
separation processes 141
5.3 Characteristics of different membrane configurations 147
5.4 Properties of membrane modules 160
5.5 1 bar total recycle microfiltration trials 166
5.6 4 bar total recycle microfiltration trials 172
5.7 Microfiltration trials carried out in cell concentration mode 178
5.8 Microfiltration using back pulsing 182
6.1 Estimated shear stresses across range of operations 206
6.2 Cell damage effects across range of operations 210
6.3 Observed and actual rate constants 212
1 Introduction
1.1 Biotechnology
Biotechnology is the provision of goods and services that rely on the use of biological materials. There are many important industrial applications of biotechnology:
Food altering appearance, taste
Drink brewing
Health drug production
Agriculture pest resistance, crop yields Sewage treatment reduction in chemical usage
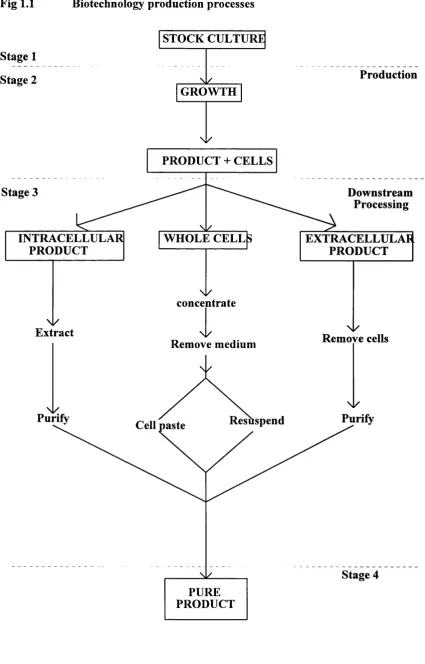
Production processes generally involve the culturing of cells and the subsequent extraction and purification of a product. The end product is usually one o f the following:
• Intracellular product • Extracellular product • Whole cell
The first stage of production is growth of the cells. Microbial cells are often used to produce biotechnology products, as they are relatively straightforward to grow and process compared to mammalian or plant cells. The resistance to shear stresses of microbial cells allows large scale liquid culture.
Unfortunately many products, such as vaccines and drugs are mammalian in origin. Advances in recombinant DNA technology have helped solve many problems. The expression of mammalian genes in microbial hosts is widespread. Once foreign genes are incorporated into the host it can then be rapidly grown by fermentation culture. The mass production of many complex biological substances is now possible. Products often occur in very low concentrations in the culture and the ability to produce cells in large quantities compensates for low yields.
Chapter 1 - Introduction
Fig 1.1 Biotechnology production processes
Stage 1 Stage 2
STOCK CULTURE
N/ GROWTH
N/
Production
PRODUCT + CELLS
Stage 3 Downstream
Processing
INTRACELLULAR PRODUCT
WHOLE CELLS EXTRACELLULAR
PRODUCT
\ y
concentrate
Ni/
Extract \ l /
Remove cells
Ni/
Remove medium
Nl/
Purify
Nl/
Purify Resuspend
Cell paste
Stage 4 PURE
1.2 Context of this research
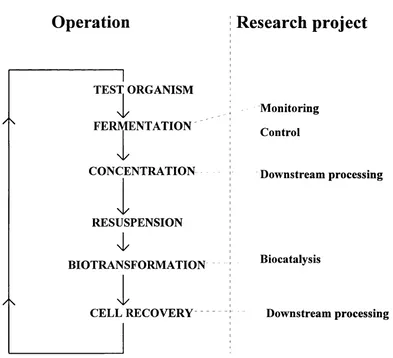
This work was carried out as part of a LINK project. Five separate projects investigated particular aspects of a model production process, which consisted o f a microbial fermentation followed by a biotransformation. Figure 1.2 outlines the model.
Fig 1 .2 LINK model production system
Operation
/ \
TEST ORGANISM
FERMENTATION
CONCENTRATION
\i/
RESUSPENSION
BIOTRANSFORMATION
\l/
CELL RECOVERY
Research project
Monitoring Control
Downstream processing
Biocatalysis
Downstream processing
Chapter 1 - Introduction
from the aqueous phase, centrifugation and microfiltration are the most frequently used.
Successful isolation of biological particles has proved to be a challenge for the biochemical engineer. The target substances are often difficult to isolate and separate from other cellular components. This is often due to small differences in size and density as well as problems caused by temperature and mechanical sensitivity.
Damage caused to cells by centrifugation and microfiltration often cause problems in subsequent processing steps. It is important to be able to concentrate suspensions without damaging the cells, for a variety of production processes.
Whole cells
Cells are often the desired product. Whole cell recovery from fermentation broth is an important stage of many production processes. Concentration of the cells allows separation from their liquid medium. This is carried out when :
• Nutrients are depleted, to allow resuspension in a fresh medium
• Product production is a two stage process, that requires a medium change. For example, secondary metabolite production. Cells are grown to the desired concentration and a different medium is used to induce formation of the product • Accumulation of autotoxic metabolites excreted into the extracellular
environment causes problems by limiting growth or production of product. Cells can simply be resuspended in fresh medium
• Cells are to be used as whole cell catalysts in biotransformations. The cells are grown to a desired concentration, separated from their growth medium and then resuspended in the reaction medium for production of the product
There are a number of advantages of being able to successfully produce cells in a concentrated form, without breakage or damage:
• No loss of product, eg yeast production • Ease of handling a concentrated suspension • Ease of transporting a concentrated suspension
Intracellular product
Production of intracellular material requires a number of processing steps, usually extraction followed by purification. Product is inevitably lost at each stage. The product is more concentrated when situated within cells than it is outside them. If cells can be concentrated before the product is extracted then loss is reduced.
Extracellular product
One source of contamination when purifying an extracellular product is intracellular components that have been released from lysed cells. Removal of cells without breakage removes potential contaminants before they come into contact with the target material.
1.3 Mechanism of cell damage
The action of microfiltration and centrifugation often damage a microbial population. Comparisons between the effects of different types of equipment on a particular strain of cells is rare. An understanding of the causes of this damage would assist in the optimisation of any production process or design of equipment. Defining and quantifying cell damage is not a straightforward task. The most obvious method of expressing damage is in terms of loss of viability. The term viability is not rigidly defined and is generally regarded as an organism's ability to:
• Reproduce
• Metabolise
Chapter 1 - Introduction
It is possible to study effects of a process on a cell population. This can be carried out by quantification of the number of reproducing and hence useful cells. Any method adopted would ideally be:
Accurate
Consistent and reproducible over a long period of time Rapid
Easy to use Inexpensive
The most widely used method of quantifying viable microbial cells is the Standard Plate Count (SPC), also known as the Viable Cell Count (VCC). There are a number o f inherent problems with this test which will be discussed later. An alternative approach to viability quantification in this situation would be to assume that any viability loss is caused by the lysis of cells. The assay for released substances could be correlated to the viability loss of a fraction of the cell population. The assay of total soluble protein has been shown to be simple and accurate. Many industrial processes do not require cells to possess the ability to reproduce, only metabolise. One such application is a biotransformation carried out by Pseudomonas putida ML2. This requires the presence of an intact cell membrane and respiration system but not the ability to reproduce.
1.4 Summary of work
The test organism used throughout this work was Pseudomonas putida ML2 which is a gram negative bacteria. The organism is capable of carrying out a industrially useful biotransformation. This is the whole cell biocatalytic conversion of fluorobenzene to fluorocatechol. This is mediated by the enzyme benzene dioxygenase which is constitutively expressed by the Toi plasmid.
This work was carried out in a number of stages:
1. Develop method of testing cell damage reproducibly produce cells identify a test procedure test assays and develop 2. Investigate effects of pilot-scale operations centrifugation
microfiltration 3. Data analysis over range of operations
Initially a method was developed to reproducibly produce the test organism by fermentation culture. A literature survey highlighted the potential of a recently developed assay approach for the quantification of microbial viability. Cells were subjected to stresses at laboratory scale similar to those encountered during downstream processing. Results of analysis using the novel technique were compared to a number of established techniques, and the results were compared. A test system was then proposed.
Chapter 2 - Fermentation developm ent Introduction
2 Fermentation Development
2.1 Introduction
This chapter describes the development of a protocol for the reproducible production
of Pseudomonas putida ML2 cells. For the consistent production of cell batches the
following parameters need to be well defined: • Quantity of cells
• Physiological state of the cells • Purity of the culture
Cells can be produced by a number of different methods. Solid culture uses agar plates, bottles and tubes. Liquid culture involves shake flasks and fermentation techniques. Fermentation can be carried out as either batch, fed-batch or continuous culture.
The quantity of cells required will determine the method of production. Solid and shake flask culture can only provide enough cells for small scale laboratory work. In order to test biochemical engineering equipment cells need to be produced in liquid culture in quantities exceeding tens of litres. The most controllable method is batch fermentation, which has a number of advantages over continuous culture or fed batch:
• Simplicity of operation
• Homogeneity of harvested culture
Simplicity of preparation and operation of batch fermentations reduces the risk of contamination because of shortened operating times and decreased contact with potential sources of infection, eg during media addition and washout. Equipment and running costs are also reduced.
Factors that lead to variability in the cell production process are:
• Revival of stock culture
• Inoculum seed culture regime and transfer to vessel
• Consistent medium components for inoculum and fermentation culture
Cells are required weekly, over a period of a number of years. The culturing of stocks must ensure that no change in physiological characteristics takes place. In the case of P. putida ML2 this could be loss of Toi plasmid activity.
The inoculum seed culture regime must provide uncontaminated cell suspensions in sufficient quantities to be used as fermenter inocula. It is important to use the inoculum at the same point in the growth cycle of each fermentation. Cells in growth phase are preferable because they grow on introduction to the fermenter. The quantity and stage of growth of the cells is dependent on incubation temperature and time.
Components of the fermentation media must be in sufficient quantity to allow maximum cell yield without limiting growth or wastage. Growth time should be as short as possible to reduce the risk of vessel contamination. Harvesting the cells should occur at precisely the same time for each of the fermentations.
The vessel operating parameters ideally should be fixed. If an organism has a high oxygen requirement the agitation or aeration is often increased during the fermentation to prevent the Dissolved Oxygen Tension (DOT) falling below critical levels, which can effect the physiological characteristics of the cells. The increase must take place at a set time during the fermentation. To remove this variable it is preferable to start with high levels of agitation and aeration throughout the run.
Chapter 2 - Fermentation developm ent Materials & M ethods
2.2 Pseudomonas putida ML2 fermentations
2.2.1 Organism
The organism used throughout this project was Pseudomonas putida ML2, provided by Shell Research Ltd (Sittingboume, UK). The stock cultures were provided and stored as freeze-dried samples.
When required, the culture was revived by resuspension in 1.3% (w/v) Nutrient Broth (Oxoid, Unipath Ltd., Basingstoke, UK) and used as an inoculum for shake flask culture. To screen for plasmid retention the culture was streak plated onto Indole agar plates. The composition of which is listed in Appendix 2.1. Cells containing the plasmid formed indigo colonies. These were subcultured onto 2.8% (w/v) nutrient agar plates (Oxoid, Unipath Ltd., Basingstoke, UK). These were stored at 4°C and used as a working stock culture for upto one month.
2.2.2 Inoculum preparation
The preparation of inoculum for fermentations was carried out in two stages. Cells were grown in a two stage liquid culture system using shake flasks. The first shake flask stage was used to revive the stock culture and screen for P. putida ML2 Toi plasmid activity. The second stage involved growing screened cells to a concentration suitable for fermenter inoculation.
Shake flask 1 fSFU
The first stage consisted of culturing cells in a liquid minimal salt media containing an aromatic compound as a carbon source. This provided a screening mechanism for pure P. putida ML2 cells as the aromatic's toxicity inactivated contaminating cells or any that had lost plasmid activity. Cells containing a fully functioning plasmid were able to utilise the aromatic as a carbon and energy source and grow.
Shake flask 2 fSF2)
cell concentrations in the first set of shake flasks. A secondary shake flask culture (SF2) was then used to grow cells to higher concentrations.
The base medium of both sets of flasks was identical and is listed in Appendix 2.2. The quantity and composition of the shake flasks and the incubation time was developed during the course of this work. Six different regimes were used and designated the titles PPInocl-PPInocb. Shake Flask 1 media composition and incubation time was varied until a satisfactory cell yield was obtained. The composition of the Shake Flask 2 base medium remained unchanged however the media and inoculum volume was varied. Full details of the preparation of the flasks and media is outlined in Appendix 2.2.
Table 2.1 Variations In Shake Flask 1 (SFl) media composition and incubation times
Carbon Source
[carbon vol] pL L 1
Peptone added
incubation time / h
PPInocl benz 500 y 24
PPInoc2 fluoro 500 y 24
PPInoc3 benz 2000 X 24
PPInoc4 benz 1000 X 72
PPInocS benz 1000 X 72
PPInoc6 benz 1000 X 72
Chapter 2 - Fermentation developm ent Materials & Methods
Table 2.2 Variations In Shake Flask 2 Media Composition
Flask volume / mL Base media mL Inoculum mL Carbon source Number of flasks
FPInocl 500 100 5 Fructose 2
PPInoc2 500 100 5 Fructose 2
PPInoc3 500 100 5 Fructose 1
PPInoc4 500 100 10 Benzene 1
PPInocS 500 100 25 Fructose 2
PPInoc6 2000 400 100 Fructose 1
Shake flask cultures were grown to a chosen cell concentration as measured by optical density measurements at 670 nm. They were then used as a fermenter inoculum.
2.2.3 Fermentation protocol
Pseudomonas putida ML2 cells were produced by batch fermentation.
Fermentations were carried out over a range of scales using LH fermenters (Reading, UK). At 5 litre scale in a LH07L fermenter, 10 litre in a LH20L fermenter and 25 litre in a LH42L fermenter.
Table 2.3 Fermentation scale-up conditions
Fermenter Total volume L Working volume L Agitation rpm Airflow L min-1
LH7L02 7 5 1000 5
LH20LO2 20 10 1000 10
LH42L01 / 2 42 25 800 20
any of the settings during the course of the run. The media composition was optimised until a reproducible fermentation was developed. Changes were made to the quantities of nitrogen and iron source used. Some small changes were made to the sterilisation regime of certain components. Each regime was designated the name PPF(number). Six different media compositions were used, PPF1-PPF6.
Table 2.4 Compositional changes in fermenter media
Fermentation Regime
Nitrogen source (^1 1 4 ) 2 8 0 4
gL '^
Iron (II) source FeS0 4
gL-^
PPFl 8.4 0.032
PPF2 1 0.032
PPF3 8.4 0.032
PPF4 5 0.032
PPF5 8.4 0.08
PPF6 8.4 0.08
Appendices 2.3 gives full details of media composition, equipment preparation and variations in inoculum regime used.
2.2.4 Assay And Monitoring Techniques
Samples were regularly monitored for dry weight, optical density and viable cell concentration. Details of these techniques can be found in Section 3.2.
Chapter 2 - Fermentation developm ent Results
2.3 Results
The production of inoculum and the fermenter operating conditions were varied until the fermentations produced consistent cell batches.
2.3.1 Inoculum Development
The inoculum regime was modified during this work because a significant number of fermentations failed due to lack of growth. To standardise fermentations the inoculum seed culture must be in the same stage of growth and contain the same quantity of cells on each occasion.
Seed cultures were produced in two stages each consisting of growth in liquid shake flask culture. The first shake flask culture was designated Shake Flask 1 (or SFl) and was used to revive stock cultures and simultaneously screen for P. putida ML2 by selection for Toi plasmid activity. These first shake flasks consisted of 100 mL of base medium in 500 mL conical flasks inoculated with loops of stock culture. The carbon source was either benzene or fluorobenzene, the concentrations of which were varied.
Culture from Shake Flask 1 was then used to inoculate a second series of shake flasks. These were incubated until the cell concentration had reached a certain value, before being used to inoculate the fermenter. This was designated Shake Flask 2 (SF2). These flasks were either 100 mL of base media in a 500 mL conical flasks or 400 mL of base media in a 2000 mL conical flask, both containing fhictose as sole carbon source at 30 g L‘k One inoculum regime, PPInoc4, substituted benzene for fructose.
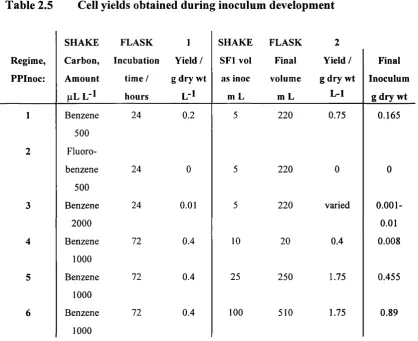
Table 2.5 Cell yields obtained during inoculum development
SHAKE FLASK 1 SHAKE FLASK 2
Regim e, Carbon, Incubation Yield / SF l vol Final Yield / Final
PPInoc: Amount time / g dry wt as inoc volume g dry wt Inoculum
pL L -1 hours L-1 m L m L L-1 g dry wt
1 Benzene
500
24 0.2 5 220 0.75 0.165
2 Fluoro
benzene 24 0 5 220 0 0
500
3 Benzene
2000
24 0.01 5 220 varied
0.001-0.01
4 Benzene
1000
72 0.4 10 20 0.4 0.008
5 Benzene
1000
72 0.4 25 250 1.75 0.455
6 Benzene
1000
72 0.4 100 510 1.75 0.89
In all cases the basal minimal media remained the same. The type and amount of carbon source was varied along with the volumes used for inocula.
PPInocl
The initial formulation suggested by Shell resulted in a low cell yield in the first shake flask, and a correspondingly low yield in the second.
PPInoc2
Chapter 2 - Fermentation developm ent Results
PPInoc3
Benzene was reused and the quantity was quadrupled and peptone was removed from the SFl media. It appeared that this benzene concentration was slightly toxic to the cells as it yielded a very small amount of growth.
PPInoc4
The concentration of benzene in the first shake flask was therefore halved. The incubation time was increased from 24-72 hours. This allowed the growth o f cells to a concentration of 0.4 g dry wt L‘k The volume of Shake Flask 1 culture used as inoculum for Shake Flask 2 was increased from 5-10 mL. Concerns over plasmid stability during fructose growth lead to benzene being tested as the carbon source in the second shake flask. The storage of identical 20 mL inoculum samples at -70°C in glycerol was carried out in an attempt to make fermentation times more uniform. When a fermenter needed to be inoculated a sample could be revived and used directly. However the use of a 0.4 g dry wt L"^ inoculum with a final volume of 20 mL proved to be inadequate and resulted in variable fermentation times.
PPInocS
Fructose was used as the carbon source in the second shake flasks, SF2, from this point. The volume of benzene-grown cell suspension used to inoculate these flasks was increased from 10-25 mL. These SF2 flasks were incubated to a final cell yield of 1.75 g dry wt L‘L Two inoculum culture flasks per 5 L of fermenter medium were used for inoculation.
PPInocb
The final volume of cell suspension was increased. 2000 mL shake flasks containing 400 mL of media were used as SF2's instead of 100 mL of media in 500 mL flasks. The entire SFl culture was used as the inoculum. The flasks were incubated for 24 hours until the cell concentration reached 1.75 g dry wt L'L
2.3.2 Fermentation development
The development of a standard fermentation for P. putida ML2 proved to be problematic. Fermentations showed a high degree of variability in terms of time taken and final yields. A standard reproducible fermentation was required if identical batches of cells were to be produced for testing processing equipment over a number of years, i.e. in a similar physiological state and with similar disruption characteristics. Changes were made in the media composition and sterilisation regime until a reproducible fermentation was developed. The main problems encountered were due to:
• Inoculum • Nitrogen source • Iron (II) source
Inoculum
The inoculum regime has already been discussed. The main problem with the inoculum during the initial stages of fermentation development was variable concentrations which lead to variation in fermentation time and insufficient cell concentration. This caused pre-growth phases lasting for days before any detectable change in cell concentration took place. This was deemed undesirable due to the increased possibility of vessel contamination.
Nitrogen source
Ammonium sulphate was used as the main nitrogen source. The concentration was in excess (8.4 g L"^) as listed in the original Shell medium (PPFl). Ammonium ions were also introduced into the fermenter by addition of alkali in the form of ammonia solution. This lead to problems when collaborative work, with another LINK team member was carried out. This work involved the monitoring of fermentations using a Biomass Probe (Aber Instruments, Aberystwyth, UK).
Chapter 2 - Fermentation developm ent Results
cell concentration changes during a fermentation and is a potentially more useful indicator of growth than exit gas measurements.
Unfortunately the high concentration of ammonium sulphate increased the electrical conductivity of the medium which prevented the device from functioning. The concentration was lowered and this appeared to cause reduced cell growth. Ammonium levels were varied in an attempt to find a compromise.
Iron (U) source
A number of difficulties arose from the transfer o f sterile iron (II) sulphate into the fermenter. Iron (II) sulphate precipitates from aqueous solution when heated therefore it could not be sterilised in the vessel with the media or separately by autoclaving. Sterile filtration was the most suitable method. Unfortunately the iron sulphate precipitated rapidly when dissolved in water and so it had to be filtered within a matter of minutes. Precipitate inevitably formed and was trapped in the filter. This reduced the amount of iron transferred into the fermenter. The amount of trapped precipitate varied and so therefore did the concentration of Fe2+ ions in the vessel.
A number of fermentations showed linear growth during mid exponential growth phase. This appeared to be a nutrient limitation effect. The addition o f extra iron (II) sulphate on the detection of this linear growth lead to the resumption of exponential growth. To prevent further iron limitation effects two steps were taken.
Initially magnesium sulphate and the iron sulphate were mixed together before sterile filtering into the vessel, before inoculation. The two components were separated. Magnesium sulphate was subsequently sterilised by autoclaving instead of sterile filtering. Whereas the iron (II) sulphate was dissolved in water and filtered alone.
The concentration of iron sulphate was increased so that it was in excess. The concentration was finally doubled to 0.08 g dry wt L 'h These actions prevented further slowing down of exponential growth.
Table 2.6 Summary of fermentation yields and inoculum regimes used
Fermentation Protocol
Figure number
Inoculum g dry wt
Max OUR
mmol L"^ h'^
Time hours
Yield g dry wt L 1
PPFl 2.1 0.17 55 26 11
PPF2 2.2 0.17 60 26 10.5
PPF3 2.3 0.01 60 50 10.5
PPF4 2.4 0.46 51 40 10.9
PPF5 2.5 0.46 65 25 11.5
PPF6 2.6 0.9 100 24 13.5
Time Yield OUR
time taken post-inoculation to reach stationary phase, hours final cell concentration, g dry wt L‘^
maximum Oxygen Uptake Rate reached at peak of stationary phase, mmol L'^h"'
The media formulation and preparation of equipment for all six regimes is outlined in Appendix 2.3. The figures, 2.1-2.2 are presented after the following description of the fermentation development.
PPFl Figure 2.1
Chapter 2 - Fermentation developm ent Results
PPF2 Figure 2.2
The electrical conductivity of the PPFl medium was too high to allow use o f the Biomass Probe. The medium was changed and renamed PPF2. The ammonium sulphate concentration was decreased from 8.4 to 1 g dry wt L"l.
Excessive foaming, when the culture reached stationary phase, lead to frequent blockage of the fermenter air exit filter. Antifoam concentration was increased from 0.6 to 2 mL L‘L
PPF3 Figure 2.3
Fermentations were prone to failure due to lack of growth and variable inocula. Ammonium sulphate concentration was returned to the original 8.4 g dry wt L'L The inoculum regime was changed so that stock culture could be stored and inoculated directly into the fermenter without the need for growth in shake flasks. 20 mL aliquots of benzene-grown cells at a concentration of 0.4 g dry wt L 'l were stored with glycerol at -70°C for use as inocula.
The resultant fermentations were approximately 50 hours long. The growth profiles were similar to previous runs but with increased pre-growth phases. It was not clear whether these pre-growth phases were genuine lag phases or periods when growth was occurring but was undetectable. It was not possible to detect the presence of cells at such a low concentration after the vessel inoculation. The fermentation run time being extended was probably due to a combination of the small amount o f cells used as an inoculum and the possibility of the cells being damaged as a result of the cold storage.
The increased period of time before growth was detected was considered to be undesirable because it increased the chances of the vessel becoming contaminated. It would appear likely that some sort of lag phase was taking place after refiigeration of the inocula at such low temperatures.
PPF4 Figure 2.4
The Biomass Probe appeared to function at an ammonium sulphate concentration of 4 g dry wt L"^ and so the fermentation medium was changed to allow use of this device.
PPF5 Figure 2.5
The Biomass Probe was still in development at this time and appeared to be unable to detect bacterial cells of this size at such low concentrations (0-15 g dry wt L"^). No more fermentations were monitored using the instrument. This allowed the ammonium sulphate concentration to be increased to the original 8.4 g L'T Problems with iron (II) sulphate limitation effects during the fermentation lead to the an increase from 0.0032-0.08 g L 'h
PPF6 Figure 2.6
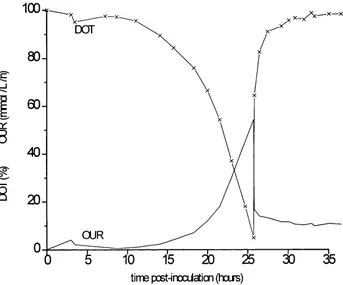
Fermentation times were still varying by upto three hours. This was due to changing pre-growth phase times. In order to prevent this happening and to ensure that the culture moved directly to growth phase, as soon as possible after inoculation, the seed culture regime was changed. A larger volume of inoculum culture was introduced into the vessel. This corresponded to a change from inoculum regime PPInoc5 to PPInoc6 (see Section 2.3.1). The media formulation and preparation of equipment for regime PPF6 is identical to that for PPF5 and is outlined in Appendix 2.3. This proved to be the most reliable and reproducible method and was used for production of all cell batches for processing. Final cell yield was 13.5 g dry wt L’l.
Chapter 2 - Fermentation development
Fig 2.1
Results
P. putida ML2 fermentation profile Fermentation regime PPFl
100
DOT
80
-_ l
60
-3
40
-20
-OUR
time post-inocUation (hoirs)
Fermentation LINK4
Maximum OUR 55 mmol L'^h'^ Cell yield 11 g dry wt L'^
DOT OUR
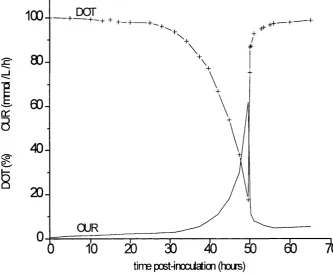
Fig 2.2 P. putida ML2 fermentation profile Fermentation regime PFF2
+ + + + + + +
80
-_i
00
-40
-20
-OUR
time post-inocUation (hoirs)
Fermentation LINK 17
Maximum OUR 60 mmol L-%-^ Cell yield 10.5 g dry wt
DOT OUR
Chapter 2 - Fermentation development
F ig 2.3
Results
P. putida ML2 fermentation profile Fermentation regime PPF3
DOT
+ - + + + - + .
100
-+ -+ — + '
60
-40
-20
-OUR
time post-inoculation (hoirs)
Fermentation LINK44
Maximum OUR 60 mmol L’^h'^ Cell yield 10.5 g dry wt L'^
DOT OUR
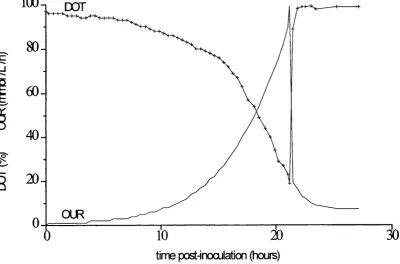
Fig 2.4 P. putida ML2 fermentation profile Fermentation regime PPF4
100-r
D O
T'"-80
-00
-o
40
-20
-OUR
tiire post-inoculation (hours)
Fermentation H 0M 0G3
Maximum OUR 51 mmol L-%-^ Cell yield 10.9 g dry wt L’^
DOT OUR
Chapter 2 - Fermentation developm ent
Fig 2.5 P. putida ML2 fermentation profile Fermentation regime PPF5
Results
100
^DOT
80
-_ i
60
-0:
3
40
-20
-OUR
time pœt-incxxiation (hoirs)
Fermentation 920CT2
Maximum OUR 65 mmol L'^h'^ Cell yield 11.5 g dry wt L"^
DOT OUR
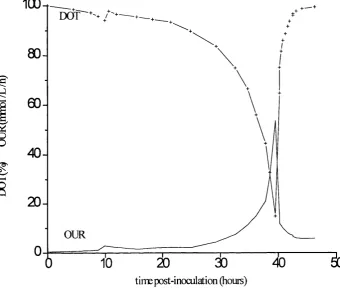
Fig 2.6 P. putida ML2 fermentation profile Fermentation regime PPF6
80
-_i
60
-40
-20
-OUR
time post-inoculation (hours)
Fermentation SHPP30
Maximum OUR 100 mmol Cell yield 13.5 g dry wt L 'l
DOT OUR
Chapter 2 - Fermentation developm ent Results
In order to demonstrate the reproducibility of fermentation regime PPF6 a number of parameters are compared in the following graph:
Table 2.7 Fermentation data
DCW
g L -l
OUR mmol L"'h“^
DOT
%
Time hours
Vessel L
SHPP30 13.5 99 19 21.5 20
SHPP31 13.8 102 22 21.5 20
SHPP34 13.4 101 30 22 42
SHPP35 13.3 105 10 22.5 42
SHPP49 13.77 99 18 22 42
SHPP51 13.72 102 21 22.5 42
SHPP52 13.7 104 23 22.5 42
SHPP53 13.55 100 22 22.5 42
DCW final dry cell weight yield on harvest
OUR maximum growth phase OUR
DOT minimum growth phase DOT
Time time taken to reach stationary phase Vessel fermenter vessel volume
2.4 Discussion
A reproducible batch fermentation for the production of P. putida ML2 has been developed. The factors that lead to variation in the production process were:
• Revival of stock culture
• Inoculum seed culture regime and transfer to vessel
• Consistent medium components for inoculum and fermentation culture • Fermenter operating parameters
Stock culture
Stock cultures were stored on nutrient agar plates at 4°C for one month. After one month colonies of P. putida ML2 cells were selected by testing for Toi plasmid activity by plating on indole agar streak plates. These colonies were then plated onto nutrient agar plates and stored at 4°C. LINK researchers studying the biotransformation ability of P. putida ML2 reported no loss of plasmid activity when stored in this way.
An attempt was made to avoid the shake flask inoculum culturing stage by inoculating stock culture directly into the vessel. Cells were grown in 1000 p, L"l benzene to 0.4 g dry wt L'L 20 mL samples were stored under glycerol at -70°C and used to inoculate fermenter vessels. This regime was designated PPInocS. The resulting fermentation times were increased by approximately 24 hours. A long pre growth phase was observed. This was probably not a true lag phase because cells may have been repairing any damage caused by cold storage (Takano, 1982). In addition the inoculum was too small for detection by exit gas analysis or OD readings. No increase in cell concentration could be measured and a long period of apparent inactivity took place before growth phase.
Chapter 2 - Fermentation developm ent D iscussion
Inoculum regime
Growth of P. putida ML2 in benzene culture had been slow and the final cell yield low. It was believed that P. putida ML2 was capable of utilising fluorobenzene as a carbon and energy source. The use of benzene in the first set of shake flasks was substituted for fluorobenzene. However fluorobenzene gave rise to no detectable cell growth. Later correspondence (Lynch, 1994) revealed that P. putida ML2's industrial importance is an enzyme defect that prevents it metabolising fluorocatechol, the product fluobenzene oxidation, hence leading to its accumulation.
In order to grow cells on entirely defined media the peptone was excluded from the first set of shake flasks. When benzene was used as a sole carbon source it was found that concentrations in the region of 2000 pL L'^ inhibited growth and did not increase the cell yield. Sampling meant that the vaporised benzene was lost when the Subaseal was removed and so it was not possible to construct growth curves in this first shake flask stage.
The use of fructose-grown cells was resumed because inoculum cultures could be grown to greater densities. It was easier to grow larger volumes of cell suspension with fructose than benzene because of faster growth and equipment limitations o f the flask culture system. Due to the volatility of benzene the shake flasks had to be sealed. Scaling up the stoppered benzene flasks was difficult, as two litre flasks could not be stoppered effectively. The volume of SFl used to inoculate the SF2's was increased and this shortened the overall incubation time. The only other variation in the inoculum regime was the use of a larger volume of SF2 flask. (IPP6) Finally the inoculum was used at high enough densities at mid growth phase to allow very rapid growth.
Fermenter medium composition
The initial media formulation and method suggested by Shell (PPFl) adequately produced cells. In order to allow collaborative work within the department it was decided to work with a researcher investigating on-line monitoring of biomass during fermentations. The method of testing for biomass changes was the measurement of capacitance using a device, known as a Biomass Probe. The presence of an excess of ammonium sulphate increased the electrical conductivity of the fermenter medium and interfered with the operation of the Biomass Monitor.
The majority of problems with fermentations appear to have arisen from variable inocula. A lack of standardisation in the inoculum regime can lead to low cell concentrations and cells possibly not being in the chosen growth phase. The fermenter media composition was not significantly changed during this work but the preparation of the components was altered. The main changes were in the nitrogen source. Ammonium sulphate at a concentration of 1 g appears to be adequate provided an strong inoculum is introduced into the vessel and extra nitrogen is fed in the form of ammonia solution for pH control. To prevent any slowing of growth due to nitrogen limitation an excess was eventually used. The initial concentration of ammonium sulphate of 8.4 g proved satisfactory.
Fermenter operating parameters
Chapter 2 - Fermentation developm ent D iscussion
Another advantage of the final regime was the convenience of being able to divide the work into weekly units:
Friday revive stock cultures in the benzene shake flasks (SFl) Monday inoculate fructose shake flasks (SF2)
prepare the fermenter and allow the probes to settle over night Tuesday inoculate the vessel
Wednesday harvest cells
downstream processing or assay testing Thursday cell damage testing
Friday results analysis
revive stock cultures in the benzene shake flasks
3 Analytical development
3.1 Introduction
3.1.1 Methods for quantifying cell viability and damage
As was mentioned in Chapter 1, quantifying the damage suffered by a cell population is not a straightforward task. Simply measuring loss of viability can provide insufficient information about the damage process. The term viability is not rigidly defined and has a number of different meanings.
The following chapter sets out to show how a reproducible assay test system was developed to quantify cell damage. The introductory section provides a review of current 'viability' and 'cell damage' tests and is divided into the following sections:
• Measurement of cellular viability • Measurement of cellular disruption • Measurement of the ATP content of cells • Methods of cell disruption at laboratory scale
3.1.1.1 Growth analysis
It is often necessary to report on the size of the bacterial population in a sample. A Viable Cell Count assumes that a visible colony will develop from each organism. Bacteria are however, rarely separated from each other and are often clumped together in large numbers particularly if they are actively reproducing (Collins et a l, 1989). A single colony may therefore develop from one organism or from hundreds or even thousands of organisms. Each colony develops from one viable unit, known as a Colony Forming Unit (CPU). As any agitation, eg in the preparation of dilutions, can break up or induce the formation of clumps, it is obviously difficult to obtain reproducible results. Bacteria are seldomly evenly distributed throughout the sample and as only small samples are usually examined very large errors can be introduced. Many of the bacteria present in a sample may not grow on the medium used at the pH or incubation temperatures employed or in the time allowed.
Chapter 3 - Analytical developm ent Introduction
inherent in the material, others in the technique. Errors of +/- 90% in counts o f the order of 10^-10^ mL‘^ are not unusual even with the best possible technique (Collines et a l, 1989). It is therefore, necessary to combine the maximum o f care in technique with a statistical interpretation of results. They can be interpreted only if the product is regularly tested and the normal range is known.
The basis for these techniques is; material containing the bacteria is serially diluted and a portion of each dilution is placed in or on suitable culture media. Each colony developing is assumed to have grown from one viable unit, which as indicated earlier, may be one organism or a group of many.
Standard Plate Count
This is the industry standard method for the enumeration of viable cells. It has been shown to be an effective tool for isolating organisms, obtaining them in pure cultures, classifying and identifying them (Hattori, 1988). The Standard Plate Count (SPC) is often known as the Viable Cell Count (VCC) or simply as plate counting.
The plate count technique is relatively straightforward. A cell sample is serially diluted until single colonies can be detected on solid culture medium. Sterile, sealed universal bottles or test tubes containing 9 mL of sterile diluent as well as a number of agar culture plates and sterile pipettes are pre-prepared. 1 mL of the cell sample is aseptically pipetted into 9 mL of sterile diluent. 1 mL of this first dilution is then transferred to the next sample of diluent until the initial sample has been diluted 10 times. The number of dilutions obviously depends on the concentration o f the cell sample which can be estimated by spectrophotometry. Usually the last six diluted samples are tested. 0.1 mL of a dilution is evenly spread over the entire surface of the plate. This is accomplished by the used of a spreader that has been sterilised by immersing in methanol and flaming. The process is repeated for the other dilutions. In practice usually the last few dilutions need be plated out.
multiplying the dilution factor by the number of colonies on any plate. Colonies are counted.
For large work loads automated systems are essential. Semi-automatic systems replace the pen that marks the glass above the colonies with an electronic counter which displays the numbers counted on a small screen. Fully automated systems use a television camera or laser beam to scan the plate and results are displayed on a screen.
Plate counts are the most commonly used method for determining viability. Advantages of this method include:
Only viable / reproducing cells are counted Allows isolation of discrete colonies
Easy to master, only requires knowledge of basic aseptic technique Useful test for contamination of samples
Indole plates provide a rapid test for loss of enzyme activity. In the case of biotransformation ability analysis of P. putida ML2
There are however a number of disadvantages of plate counting:
Accuracy
Labour intensive Suitability of organism Incubation time
State of stress of organism Culture conditions
Accuracy, as has been mentioned, can be very low. This is often due to the inherent problems with the test itself. Aggregation of cells gives rise to single colonies. Bacteria are seldomly evenly distributed throughout a sample. Operator errors are also responsible for dilution inaccuracies and the inability to discriminate between colonies too small for analysis.
Chapter 3 - Analytical developm ent Introduction
Suitability of the organism for the test. This method cannot be applied to cells forming inseparable chains or cells which attach themselves to certain solid material. When testing natural cell populations, many of the bacteria present in a sample may not grow on the medium used, at the pH or incubation temperatures employed or within the time allowed (Folt et a l, 1988). This is not a problem for known bacteria. Dehority and Grubb (1980) showed how aggregation of cells can lead to problems. Cold storage of anaerobic bacteria from bovine rumens for short periods of time gave rise to increased plate count values when compared to unstored samples. This is claimed to be due to the fact that the cells form aggregates, which equate to one colony forming unit, but the action of cold storage somehow separates the aggregates, increasing the number of CPU's.
Long incubation times are not only inconvenient but can lead to inaccuracies. The state of stress of the organism can affect the time taken for visible colonies to appear. This is due to the phenomenon of growth delay, which will be discussed in more detail later. This is the time taken before the organism's lag phase in which it repairs any stress-induced damage. In the case of severely stressed cells this growth delay could be as long as the incubation time allotted for the SPC analysis. In which case a reduced number or even no visible colonies would have appeared by the counting time, although a lengthened incubation could change this. Although this factor has an adverse effect on results, growth delay analysis can be used as a quantitative measure of the stress placed on a cell population (Takano and Tsuchido, 1982).
Culture conditions, the recovery of stressed cells depends on the ambient temperature and the composition of the diluent as well as the culture conditions. Certain diluents may cause problems eg saline or distilled water as they may be lethal for some organisms. Diluents, when used direct from the fridge can cause cold shock which may prevent organisms from reproducing.
Other methods of determining viable bacterial numbers based on a serial dilution followed by culture on suitable medium include:
• Membrane filter counts
• Most Probable Number Estimates • Rapid Automated Methods
Many of these techniques are only of use for organisms that are thermally robust enough to retain viability after immersion in molten agar. P. putida ML2 is unlikely to survive this sort of treatment, however other organisms, such as E. coli, is unaffected by temperatures upto 45°C. All of the techniques retain the same advantages and disadvantages of the basic plate count technique. More information has been included as Appendix 3.1 to provide reference for future work using different organisms.
Biophotometrv
A semiautomatic method for quantifying viable bacteria is described by Vosbeck et al. (1984). The bacterial effect of the antibiotic rifampicin was tested on the organism Staphylococcus aureus. Viable cell numbers were quantified by the analysis of growth curve data. Growth curves were constructed using absorbance measurements made by a multichannel biophotometer. Use of this particular instrument allowed the possible simultaneous monitoring of upto 176 samples. Vosbeck claims a very close correlation with SPC results.
As with the SPC the biophotometric method is based on the organism's growth kinetics. It therefore shares many of the advantages and disadvantages associated with plate counts. These potentially include long incubation periods and dilution errors at high concentrations.
A more specific disadvantage would be the suitability to P. putida ML2. After agitated and aerated growth the change to static culture in a cuvette could lead to metabolic changes which would be reflected in altered growth kinetics.
One problem that this technique does not share with plate counts is cost. The purchase and maintenance cost of a multichannel biophotometer is prohibitively high for use in this study. However there are a number of advantages of this technique:
• Semi-automation of the process allowing the analysis of upto 176 small samples simultaneously.
Chapter 3 - Analytical development Introduction
Growth Delay Analysis
Takano and Tsuchido (1982) developed the concept of Growth Delay Analysis for estimation of the total injury of a bacterial cell population, which had been subjected to some form of bactericidal stress. In order to avoid some of the problems associated with plate counts automated equipment was used to plot growth curves. The length of the observed delay in growth before the exponential growth phase seems to be a function of the levels of stress that the surviving cells have been subjected to.
Standard Plate Count (SPC) is the method widely used for enumeration of surviving cells that have been exposed to various physical and chemical stresses. These include heat, ultraviolet and ionising irradiations, freeze-thawing detergents and other bactericidal chemical agents. Growth delay analysis attempts to avoid some of the inherent problems of colony counting, such as the inability to test organisms that form inseparable chains and the overall lack of accuracy. In particular it addresses the problem of lengthened incubation times, which can delay the appearance of colonies during the allotted incubation time.
All types of cells from bacterial to human possess a set of intracellular proteins which are expressed in response to certain types of environmental stress - these are known as the Stress Response Proteins (Passini and Goochee, 1988). When a cell population is subjected to stress and then placed in an appropriate liquid assay medium, initiation of growth is delayed compared with that of an unstressed cell population. This stress-induced delay reflects not only a decrease in the number of reproducible cells but also the increased lag time which is required by non-lethally injured cells for the repair processes before the first division.
The delay time for growth can be estimated quantitatively and expressed as an integrated viability, o:
k
U = (3.1)
/ = 1 Where: