DEVELOPMENT AND VALIDATION OF METHOD FOR DETERMINATION OF ESOMEPRAZOLE BY HPLC
6
0
0
Full text
(2) Anisuzzaman Sharif Md et al. IRJP 2012, 3 (7) Preparation of test solution: 10.0 mg of the test sample was taken into a 200 ml volumetric flask. 10 ml of HPLC grade methanol was added to dissolve the sample and then 10 ml of buffer solution (pH 11) was added. Solution was diluted to 200 ml with purified water. System Suitability study The standard solution was used as system suitability solution and 20 µl of six replicate injections of standard solution was injected. Chromatogram was recorded & system suitability parameters for each of the injection and %RSD of area (within 1.0 %) and %RSD of retention time (within 1.0 %) were calculated. METHOD VALIDATION System suitability The relative standard deviation (%RSD) of the peak area responses for esomeprazole from six replicate injections of standard solution should be not more than 1.0%, The tailing factor, theoretical plate counts in standard solution and %RSD of retention time should not be more than 2.0, less than 2000 and within 1.0 % respectively. Specificity, linearity and system precision For specificity study identification, placebo (diluents) interference and RT ratio of sample and standard were observed. The linearity was carried out by observing the correlation coefficient (r) of standard solution. System Precision was carried out by performing six replicate injections at 100% of the test concentration and calculating the % RSD of the measured area. Method Precision Method precision was assessed by performing six replicate injections of the sample at 100% of the test concentration and % RSD of the assay result is calculated. Intermediate Precision (Ruggedness) Intermediate precision or ruggedness study of an analytical method is the degree of reproducibility of the test results obtain by the analysis of the same samples under a variety of normal test conditions i.e. different instrument, analysts, column, days, laboratories etc. Sample for intermediate precision was assessed by performing replicate assays (n=6) of sample at 100% of the test concentration and difference between mean assay of two different analysts. %RSD of assay results (twelve assay results) was calculated in this study. Accuracy Study was carried out over a range of 50%, 80%, 90%, 100%, 120%, 130% and 150 %(3 replicates each of the total analytical procedure) of test concentration. The % recovery and RSD of % recovery of each concentration were measured. Range Data generated in linearity, precision and accuracy were considered for establishing the range of the analytical method. Robustness Robustness of the method was investigated by changing flow rate (± 2%), column temperature (± 5ºC), ratio of components of mobile phase and pH (±0.2). Stability Study The solution stability experiments were performed under room temperature at intervals of 0 hr, 6 hrs, 12 hrs, 18 hrs, 24 hrs, 30 hrs and 48 hrs.. RESULTS AND DISCUSSION System suitability System suitability is an integral part of analytical procedures. In optimized chromatographic conditions %RSD of area of Omeprazole and %RSD of retention time were found 0.22, 0.07 respectively. Average tailing factor and theoretical plate count were 1.29 and 8056 respectively .Table-1 shows the system suitability data. The results from six consecutive injections of the standard solution indicates a good system for analysis. Specificity Specificity of an analytical method is its ability to assess unequivocally the analyte in the presence of components that may be expected to be present. Lack of specificity of an individual analytical procedure may be compensated by other supporting analytical procedures.18 From the specificity study, it was observed that the chromatogram for esomeprazole sample with omeprazole standard show positive response and blank (diluents) has no response. The RT ratio of sample & standard was 1.0 (limit 0.95-1.05) which also indicated the specificity of the method. Linearity The linearity of an analytical method is its ability to elicit test results directly proportional to the concentration of the analyte in samples within given range.19 Linearity of the method was evaluated from the correlation coefficient of calibration curves that were constructed from mean peak area of omeprazole at different concentrations level (10%, 20%, 30%, 50%, 80%, 90%, 100%, 120%, 130% and 150%). Correlation coefficient was 1.0000 which proved that the method was linear. (Table-2) (Figure-1). System precision System Precision was carried out by performing six replicate injections at 100% of the test concentration and calculating the % RSD of the measured area. . From the data ( table-3) it was observed that the % RSD of area is 0.09% which is well within the acceptance limit of 1.0%. Hence the system is precise. Method Precision The % RSD of six sample assay results was found 0.21 % which was within the acceptance limit. (Table-4) Intermediate precision or ruggedness The intermediate precision of the method was evaluated using different analyst and different instrument in the same laboratory. Assay results by two different analysts at different days have been found very much close to each other and with a difference of only 0.74 % and the % RSD of two analysts (12 samples) is 0.43% which is well within acceptance criteria. So the method can be considered to be rugged enough. (Table-5) Accuracy The accuracy of an analytical method is the closeness of test results obtained by that method to the true value. The average % recovery at different accuracy label was found 99.12 %, and % RSD for individual % recovery meets the acceptance criteria. Hence the method is Accurate. (Table-6) Range The specified range is normally derived from linearity studies and depends on the intended application of the procedure. It is established by confirming that the analytical procedure provides an acceptable degree of linearity, accuracy and precision when applied to samples containing amounts of Page 228.
(3) Anisuzzaman Sharif Md et al. IRJP 2012, 3 (7) analyte within the extremes of the specified range of the analytical procedure. Based on the linearity, precision and accuracy results, the range of the method was determined as 50% to 150% of the target concentration. (Table-7) Robustness The robustness of an analytical method is a measure of its capacity to remain unchanged by little but intentional variation in method parameters and provides an indication of its reliability during normal usage.20 Robustness of the method was investigated by changing flow rate (± 2%), changing column temperature (± 5ºC), ratio of components of mobile phase, changing pH (±0.2).(Table-8) From the above results it is clear that the system suitability criteria meet with the acceptance limit. Hence the method is robust. Stability study From the solution stability study it was observed that the test sample solution is found to be stable up to 48 hours at ambient condition. (Table-9) CONCLUSION The method adopted for estimation of Esomeprazole by HPLC is precise, linear, accurate, rugged and robust enough. The sample solution was found to be stable up to 48 hours at ambient condition. Hence this method can be considered for routine use to establish the quality of the drug substance during routine analysis with consistent and reproducible results. REFERENCES 1. Andersson T, Hassan-Alin M, Hasselgren G, Rohss K, Weidolf L. Pharmacokinetic studies with esomeprazole, the (S)-isomer of omeprazole. Clin Pharmacol 2001; 40:411-426. 2.Scott L.J., Dunn C.J., Mallarkey G, Sharpe M. Esomeprazole- a review of its use in the management of acid-related disorders. Drugs 2002;, 62:15031538 3. Hultman I., Stenhoff H., Liljeblad M. Determination of esomeprazole and its two main metabolites in human, rat and dog plasma by liquid chromatography with tandem mass spectrometry. J Chromatogr B 2007; 848:317-22. 4. Johnson D.A., Roach A.C., Carlsson A.S,. Karlsson A.A., Behr D.E.. Stability of esomeprazole capsule contents after in vitro suspension in common soft foods and beverages. Pharmacotherapy 2003; 23:731-734.. 5.Li X.Q., Anderson T.B., Ahlstrom M., Weidolf L.. Comparison of inhibitory effects of the proton pump-inhibiting drugs omeprazole, esomeprazole, lansoprazole, pantoprazole and rabeprazole on human cytochrome P450 activities. Drug Metab Dispos 2004;32:821-7. 6. Shetty R, Subramanian G, Kumar R.A., Pandey S, Udupa N. Estimation of esomeprazole in human plasma by reverse phase high performance liquid chromatography. Indian Drug s2005; 42:158-61. 7.Magesh A.R., Vijayalakshmi R, Satyavati D, Sravanthi Devi G, Dhanaraju M.D.Validated spectrophotometric estimation of esomeprazole using hydrotrophic solubilisation technique. Orie J Chem 2010; 26:1191-3. 8. Onal A,, Oztunc A. Development and validation of high performance liquid chromatographic method for the determination of esomeprazole in tablets. J Food Drug Anal 2006; 14:12-8. 9.Prabu S.L., Shirwaikar A., Shirwaikar A., Kumar C.D., Joseph A., Kumar R.. Simultaneous estimation of esomeprazole and domperidone by UV spectrophotometric method. Indian J Pharm Sci 2008; 70:128-31. 10. Patel B.H., Suhagia B.N., Patel M.M., Patel J.R. Determination of pantoprazole, rabeprazole, esomeprazole, domperidone and itopride in pharmaceutical products by reverse phase liquid chromatography using single mobile phase. Chromatographia 2007; 65:743-748. 11.Zanitti L, Ferretti R, Gallinella B, Torre F.L., Sanna M.L., Mosca A. Direct HPLC enantioseparation of omeprazole and its chiral impurities: Application to the determination of enantiomeric purity of esomeprazole magnesium trihydrate. J Pharm Biomed Anal, 2010; 52:665-671. 12. Fourman G.L.and Millen M.V. Pharma, Technol 1993; 17: 54. 13. SOP Validation studies. Indian pharma guidance academy Nagpure, 1996; p. 1-3. 14. Willar H.H.L.L., Dean, J.L., Settle F.A. Instrumental method analysis, 7th edition, CBS publishers and distributions, New Delhi,1986; p.60-75. 15. Chowdary K.P.K., Himabindul G.Validation analytical method, Eastern Pharmacist, 1999; 39-41. 16. Snyder L.R. & Kirkland J.J. Practical HPLC Method development, Wiley inter science publications, New York; 1997. p. 685-712. 17. International Conferences on Harmonization. Guidance on Validation of Analytical Procedure: Text and methodology. Q2A (R1). Federal Register, step 4 versio, 2005. 18.Rockville, M.D.Validation of compendial methods, United States Pharmacopeia XXIII, National Formulary, , The United States Pharmacopeial Convention; 1995..p.1612–1710. 19.ICH guidelines .International Conference on Harmonization (ICH) of Technical Requirements for the Registration of Pharmaceuticals for Human Use, Validation of analytical procedures: Methodology,ICH‐Q2B, Geneva,1996. 20. Ravichandran V., Shalini S., Sundramk.M. and Harishrajak .Validation of analytical methods- Strategies and importance. International Journal of Pharmacy and Pharmaceutical Sciences 2010; 2(3):18-22.. Table – 1: System suitability Study USP Tailing Factor. Injection. Area. Retention Time. 1. 2.. 1449028 1446999. 5.95 5.94. 1.29 1.29. Theoretical Plate Number 7943 8085. 3. 4. 5.. 1451887 1454273 1455190. 5.94 5.94 5.94. 1.30 1.30 1.29. 8072 8068 8063. 6. Average ( n=6 ) SD. 1453127 1451751 3165.29. 5.93 5.94 0.01. 1.30 1.29 -. 8106 8056 -. %RSD. 0.22. 0.07. -. -. Acceptance Criteria. NMT 2.0%. NMT 1.0%. NMT 2.0. NLT 2000. Page 229.
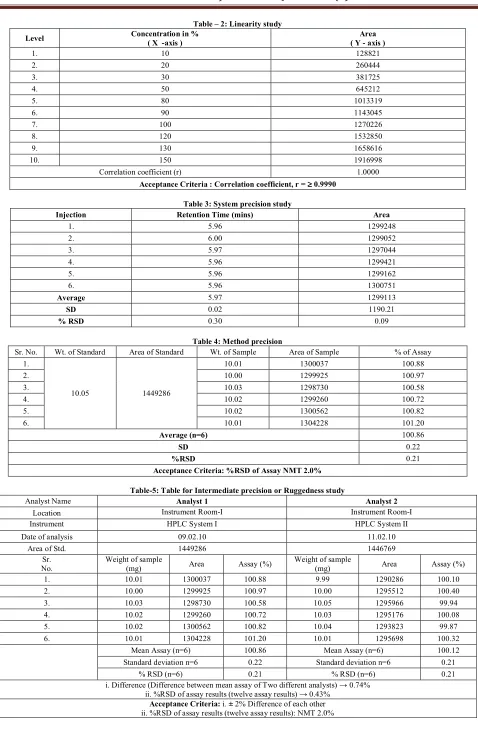
(4) Anisuzzaman Sharif Md et al. IRJP 2012, 3 (7) Table – 2: Linearity study Concentration in % ( X -axis ) 10 20. Level 1. 2.. Area ( Y - axis ) 128821 260444. 3. 4. 5.. 30 50 80. 381725 645212 1013319. 6. 7. 8.. 90 100 120. 1143045 1270226 1532850. 9. 10.. 130 150. 1658616 1916998. Correlation coefficient (r). 1.0000. Acceptance Criteria : Correlation coefficient, r = ³ 0.9990 Table 3: System precision study Retention Time (mins) 5.96. Injection 1.. Sr. No. 1. 2.. Area 1299248. 2. 3.. 6.00 5.97. 1299052 1297044. 4. 5. 6.. 5.96 5.96 5.96. 1299421 1299162 1300751. Average SD % RSD. 5.97 0.02 0.30. 1299113 1190.21 0.09. Wt. of Standard. Area of Standard. 10.05. 1449286. 3. 4. 5.. Table 4: Method precision Wt. of Sample Area of Sample 1300037 10.01 10.00 1299925. 6.. % of Assay 100.88 100.97. 10.03 10.02 10.02. 1298730 1299260 1300562. 100.58 100.72 100.82. 10.01. 1304228. 101.20 100.86. Average (n=6). 0.22 0.21. SD %RSD Acceptance Criteria: %RSD of Assay NMT 2.0%. Analyst Name Location Instrument. Table-5: Table for Intermediate precision or Ruggedness study Analyst 1 Analyst 2 Instrument Room-I Instrument Room-I HPLC System I. HPLC System II. 09.02.10 1449286. 11.02.10 1446769. Date of analysis Area of Std. Sr. No. 1. 2.. Weight of sample (mg) 10.01 10.00. Area. Assay (%). 1300037 1299925. 3. 4. 5.. 10.03 10.02 10.02. 6.. Area. Assay (%). 100.88 100.97. Weight of sample (mg) 9.99 10.00. 1290286 1295512. 100.10 100.40. 1298730 1299260 1300562. 100.58 100.72 100.82. 10.05 10.03 10.04. 1295966 1295176 1293823. 99.94 100.08 99.87. 10.01 1304228 Mean Assay (n=6). 101.20 100.86. 10.01 1295698 Mean Assay (n=6). 100.32 100.12. Standard deviation n=6 0.22 Standard deviation n=6 % RSD (n=6) 0.21 % RSD (n=6) i. Difference (Difference between mean assay of Two different analysts) → 0.74% ii. %RSD of assay results (twelve assay results) → 0.43% Acceptance Criteria: i. ± 2% Difference of each other ii. %RSD of assay results (twelve assay results): NMT 2.0%. 0.21 0.21. Page 230.
(5) Anisuzzaman Sharif Md et al. IRJP 2012, 3 (7) Table-6: Accuracy study % RSD of Individual recovery. Level. Weight of sample (mg). Area of Sample. % of Recovery. 50%. 4.98 4.99. 637834 640901. 99.49 99.76. 0.32. 80%. 5.00 7.95 7.98. 638058 1010522 1013916. 99.12 98.73 98.69. 0.86. 90%. 8.02 8.97 8.99. 1034520 1145799 1144773. 100.19 99.22 98.91. 0.27. 9.00 10.00. 1143363 1274461. 98.68 98.99. 100%. 9.99 9.96 11.98. 1275038 1272459 1526959. 99.14 99.24 99.00. 0.12. 120%. 11.99 12.00 12.98. 1527580 1530572 1652022. 98.96 99.07 98.86. 0.06. 130%. 12.96 12.98. 1651859 1661019. 99.00 99.40. 0.28. 14.95 15.00 14.99. 1911661 1911226 1906121. 99.26 98.97 98.77 99.12 0.37 0.37. 150%. 0.25 -. Average (n = 21) Standard Deviation (SD) %Relative Standard Deviation (%RSD) Acceptance Criteria : % Recovery: (98 –102)% and %RSD: NMT 2.0%. Parameter Linearity Method Precision. Concentration Range 10 % to 150% 100%. Intermediate Precision Accuracy. 100% 50% to 150%. -. Table-7: Range study Acceptance limit R NLT 0.9990 %RSD of Assay NMT 2.0%. Result R =1.0000 0.21%. %RSD of two analyst NMT 2.0 ± 2% Difference of each other % Recovery: (98 –102)% and %RSD: NMT 2.0%. % RSD of 2 analyst =0.43% Difference of assay =0.74% % Recovery: 99.12 %, %RSD: NMT 2.0%. Table-8: Data of System suitability (Robustness study) Tailing Factor. 0.08% 0.16%. Theoretical Plate Number 7976 8416. Column Temperature at 30˚C Column Temperature at 35˚C Buffer : HPLC grade Acetonitrile (63 : 37). 0.08% 0.05% 0.09%. 8537 8758 8064. 1.30 1.32 1.34. Buffer : HPLC grade Acetonitrile (67 : 33) Buffer pH 7.40. 0.11% 0.05%. 8726 8338. 1.35 1.35. Buffer pH 7.80. 0.07%. 7922. 1.33. Parameter. % RSD of Area. Flow rate + 2% Flow rate - 2%. Duration of Sample Solution (Hour) At initial (0 hr) After 6 hrs. Table-9: Solution stability study % of Assay 100.47 100.81. % Difference from initial - 0.34. After 12 hrs After 18 hrs. 100.88 100.90. - 0.41 - 0.43. After 24 hrs After 30 hrs After 48 hrs. 99.92 100.07 100.11. 0.55 0.40 0.36. 0.42. -. % RSD. 1.31 1.33. Acceptance Criteria: ≤ 2.0% change from initial. Page 231.
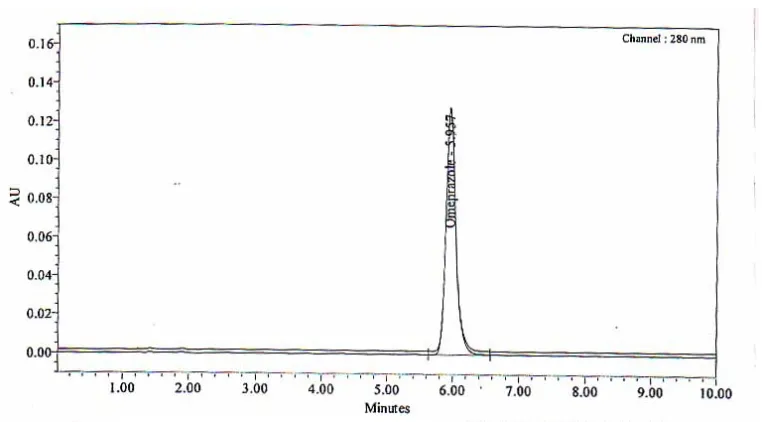
(6) Anisuzzaman Sharif Md et al. IRJP 2012, 3 (7) Figure-1: Graphical Representation of Linearity Correlation 1.0000 Coefficient, R. Linearity Curve of Esomeprazole Magnesium 2500000. 2000000. 1916998. y = 12744x + 634.83. 1658616 1532850. 1500000. Area. 1270226 1143045 1013319. 1000000. 640525. 500000. 381825 260444 128821. 0 0. 20. 40. 60. 80. 100. 120. 140. 160. 180. Concentration (%). Figure 2: Representative HPLC chromatogram of Esomeprazole. Source of support: Nil, Conflict of interest: None Declared. Page 232.
(7)
Figure
Related documents
The results of the microbiome analyses of datasets 1 and 2 are distinctly different, as the bacterial gen- era with the highest read numbers in datasets 1 and 2, especially in
Department; PORALG: President ’ s Office - Regional Administration and Local Government; PPP: Public-Private Partnership; PPRA: Public Procurement Regulatory Authority; PV:
This study aimed to develop and pilot test an educa- tional video containing information regarding the in- formed consent process for trauma patients undergoing surgery, develop
Automated epileptic seizures detection using multi-features and multilayer perceptron neural network
This study provides a multi-channel EEG analysis for the detection of epileptic seizures using PSD, entropy, Teager energy, and MLPNN classifier.. Initially, EEG signals
suis cells were detected on PAECs incubated with the negative control preparation (Figure 5d).. To assess whether the presence
In this paper we describe how a participatory, multi- method, continuous informed consent process developed by researchers, study participants and community stake- holders during
However, when survival data for patients with non-metastatic gastric malignancy (stages 1A-3B) is analysed this shows that despite com- parable disease stage, patients who present as
Towards this end, concept maps are analysed as directed and weighted networks, where nodes are concepts and links represent different types of connections between concepts, and
