Growth and Development in Term Infants Fed Long-Chain
Polyunsaturated Fatty Acids: A Double-Masked, Randomized, Parallel,
Prospective, Multivariate Study
Nancy Auestad, PhD*; Robin Halter, MA*; Robert T. Hall, MD‡; Mark Blatter, MD§;
Margaret L. Bogle, PhD
储
; Wesley Burks, MD
储
; Julie R. Erickson, PhD, RN¶; Kathleen M. Fitzgerald, PhD‡;
Velma Dobson, PhD¶; Sheila M. Innis, PhD, RDN#; Lynn T. Singer, PhD**; Michael B. Montalto, PhD*;
Joan R. Jacobs, MA*; Wenzi Qiu, PhD*; and Marc H. Bornstein, PhD‡‡
ABSTRACT. Objective. To evaluate the effects of di-etary intake of the long-chain polyunsaturated fatty ac-ids, arachidonic acid (AA), and docosahexaenoic acid (DHA) on multiple indices of infant growth and devel-opment.
Design. A double-masked, randomized, parallel trial was conducted with term infants fed formulas with or without AAⴙDHA for 1 year (Nⴝ239). Reference groups of breastfed infants (Nⴝ165) weaned to formulas with and without AAⴙDHA were also studied. Infants in the formula groups were randomized at<9 days of age to a control formula with no AA or DHA (nⴝ77) or 1 of 2 otherwise identical formulas containing AAⴙDHA (AA, 0.46% and DHA, 0.14% of total fatty acids) from either egg-derived triglyceride (egg-DTG [nⴝ80]) or fish oil and fungal oil (fish/fungal [nⴝ 82]) at levels similar to the average in breast milk samples as measured in the refer-ence group. All formulas contained 50% of energy from fat with the essential dietary fatty acids, linoleic acid (20% fatty acids) and ␣-linolenic acid (2% fatty acids). The main study outcomes were AA and DHA levels in plasma and red blood cells, and multiple measures of infant development at multiple ages from birth to 14 months: growth, visual acuity, information processing, general development, language, and temperament.
Results. AA and DHA levels in plasma and red cells were higher in AAⴙDHA-supplemented groups than in the control formula group and comparable to those in reference groups. No developmental test results distin-guished these groups. Expected differences in family demographics associated with breastfeeding were found,
but no advantages to breastfeeding on any of the devel-opmental outcome demonstrated.
Conclusions. These findings do not support adding AAⴙDHA to formulas containing 10% energy as linoleic acid and 1% energy as ␣-linolenic acid to enhance growth, visual acuity, information processing, general development, language, or temperament in healthy, term infants during the first 14 months after birth.Pediatrics
2001;108:372–381;infant development, breast feeding, in-fant formula, long-chain polyunsaturated fatty acids, do-cosahexaenoic acid.
ABBREVIATIONS. AA, arachidonic acid; DHA, docosahexaenoic acid; egg-DTG, egg-derived triglycerides; SD, standard deviation.
A
re there demonstrable benefits for infant
de-velopment from feeding infant formulas
con-taining the long-chain polyunsaturated fatty
acids arachidonic acid (AA) and docosahexaenoic
acid (DHA)? Some studies comparing children who
were breastfed (BF) with children who were fed
in-fant formula have reported an association between
breastfeeding and intellectual development.
1– 4In
these studies, however, children were not
random-ized to breast- or formula-feeding, and differences
between these cohorts
5–7other than diet may explain
the findings. For example, parents of BF infants often
have a higher socioeconomic status and more years
of education,
6and lifestyle choices known to affect
cognitive development, such as cigarette smoking,
may differ.
7Several studies have evaluated whether
supplementing formulas for term
8 –17or preterm
18 –21infants with DHA or both AA and DHA increases
the circulating levels of these fatty acids and
en-hances visual and cognitive development. Although
infants fed human milk or formulas supplemented
with DHA or AA and DHA consistently have higher
plasma and red blood cell levels of DHA or AA and
DHA than infants fed unsupplemented formulas,
findings of differences on visual and cognitive tests
have been inconsistent in the studies with term
in-fants. Associations between higher levels of DHA in
plasma or red blood cells and enhanced visual and
cognitive development, thus, have not been
estab-lished. Unfortunately, these comparisons have
like-wise been confounded by uncontrolled variation in
From the *Ross Products Division, Abbott Labs, Columbus, Ohio; ‡Univer-sity of Missouri, Kansas City and Children’s Mercy Hospital, Kansas City, Missouri; §Pittsburgh Pediatric Research, Pittsburgh, Pennsylvania;储 Uni-versity of Arkansas for Medical Sciences and Arkansas Children’s Hospital, Little Rock, Arkansas; ¶University of Arizona, Tucson, Arizona; #Univer-sity of British Columbia, Vancouver, Canada; **Rainbow Babies & Chil-dren’s Hospital, Cleveland, Ohio; and ‡‡NICHD, National Institutes of Health, Bethesda, Maryland.
Robin Halter is currently with Neurocrine Bioscience, San Diego, California. Dr Bogle is currently with the United States Department of Agriculture, Little Rock, Arkansas.
Dr Qiu is currently with Organon, Inc, West Orange, New Jersey. This work was presented as an abstract in May 1999 (Pediatr Res.1999;45: 276A).
Received for publication Nov 8, 1999; accepted Jan 19, 2001.
Reprint requests to (N.A.) Ross Products Division, Abbott Laboratories, 625 Cleveland Ave, Columbus, OH 43215. E-mail: nancy.auestad@ rossnutrition.com
sample size, differences in formula composition (eg,
amounts and ratios of the essential dietary fatty acids
[linoleic acid,
␣
-linolenic acid] or other nutrients
[iron]), the source of DHA- and AA-enriched fats or
oils studied, the amounts and ratios of DHA and AA,
the tests and testing procedures used to evaluate
child visual and developmental status, and the age(s)
at which children have been tested.
22Infants can form AA and DHA from their essential
dietary fatty acid precursors, linoleic acid and
␣
-lin-olenic acid,
23–25which are present in formulas but in
varying amounts. Therefore, it is plausible that
AA-and DHA-supplementation may not be necessary in
the infant diet. Evidence has been published
11,12,26 –28suggesting that formulas containing a minimum of
1.75% fatty acids as
␣
-linolenic acid and a ratio of
linoleic to
␣
-linolenic acids of 5:1 to 15:1 may
ade-quately support visual and cognitive development,
despite lower circulating levels of AA and DHA.
We conducted a comprehensive double-masked,
randomized, parallel, prospective, and adequately
powered multivariate study of infants fed a standard
unsupplemented formula or 1 of 2 formulas
supple-mented with AA and DHA from different sources to
help bring clarity to the controversial question about
benefits to infant development from dietary
supple-mentation. In comparison with published studies
9 –12available during the design phase of the trial, the
sample size was larger, multiple domains of
neuro-development were evaluated at multiple timepoints,
infant temperament was assessed, and two sources
of AA and DHA were studied concurrently. In
ad-dition to comparisons among infants fed formula
with or without AA
⫹
DHA throughout the first year,
the present study also evaluated infants who were
BF for the first 3 months after which formula with or
without AA
⫹
DHA may have been fed as a
supple-ment to breast milk or as a weaning formula.
Com-parisons between formula-fed and BF infants are also
provided.
METHODS Participants
This 12-month, double-masked, parallel, prospective feeding study enlisted 2 cohorts of term infants, BF and formula-fed. Infants were recruited from hospitals and pediatric practices at 4 sites in the United States: Kansas City, Missouri; Little Rock, Arkansas; Pittsburgh, Pennsylvania; and Tucson, Arizona. The study was approved by institutional review boards at the respec-tive sites. Infant inclusion criteria included: good health, term status (gestational age 37– 42 weeks), eitherⱕ9 days of age (for-mula groups) orⱕ11 days of age and currently BF (BF groups), birth weightⱖ2500 g, 5-minute Apgar scoreⱖ7, ability to tolerate a milk-based formula or breast milk, parent or guardian agree-ment to feed the assigned study formula ad libitum according to the study design, and voluntary written informed consent. Infants were ineligible if they had evidence of significant cardiac, respi-ratory, ophthalmologic, gastrointestinal, hematologic, or meta-bolic disease; milk-protein allergy; or a maternal medical history known to have proven adverse effects on the fetus (eg, gestational diabetes if the infant’s birth weight wasⱖ4150 g), tuberculosis, human immunodeficiency virus infection, perinatal infections, or substance abuse. Infants who were small-for-gestational-age (⬍10th percentile) and large-for-gestational-age (⬎90th percentile) were not excluded. The feeding period was to 12 months of age, and data were collected through 14 months of age.
Formulas
At enrollment, formula-fed infants were randomized to a con-trol formula or 1 of 2 formulas supplemented with DHA and AA: 1) fish oil (Mochida International Co, Ltd, Tokyo, Japan) and fungal oil (Suntory Ltd, Osaka, Japan; fish/fungal) or 2) egg-derived triglyceride (egg-DTG, Eastman Chemical Co, Kingsport, TN). All formulas were liquid ready-to-feed formulas with (per L): 14.3 to 15.0 g protein; 72.4 to 74.8 g carbohydrate; 35.9 to 37.2 g fat; and 670 to 694 calories. The protein was from nonfat milk and whey protein concentrate, and the oil blend consisted of high-oleic safflower, coconut, and soy oils with or without the AA- and DHA-enriched oils. The study formulas were indistinguishable in appearance and odor and were coded to mask their identity. All formulas contained the essential dietary fatty acids,␣-linolenic acid (2% fatty acids) and linoleic acid (20% fatty acids; Table 1), and met or exceeded nutrient levels established by the American Academy of Pediatrics Committee on Nutrition29and regulated by the Infant Formula Act of 1980 as amended in 1986.
The levels of DHA and AA in the supplemented formulas were chosen based on previous studies10,11,30and are similar to recently published levels in human milk in US women.31,32 Infants fed
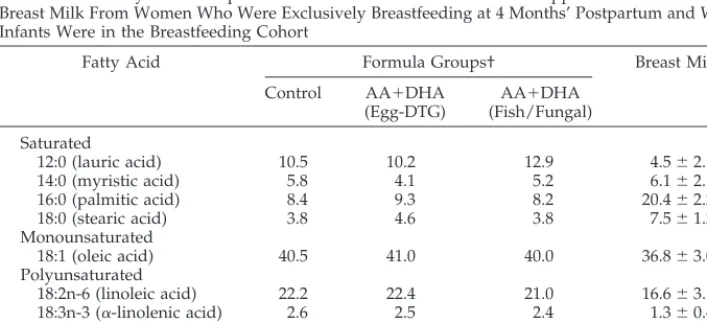
TABLE 1. Fatty Acid Composition* of the Control and AA⫹DHA-Supplemented Formulas and Breast Milk From Women Who Were Exclusively Breastfeeding at 4 Months’ Postpartum and Whose Infants Were in the Breastfeeding Cohort
Fatty Acid Formula Groups† Breast Milk‡
Control AA⫹DHA (Egg-DTG)
AA⫹DHA (Fish/Fungal) Saturated
12:0 (lauric acid) 10.5 10.2 12.9 4.5⫾2.1§ 14:0 (myristic acid) 5.8 4.1 5.2 6.1⫾2.1 16:0 (palmitic acid) 8.4 9.3 8.2 20.4⫾2.2
18:0 (stearic acid) 3.8 4.6 3.8 7.5⫾1.2
Monounsaturated
18:1 (oleic acid) 40.5 41.0 40.0 36.8⫾3.0 Polyunsaturated
18:2n-6 (linoleic acid) 22.2 22.4 21.0 16.6⫾3.1 18:3n-3 (␣-linolenic acid) 2.6 2.5 2.4 1.3⫾0.4
20:4n-6 (AA) ND 0.45 0.46 0.51⫾0.13
20:5n-3 (EPA) ND ND ⱕ0.04 0.05⫾0.03
22:6n-3 (DHA) ND 0.14 0.13 0.12⫾0.07
formulas with 0.10 to 0.15 g/100 g (%) fatty acids as DHA and about 0.4% as AA had plasma and red blood cell levels of DHA and AA most closely matching those of BF infants in the United States.10,11,30In the present study, both supplemented formulas contained DHA and AA at 0.13% and 0.45% fatty acids, respec-tively (Table 1). Eicosapentaenoic acid (20:5n-3) was not detectable in the egg-DTG formula and wasⱕ0.04% in the formula with fish oil (fish/fungal). Nine percent of the fat blend in the egg-DTG formula was egg-DTG. In the fish/fungal formula, 0.7% and 1.7% of the fat blend was fish and fungal oils, respectively. Coconut oil levels were reduced accordingly in both formulas.
Design
Infants in the 3 formula groups were randomized within 9 days after birth. Separate randomization schedules for each site were stratified by gender and were computer-generated using a ran-dom permuted blocks algorithm. The study formulas were fed ad libitum as the sole source of nutrition for 4 months and as the exclusive milk beverage to 12 months. Infants in the 2 BF groups were randomized to the control (BF/control) or the AA⫹DHA (egg-DTG; BF/AA⫹DHA) formulas within 11 days after birth and exclusively BF for at least 3 months. Although not encouraged, a small percentage of BF infants occasionally were fed small amounts of supplemental formula, but this was limited to⬍16 oz (480 mL) per week. The assigned study formulas were not pro-vided nor fed until after 3 months of exclusive breastfeeding, and only if the parent(s) chose to provide supplemental formula or to wean to formula feeding. All infants were allowed water ad libitum, solid foods after 4 months of age, and alternate formulas for up to 5 days if recommended by a primary care physician or the investigator.
Study visits after enrollment took place at 1, 2, 4, 6, 9, and 12 months with a mail-in questionnaire at 14 months. A window of⫾
5 days was permitted for the first 5 visits; the 12- and 14-month visits had a window of⫾7 days. Infant and family demographic information were obtained at the enrollment visit. Formula dispo-sition records, parental records of formula intake at designated intervals throughout the study, and parent interviews at each study visit were used to encourage and monitor compliance with feeding the assigned study formula or human milk.
Red Blood Cell Fatty Acid Analysis
The fatty acid composition in plasma and the phosphatidylcho-line and phosphatidylethanolamine membrane fractions of red blood cells were determined from a subset of infants (n⫽23– 41 per feeding group) at the 4- and 12-month visits. Blood (4 mL) was drawn by venipuncture by a physician or registered phlebotomist from infants whose parents agreed to the procedure. Red cells were stored at⫺20°C, shipped on dry ice every 2 to 3 months to a central laboratory (Dr S. M. Innis, University of British Colum-bia, Vancouver, Canada), verified frozen on arrival, and stored at
⫺70°C until analyzed for fatty acid composition.26,30
Breast Milk Fatty Acids
A sample of breast milk was provided by a subset of mothers who were still exclusively breastfeeding at the 4-month visit (n⫽
43). After the infant had nursed for about 5 minutes, the mother removed the infant from the breast and expressed a midfeeding sample into a clean infant bottle, transferred⬃3 mL to a vial, placed it in a sealable plastic vial, and stored in the home freezer until the study visit. The procedures for collection and storage of milk samples were consistent with recommendations by Jensen et al33and those reported by others.31The human milk samples were stored at⫺20° or⫺70°C at the study site, shipped on dry ice to a central laboratory (Dr S. M. Innis, University of British Columbia, Vancouver, Canada), verified to be frozen on arrival, and stored at
⫺70°C before being analyzed for fatty acid composition as de-scribed above for red blood cell fatty acids. The methodologies for determining the fatty acid levels in breast milk samples and the infant formulas were similar.
Standardization of Developmental Procedures
Testing and scoring for all developmental measures and clinical procedures were standardized across all sites, and adherence to testing and scoring procedures was monitored throughout the study to assure reliability. Administrators and coders for the
developmental testing were trained in proper procedures, had extensive experience in child development, and met certification requirements. All testers were masked to infant feeding groups.
Testers who administered the acuity card procedure were trained and certified (Dr V. Dobson, Tucson, Arizona; Dr L. Mayer, Boston, Massachusetts) before testing infants. Drs Dobson and Mayer conducted site visits during the study to monitor administration and scoring procedures. One hundred eighty-five infants, who represented approximately 1 of every 4 infants in the study plus additional nonstudy infants, were tested by 2 trained testers at each site to determine reliability. Agreement between the first and second tester was within 1 octave forⱖ95% of tests and within 0.5 octave forⱖ70% of the tests (Kendall’s⫽0.79;P⬍
.0001).
Procedures for administration of the Bayley Scales of Infant Development and the Fagan Test were coordinated centrally (Dr R. Arendt, Cleveland, Ohio). A workshop was held to standardize testing procedures (Drs L. Singer, R. Arendt, C. Segal, Cleveland, Ohio), and a videotape of the testing procedures was provided to all testers. Testers who administered the Fagan Test were trained and certified (Drs L. Singer, E. Shaver, Cleveland, Ohio) before testing infants. Approximately 1 out of every 10 Bayley test ses-sions at the 6- and 12-month time points were videotaped, and the videotapes were scored centrally (Dr R. Arendt, Cleveland, Ohio). The average percent agreement among testers for the Bayley men-tal index was 77% and 91% at the 6- and 12-months, respectively, and for the Bayley motor index was 87% and 91%, respectively.
Growth
Weight, length, and head circumference were measured at enrollment and 1, 2, 4, 6, 9, and 12 months using standardized procedures (Guide to Growth Assessment of Infants in Clinical Studies34).
Visual Acuity
Visual acuity was assessed using the Teller Acuity Card Pro-cedure (Vistech Inc, Dayton, OH35) at 2, 4, 6, and 12 months. Infants were shown a series of 25.5⫻51-cm cards with black and white stripes varying in spatial frequency (stripe width) by half-octave steps. One half-octave is a halving or doubling of spatial fre-quency. The finest grating (stripe width) to which the infant showed a consistent fixation response is the visual acuity thresh-old in cycles/degree with the variance (SD) in octaves.
Information Processing
The Fagan Test of Infant Intelligence (Infantest Corporation, Cleveland, OH36) was administered at 6 and 9 months. During a familiarization period, a face stimulus was shown until the infant accumulated a predetermined amount of looking time; during the subsequent test period, the familiar face stimulus was shown concurrently with a novel face stimulus. The amount of looking time spent on each stimulus was recorded (IBM Thinkpad), and “novelty preference” (percentage of total looking time spent look-ing at the novel stimulus durlook-ing the test phase averaged across 10 tests) was computed. In addition, mean duration of looking time, construed as a measure of efficiency of information processing, was computed for both the familiarization and test periods by dividing the total looking time by the number of looks averaged across 10 tests.37,38
General Developmental Level
The Bayley Scales of Infant Development (Psychological Cor-poration, 2nd ed, San Antonio, TX39) were administered at 6 and 12 months to assess motor and cognitive development (Psychomo-tor Developmental Index; Mental Developmental Index, respec-tively).
Language
Temperament
The Infant Behavior Questionnaire41 was completed by the parent(s) at 6 and 12 months. This standardized 94-item question-naire measures activity level, distress to novel stimuli, distress to limitations, soothability, smiling and laughter, and duration of orienting. Infant temperament was also assessed using the Behav-ior Rating Scale of the Bayley Scales39, an index of the examiner’s overall impression of the child’s behavior.
Statistical Methods
Power analysis estimated that 54 infants (27 male, 27 female) in each of the 3 randomized formula groups were needed to detect a 1 SD difference in growth for each gender with 90% power. An additional sample size estimate was based on the results of a previous study showing lower vocabulary scores in 14-month-old infants fed a DHA-supplemented formula than in infants fed human milk or a control formula, respectively12. This power anal-ysis estimated that 47 infants per group were needed to detect a 0.75 SD difference in vocabulary scores with 90% power. Blood samples from approximately 27 infants per group were needed to detect a 1 SD difference (90% power) in the levels of the fatty acids, AA and DHA.
All analyses controlled for site (ie, site was used as a covariate) to minimize the potential confounding effect of intersite variabil-ity. Comparisons among the 3 formula groups and between the 2 BF groups were done twice, once with no additional covariates and once with additional covariates selected a priori. Analyses reported are without the additional covariates; in all cases covari-ate analyses showed similar results. Ccovari-ategorical variables were analyzed using2or Cochran-Mantel-Haenszel tests and contin-uous variables by analysis of variance (analysis of variance) and/or analysis of covariance. Repeated measures analyses were used for data collected at⬎1 time period. Post hoc comparisons of formula-fed and BF infants were done using the BF and corre-sponding formula groups to provide the greatest power to detect differences between these cohorts.
RESULTS
Two hundred ninety-four (73%) of the 404 enrolled
infants completed the study. The most common
rea-sons for exiting the study early were reported
intol-erance for the formula groups (
n
⫽
16, 13, and 14 for
the control, egg-DTG, and fish/fungal groups,
re-spectively) and cessation of breastfeeding and/or
formula feedings started before 3 months for the BF
groups (
n
⫽
10 and 9 for the BF/control and BF/
AA
⫹
DHA groups, respectively). The distribution of
infants across groups, the primary reasons for early
exit, and the numbers of days in the study did not
differ across groups for those who exited early.
Infant and family sociodemographic
characteris-tics were not different among the formula groups
or between the BF groups, with the exception of
inconsequential statistical differences between the
BF/control and BF/AA
⫹
DHA groups for infant
ges-tational age (39.2
⫾
1.2 vs 39.6
⫾
1.3 weeks,
respec-tively) and for maternal age (29.1
⫾
5.2 vs 30.8
⫾
4.6
years, respectively). The demographic characteristics
of the study population as a whole are generally
similar to those described for the US population.
42The average daily caloric intake of formula and
mea-sures of formula tolerance (eg, frequency of spitting
up and/or vomiting; consistency of stools) did not
differ among groups within each cohort (data not
shown).
Comparisons between the formula-fed and BF
groups showed the formula groups with a larger
percentage of mothers having no postsecondary
ed-ucation (39, 33, 21, and 19% in the control, AA
⫹
DHA
[egg-DTG], BF/control, and BF/AA⫹DHA groups,
respectively;
P
⫽
.024) and a higher prevalence of
smoking (Table 2). Although breastfeeding rates in
the present study declined after 3 months, the rates
were higher than the national averages in the
mid-1990s. In the present study, 36% of mothers were
exclusively breastfeeding at 6 months with another
30% providing breast milk for some of the daily
feedings. The national breastfeeding rates are about
10% and 15%, respectively, for mothers with similar
demographics
43(AS Ryan, personal communication).
AA and DHA
The average levels of AA and DHA in breast milk
at 4 months were 0.51% (range: 0.27%– 0.93%) and
0.12% (range: 0.04%– 0.34%), respectively. Infants fed
the AA⫹DHA supplemented formulas, independent
of the source (egg-DTG or fish/fungal), had
signifi-cantly higher levels of AA and DHA in red blood cell
phospholipids than those fed the control formula
(
P
⬍
.0001; Table 3). In the BF groups, red blood cell
phospholipid levels of AA and DHA were not
dif-ferent at 4 months, but at 12 months infants fed the
AA
⫹
DHA formula had about 40% higher levels of
DHA than those fed the control formula (
P
⫽
.03).
Comparisons between the BF and corresponding
for-mula groups found lower AA and DHA levels in red
blood cells of infants fed the unsupplemented
con-trol formula than those fed the supplemented
for-mula and/or human milk (Table 3).
Growth
There were no overall or gender specific
differ-ences for increases in weight, length, or head
circum-ference among groups during the 12-month study
(Fig 1). Weight gain from enrollment to 12 months
was 17.7
⫾
2.6, 17.8
⫾
2.4, and 17.3
⫾
2.6 g/d (
P
⬎
.05) for infants fed the control, AA
⫹
DHA
(fish/fun-gal), and AA⫹DHA (egg-DTG) formulas and 17.4
⫾
2.6. and 18.0
⫾
3.1 g/d (
P
⬎
.05) for infants in the
BF/control and BF/AA⫹DHA groups, respectively.
Weight gain for male infants between enrollment
and 4 months, but not between enrollment and 12
months, was greater for the AA
⫹
DHA (fish/fungal)
group than the control group (31.4
⫾
4.6 g/d and
27.8
⫾
4.2, respectively;
P
⬍
.05). Weight gain for
infants fed AA⫹DHA from egg-DTG (29.1
⫾
5.1
g/d) was not greater than the control group over the
same period. Similarly, there were no differences in
length or head circumference gains between
enroll-ment and 4 months. Gains in weight, length, and
head circumference between 0 and 4 months and 0
and 12 months were not different between the BF/
control and BF/AA
⫹
DHA groups. No differences in
growth between the BF and corresponding formula
groups were found.
Visual Acuity
Visual acuity results (cyc/deg) were
log-trans-formed according to convention
44before analysis,
and the geometric mean values (cyc/deg) are
re-ported with SD in octaves. Visual acuity was in the
normal range for each group at all ages tested
45,46infant formula with AA⫹DHA (Fig 2). Visual acuity
was not different between the BF and corresponding
formula groups.
Information Processing
Infant information processing, assessed as novelty
preference, was also in the normal range at the 2 ages
tested.
36,47,48Scores did not differ between infants in
the formula control and AA⫹DHA groups or
be-tween BF/control and BF/AA
⫹
DHA groups (Table
4). Look duration during the familiarization and
test-ing periods, thought to index the rate of information
processing,
37,38similarly did not differ in relation to
adding AA and DHA to formula (data not shown).
Novelty preference and look duration also were not
different between the BF and corresponding formula
groups.
Bayley Scales
Infants in all groups scored in the normal ranges
on both the psychomotor and mental development
indices of the Bayley Scales.
39Neither index at 6 or 12
months differed among the formula control and the
AA
⫹
DHA groups or between the BF/control and
BF/AA
⫹
DHA groups (Table 4). No differences
emerged in the percentages of infants who scored
⬍
70 or 71 to 84 (data not shown). There were no
differences in mental or motor scales between the BF
and corresponding formula groups.
Language
Children scored in the normal range of the
vocab-ulary comprehension and expression at the ages
test-ed.
40Vocabulary comprehension did not differ
among the three formula groups or between the BF
groups, but at 14 months, infants fed the AA
⫹
DHA
(fish/fungal) formula had a slightly, but
signifi-cantly, higher vocabulary expression score than
those fed the AA
⫹
DHA (egg-DTG) formula (Table
4). However, neither AA
⫹
DHA group was
signifi-cantly different from the control formula group, and
there were no differences between the BF and
corre-sponding formula groups.
TABLE 2. Infant and Family Sociodemographic Characteristics
Cohort Formula Groups Breastfed Groups
Control AA⫹DHA (Egg-DTG)
AA⫹DHA (Fish/Fungal)
Control AA⫹DHA (Egg-DTG)
n 77 80 82 82 83
Infant characteristics
Birth weight, kg 3.45⫾0.44 3.39⫾0.47 3.41⫾0.41 3.49⫾0.48 3.54⫾0.41 Birth length, cm 50.8⫾2.5 50.3⫾2.6 50.6⫾2.1 50.9⫾2.4 51.1⫾2.6 Gestational age, wks* 39.4⫾1.2 39.0⫾1.3 39.3⫾1.2 39.2⫾1.2† 39.6⫾1.3† Gestational appropriateness,n(%)
AGA 66 (85.7) 69 (86.3) 71 (86.6) 72 (87.8) 69 (83.1)
SGA 2 (2.6) 2 (2.5) 0 1 (1.2) 1 (1.2)
LGA 8 (10.4) 9 (11.0) 8 (9.8) 8 (9.8) 13 (15.7)
Unknown 1 (1.3) 0 3 (3.7) 1 (1.2) 0
Apgar, 5 min 9.1⫾0.4 9.1⫾0.4 9.1⫾0.5 9.1⫾0.4 9.1⫾0.7 Males,n(%) 37 (48.1) 39 (48.7) 40 (48.8) 42 (51.2) 43 (51.8) Birth order,n(%)
1 30 (39.0) 22 (27.5) 29 (35.4) 32 (39.0) 32 (38.6)
2 25 (32.5) 36 (45.0) 38 (47.5) 27 (32.9) 30 (36.1)
ⱖ3 22 (28.6) 22 (27.5) 14 (17.1) 23 (28.0) 21 (25.3)
Ethnicity,n(%)
European American 61 (79.2) 70 (87.5) 72 (87.8) 67 (80.7) 74 (90.2) African American 3 (3.9) 2 (2.5) 3 (3.7) 4 (4.8) 0 (0.0) Hispanic American 2 (2.6) 4 (5.0) 4 (4.8) 6 (7.2) 3 (3.7)
Asian American 1 (1.3) 0 (0.0) 0 (0.0) 0 (0.0) 0 (0.0)
Other/missing‡ 10 (13.0) 4 (5.0) 3 (3.7) 6 (7.2) 5 (6.1) Family characteristics
Maternal age, y§ 28.1⫾5.9 29.0⫾5.1 29.2⫾5.0 29.1⫾5.2† 30.8⫾4.6† Smoking,n(%)
During pregnancy㛳 12 (15.6) 16 (20.0) 15 (18.5) 7 (8.5) 6 (7.2) In household¶ 16 (20.8) 26 (32.5) 14 (17.3) 11 (13.4) 7 (8.4) Parental education, y
Mother 13.7⫾2.1 14.2⫾1.9 14.1⫾2.5 15.1⫾2.3 15.3⫾2.4 Father 13.8⫾2.0 14.0⫾2.1 14.6⫾2.1 15.0⫾2.4 15.3⫾2.6 Maternal marital status,n(%)
Married 60 (77.9) 63 (78.6) 68 (82.9) 70 (85.4) 80 (96.3)
Single 14 (18.2) 15 (18.8) 14 (17.0) 10 (12.2) 3 (3.6)
Separated-divorced 3 (3.9) 2 (2.5) 0 2 (2.4) 0
Values are mean⫾SD unless noted otherwise. Within each cohort, values with different superscripts are statistically different. AGA indicates appropriate-for-gestational age; SGA, small-for-gestational age (⬍10th percentile); LGA, large-for-gestational age (⬎90th percentile).
†P⬍.05.
Temperament
No differences emerged among the groups for 5
of the 6 dimensions of the Infant Behavior
Question-naire (Table 4). The smiling and laughter score for
the control formula group was slightly but
statisti-cally significantly higher than for the AA
⫹
DHA
(Egg-DTG) formula group. No differences emerged
on any score between the BF/control and the BF/
AA⫹DHA groups. The percentages of infants with
Behavior Rating Scale facet scores (motor quality,
orientation/engagement, emotional regulation) on
the Bayley Scales at or below the lowest 10th
percen-tile of the reference population did not differ among
any groups in relation to AA
⫹
DHA
supplementa-tion (data not shown). No differences emerged
be-tween the BF and corresponding formula groups on
the dimensions of Infant Behavior Questionnaire or
on the facet scores of the Bayley Scales.
DISCUSSION
This is the largest randomized, prospective,
longi-tudinal,
and
multivariate
study
to
compare
AA⫹DHA-supplemented formulas with an
un-supplemented control formula fed to term infants for
the first year after birth. Infants in all groups
devel-oped normally on multiple indices of development
over the first 14 months after birth. AA⫹DHA
sup-plementation predictably increased the levels of
these fatty acids in plasma and red cells, but multiple
measures of growth, visual acuity, information
pro-cessing, general development, language, and
tem-perament assessed using masked clinical tests and by
parent report instruments through 14 months of age
were not different among infants who were fed
AA
⫹
DHA-supplemented and control formulas. The
variance in the visual and developmental tests was
not increased with multiple testers at multiple sites,
evidence that the sensitivity of the tests was not
compromised in this multicenter trial. The variances
were those expected
36,39,40with the standard
devia-tions for the visual acuity and Bayley Scales
assess-ments similar to
10,13,16,26 –28or less than
15,17those
reported in similar single-center studies. The
com-parisons in this trial were adequately powered, and
the overall patterns of results were the same when
covariates with high potential to influence
develop-mental outcomes were included in the statistical
models.
The visual and neurodevelopmental results of the
present study are consistent with those of a previous
study for which the control formula was the same as
in this study except that it did not contain added
nucleotides.
11,12The levels of AA and DHA in milk
from women in the present study were also similar
to those previously reported by many,
10 –12,31–32but
not all,
13,16contemporaneous studies in the United
States including samples from Portland, Oregon
31,32where DHA levels would be expected to be higher.
49Furthermore, the demographics of the sample
stud-ied here (Table 2) were generally comparable to the
TABLE 3. AA and DHA Levels in Red Blood Cell Phospholipids (g/100 g) in Infants Fed FormulasWith or Without AA⫹DHA or Breastfed for at Least the First 3 Months After Which Formula With or Without AA⫹DHA May Have Been Fed as a Supplement or Weaning Formula
Formula Groups Breastfed Groups Control AA⫹DHA
(Egg-DTG)
AA⫹DHA (Fish/Fungal)
Control AA⫹DHA (Egg-DTG) Red blood cell phosphatidylethanolamine
AA (20:4n-6)†‡
4 mo 23.3⫾2.1 25.4⫾1.8 25.9⫾2.1 26.7⫾3.3 27.5⫾2.3 12 mo 23.2⫾1.9 25.0⫾2.9 25.7⫾2.4 25.1⫾2.6 25.1⫾2.7
Significance* a b b NS
DHA (22:6n-3)†‡
4 mo 4.3⫾0.7 6.5⫾1.1 7.0⫾0.8 6.9⫾1.6 6.7⫾1.2 12 mo 3.2⫾0.6 6.3⫾1.2 6.6⫾0.9 4.3⫾1.4 5.6⫾1.2
Significance a b b NS
Red blood cell phosphatidylcholine AA (20:4n-6)†‡
4 mo 5.0⫾0.9 7.8⫾1.0 8.0⫾1.0 7.8⫾1.9 8.3⫾1.3 12 mo 5.1⫾1.3 7.1⫾1.4 7.6⫾1.9 6.2⫾1.5 6.7⫾1.6
Significance* a b b NS
DHA (22:6n-3)†‡
4 mo 0.9⫾0.2 1.8⫾0.4 1.9⫾0.3 1.8⫾0.7 1.7⫾0.4 12 mo 0.8⫾0.3 1.7⫾0.5 1.9⫾0.5 1.1⫾0.5 1.5⫾0.5
Significance* a b b d e
NS indicates not significantly different.
Values are mean ⫾SD. Sample sizes (4, 12 months) for the control, AA⫹DHA (egg-DTG), and AA⫹DHA (fish/fungal) formula groups were (32, 22), (33, 26), and (30, 32), respectively, and for the BF/control and BF/AA⫹DHA groups were (41, 31) and (40, 38), respectively.
US population,
42thus allowing us to generalize the
results to healthy term infants in the US.
Published studies in which formulas containing
sources of DHA or both AA and DHA were fed to
term infants have reported mixed outcomes in terms
of the potential advantages of supplementation.
8 –17Several explanations for this variance are possible,
including differences in the amount of the
␣
-linolenic
acid (precursor to DHA), the source or amount of the
AA- and/or DHA-enriched ingredient (eg, fish oil,
egg lipid, algal oil, fungal oil), other differences in
formula composition, the outcomes studied, the
test-ing procedures used, the number of months of
for-mula feeding, and/or the number of infants studied.
Additionally, the influence of genetic and specific
socioenvironmental factors on developmental
mea-sures may be greater than previously recognized.
50,51This lack of consistency in the extant literature
to-Fig 1. Weight, length, and head circumference inhealthy term infants fed formulas with or without AA⫹DHA from enrollment (E; median, 2 days of age) to 12 months of age. A) Males. B) Females.嘷, control formula; 䡺, AA⫹DHA (egg-DTG); ‚, AA⫹DHA (fish/fungal). Values are mean⫾SD. No differences among groups for overall growth by repeated-measures analyses were found.
Fig 2. Visual acuity measured by the acu-ity card procedure for infants fed formulas with or without AA⫹DHA or BF for at least the first 3 months after which formula with or without AA⫹DHA may have been fed as a supplement or weaning formula. A) Formula groups: E, control formula; ▫,
AA⫹DHA (egg-DTG) supplemented for-mula. ‚, AA⫹DHA (fish/fungal)
supple-mented formula. B) BF groups:F,
BF/con-trol formula;f, BF/AA⫹DHA (egg-DTG)
gether with the comprehensiveness of the present
report casts doubt on any certain advantage of
add-ing DHA and AA to infant formula.
The fact that no consistent differences emerged for
any of several diverse measures of infant
develop-ment and functioning between infants fed the
sup-plemented formulas also suggests that differences in
the triglyceride fatty acid distribution between fish
and fungal compared with egg-DTG are of little or
no consequence, at least for the outcomes studied.
The absence of significant and/or consistent
ef-fects of the AA
⫹
DHA formulas on multiple
mea-sures of general development, including growth,
vi-sual acuity, information processing, language, and
temperament over the first 14 months after birth,
together with the fact that all assessments, test
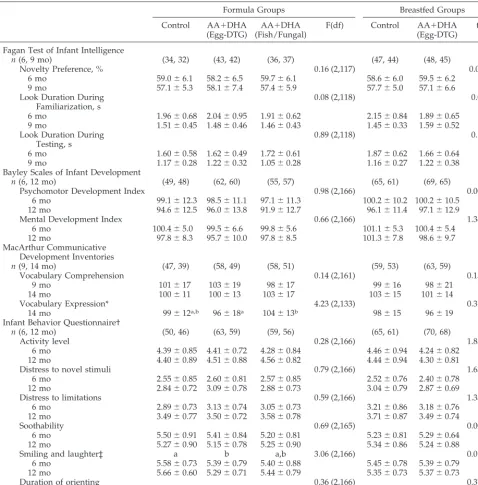
re-TABLE 4. Development, Cognition, Vocabulary, and Temperament in Infants Fed Formulas With or Without AA⫹DHA or Breastfed for at Least the First 3 Months After Which Formula With or Without AA⫹DHA May Have Been Fed as a Supplement or Weaning FormulaFormula Groups Breastfed Groups Control AA⫹DHA
(Egg-DTG)
AA⫹DHA (Fish/Fungal)
F(df) Control AA⫹DHA (Egg-DTG)
t(df)
Fagan Test of Infant Intelligence
n(6, 9 mo) (34, 32) (43, 42) (36, 37) (47, 44) (48, 45)
Novelty Preference, % 0.16 (2,117) 0.06 (99)
6 mo 59.0⫾6.1 58.2⫾6.5 59.7⫾6.1 58.6⫾6.0 59.5⫾6.2 9 mo 57.1⫾5.3 58.1⫾7.4 57.4⫾5.9 57.7⫾5.0 57.1⫾6.6 Look Duration During
Familiarization, s
0.08 (2,118) 0.00 (99)
6 mo 1.96⫾0.68 2.04⫾0.95 1.91⫾0.62 2.15⫾0.84 1.89⫾0.65 9 mo 1.51⫾0.45 1.48⫾0.46 1.46⫾0.43 1.45⫾0.33 1.59⫾0.52 Look Duration During
Testing, s
0.89 (2,118) 0.18 (99)
6 mo 1.60⫾0.58 1.62⫾0.49 1.72⫾0.61 1.87⫾0.62 1.66⫾0.64 9 mo 1.17⫾0.28 1.22⫾0.32 1.05⫾0.28 1.16⫾0.27 1.22⫾0.38 Bayley Scales of Infant Development
n(6, 12 mo) (49, 48) (62, 60) (55, 57) (65, 61) (69, 65)
Psychomotor Development Index 0.98 (2,166) 0.00 (130)
6 mo 99.1⫾12.3 98.5⫾11.1 97.1⫾11.3 100.2⫾10.2 100.2⫾10.5 12 mo 94.6⫾12.5 96.0⫾13.8 91.9⫾12.7 96.1⫾11.4 97.1⫾12.9
Mental Development Index 0.66 (2,166) 1.34 (130)
6 mo 100.4⫾5.0 99.5⫾6.6 99.8⫾5.6 101.1⫾5.3 100.4⫾5.4 12 mo 97.8⫾8.3 95.7⫾10.0 97.8⫾8.5 101.3⫾7.8 98.6⫾9.7 MacArthur Communicative
Development Inventories
n(9, 14 mo) (47, 39) (58, 49) (58, 51) (59, 53) (63, 59)
Vocabulary Comprehension 0.14 (2,161) 0.15 (121)
9 mo 101⫾17 103⫾19 98⫾17 99⫾16 98⫾21
14 mo 100⫾11 100⫾13 103⫾17 103⫾15 101⫾14
Vocabulary Expression* 4.23 (2,133) 0.31 (107)
14 mo 99⫾12a,b 96⫾18a 104⫾13b 98⫾15 96⫾19 Infant Behavior Questionnaire†
n(6, 12 mo) (50, 46) (63, 59) (59, 56) (65, 61) (70, 68)
Activity level 0.28 (2,166) 1.83 (130)
6 mo 4.39⫾0.85 4.41⫾0.72 4.28⫾0.84 4.46⫾0.94 4.24⫾0.82 12 mo 4.40⫾0.89 4.51⫾0.88 4.56⫾0.82 4.44⫾0.94 4.30⫾0.81
Distress to novel stimuli 0.79 (2,166) 1.63 (130)
6 mo 2.55⫾0.85 2.60⫾0.81 2.57⫾0.85 2.52⫾0.76 2.40⫾0.78 12 mo 2.84⫾0.72 3.09⫾0.78 2.88⫾0.73 3.04⫾0.79 2.87⫾0.69
Distress to limitations 0.59 (2,166) 1.33 (130)
6 mo 2.89⫾0.73 3.13⫾0.74 3.05⫾0.73 3.21⫾0.86 3.18⫾0.76 12 mo 3.49⫾0.77 3.50⫾0.72 3.58⫾0.78 3.71⫾0.87 3.49⫾0.74
Soothability 0.69 (2,165) 0.00 (130)
6 mo 5.50⫾0.91 5.41⫾0.84 5.20⫾0.81 5.23⫾0.81 5.29⫾0.64 12 mo 5.27⫾0.90 5.15⫾0.78 5.25⫾0.90 5.34⫾0.86 5.24⫾0.88
Smiling and laughter‡ a b a,b 3.06 (2,166) 0.01 (130)
6 mo 5.58⫾0.73 5.39⫾0.79 5.40⫾0.88 5.45⫾0.78 5.39⫾0.79 12 mo 5.66⫾0.60 5.29⫾0.71 5.44⫾0.79 5.35⫾0.73 5.37⫾0.73
Duration of orienting 0.36 (2,166) 0.37 (130)
6 mo 4.29⫾1.22 4.13⫾1.17 4.32⫾1.00 4.13⫾1.08 4.23⫾1.01 12 mo 3.70⫾1.03 3.58⫾1.06 3.62⫾1.14 3.45⫾1.02 3.59⫾0.87
Values are mean⫾SD.n⫽numbers of participants at the designated study visits. Unless otherwise noted, no significant differences were found within the formula-fed or BF groups or between the BF and corresponding formula groups.
* Unlike letter notations within the formula-fed groups indicate significantly different Bonferonni adjusted pairwise comparisons (a,b,P
⬍.05).
† A 7-point scale was used; 1⫽never, 2⫽very rarely, 3⫽less than half the time, 4⫽about half the time, 5⫽more than half the time, 6⫽almost always, 7⫽always. Comparisons between the BF and corresponding formula groups by repeated-measures analysis found no significant differences with or without adjustment for covariates.
sults, and variances fell within normal ranges,
de-spite higher AA and twofold increases in red blood
cell levels of DHA, point to the conclusion that there
would be no demonstrable advantage to infant
de-velopment
from
the
widespread
addition
of
AA
⫹
DHA to infant formula. This conclusion is
fur-ther supported by the absence of advantages to
breastfeeding on the visual and developmental
out-comes tested despite the expected differences in
fam-ily demographics and red blood cell AA and DHA
levels. It may be possible that differences
(advantag-es or disadvantag(advantag-es) of AA
⫹
DHA supplementation
do not appear until after the first year, that they may
be present in domains of development not measured
here, that they only appear in more differentiated
and subtle assessments, or that they only become
apparent in direct response to cognitive or social
stressors. However, at the average levels of AA and
DHA in human milk reported in the United States
and for common standardized and robust
develop-mental measures, dietary supplementation with
AA
⫹
DHA seems to pose no demonstrable benefits
for infant development in a study population similar
to the overall US population.
ACKNOWLEDGMENTS
This study was supported by Ross Products Division, Abbott Laboratories, Columbus, Ohio.
We appreciate the contributions of Keith S Reisinger, MD (Pitts-burgh Pediatric Research) and are grateful to the committed re-search staffs at each of the participating sites and to those who provided support for training certification and reliability assess-ments for the visual (Luisa Mayer, PhD, at Children’s Hospital, Boston, MA) and developmental (Robert Arendt, PhD, Carol Se-gal, PhD, Elizabeth Shaver, Marilyn Davillier, and Sonia Minnes, PhD, at Rainbow Infants & Babies Hospital, Cleveland, OH) indi-ces. We also gratefully acknowledge the infants and their families for their participation in the study.
REFERENCES
1. Horwood LJ, Fergusson DM. Breastfeeding and later cognitive and academic outcomes. Pediatrics. 1998;101(1). URL: http://www. pediatrics.org/cgi/content/full/101/1/e9
2. Morrow-Tlucak M, Haude RH, Ernhart CB. Breastfeeding and cognitive development in the first 2 years of life.Soc Sci Med. 1988;26:635– 639 3. Fergusson DM, Beautrais AL, Silva PA. Breast-feeding and cognitive
development in the first seven years of life. Soc Sci Med. 1982;16: 1705–1708
4. Johnson DL, Swank PR, Howie VM, Baldwin CD, Owen M. Breast feeding and children’s intelligence.Psychol Rep. 1996;79:1179 –1185 5. Pesa JA, Shelton MM. Health enhancing behaviors correlated with
breastfeeding among a national sample of mothers.Public Health Nutr. 1999;16:120 –124
6. Scott JA, Binns CW. Factors associated with the initiation and duration of breastfeeding: a review of the literature.Breastfeed Rev. 1999;7:5–16 7. Olds DL, Henderson CR, Tatelbaum R. Intellectual impairment in
chil-dren of women who smoke cigarettes during pregnancy.Pediatrics. 1994;93:221–227
8. Agostoni C, Trojan S, Bellu` R, Riva E, Bruzzese MG, Giovannini M. Development quotient at 24 months and fatty acid composition of diet in early infancy: a follow up study.Arch Dis Child. 1997;76:421– 424 9. Makrides M, Neumann M, Simmer K, Pater J, Gibson R. Are long-chain
polyunsaturated fatty acids essential nutrients in infancy?Lancet. 1995; 345:1463–1468
10. Carlson SE, Ford AJ, Werkman SH, Peeples JM, Koo WW. Visual acuity and fatty acid status of term infants fed human milk and formulas with and without docosahexaenoate and arachidonate from egg yolk leci-thin.Pediatr Res. 1996;39:882– 888
11. Auestad N, Montalto MB, Hall RT, et al. Visual acuity, erythrocyte fatty acid composition, and growth in term infants fed formulas with long
chain polyunsaturated fatty acids for one year.Pediatr Res. 1997;41:1–10 12. Scott DT, Janowsky JS, Wheeler RE, Taylor JA, Auestad N, Montalto MB. Formula supplementation with long-chain polyunsaturated fatty acids: are there developmental benefits?Pediatrics. 1998;102(5). URL: http://www.pediatrics.org/cgi/content/full/102/5/e59
13. Birch EE, Hoffman DR, Uauy R, Birch DG, Prestidge C. Visual acuity and the essentiality of docosahexaenoic acid and arachidonic acid in the diet of term infants.Pediatr Res. 1998;44:201–209
14. Willatts P, Forsyth JS, DiModugno MK, Varma S, Colvin M. Effect of long-chain polyunsaturated fatty acids in infant formula on problem solving at 10 months of age.Lancet. 1998;352:668 – 691
15. Lucas A, Stafford M, Morley R, et al. Efficacy and safety of long-chain polyunsaturated fatty acid supplementation of infant formula milk: a randomised trial.Lancet. 1999;354:1948 –1954
16. Birch EE, Garfield S, Hoffman ER, Uauy R, Birch DG. A randomized controlled trial of early dietary supply of long-chain polyunsaturated fatty acids and mental development in term infants. Dev Med Child Neurol. 2000;42:174 –181
17. Makrides M, Neumann MA, Simmer K, Gibson RA. A critical appraisal of the role of dietary long-chain polyunsaturated fatty acids on neural indices of term infants: a randomized, controlled trial.Pediatrics. 2000; 105:32–28
18. Birch DG, Birch EE, Hoffman DR, Uauy RD. Retinal development of very low birthweight infants fed diets differing in n-3 fatty acids.Invest Ophthalmol Vis Sci. 1992;33:2365–2376
19. Uauy R, Hoffman DR, Birch EE, Birch DG, Jameson DM, Tyson J. Safety and efficacy of omega-3 fatty acids in the nutrition of very low birth weight infants: Soy oil and marine oil supplementation of formula.
J Pediatr. 1994;124:612– 620
20. Carlson SE, Werkman SH, Rhodes PG, Tolley EA. Visual-acuity devel-opment in healthy, preterm infants: effect of marine-oil supplementa-tion.Am J Clin Nutr. 1993;58:35– 42
21. Carlson SE, Werkman SH, Tolley EA. Effect of long-chain n-3 fatty acid supplementation on visual acuity and growth of preterm infants with and without bronchopulmonary dysplasia. Am J Clin Nutr. 1996;63: 687– 697
22. Raiten DJ, Talbot JM, Waters JH. Assessment of nutrient requirements for infant formulas.J Nutr. 1998;(suppl):128
23. Carnielli VP, Wattimena DJL, Luijendijk IHT, Boerlage A, Degenhart HJ, Sauer PJJ. The very low birth weight premature infant is capable of synthesizing arachidonic and docosahexaenoic acids from linoleic and linolenic acids.Pediatr Res. 1996;40:169 –174
24. Sauerwald TU, Hachey DL, Jensen CL, Chen H, Anderson RE, Heird WC. Intermediates in endogenous synthesis of C22:6w3 and C20:4w6 by term and preterm infants.Pediatr Res. 1997;41:183–187
25. Salem N, Jr, Wegher B, Mena P, Uauy R. Arachidonic and docosahexae-noic acids are biosynthesized from their 18-carbon precursors in human infants.Proc Natl Acad Sci U S A. 1996;93:49 –54
26. Innis SM, Nelson CM, Rioux MF, King DJ. Development of visual acuity in relation to plasma and erythrocyte w-6 and w-3 fatty acids in healthy term gestation infants.Am J Clin Nutr. 1994;60:347–352
27. Innis SM, Nelson CM, Rioux FM, Waslen P, Lwanga D. Feeding formula without arachidonic acid and docosahexaenoic acid has no effect on preferential looking acuity or recognition memory in healthy full-term infants at 9 mo of age.Am J Clin Nutr. 1996;64:40 – 46
28. Innis SM, Akrabawi SS, Diersen-Schade DA, Dobson MV, Guy DG. Visual acuity and blood lipids in term infants fed human milk or formulae.Lipids. 1997;32:63–72
29. American Academy of Pediatrics, Committee on Nutrition. Fats and fatty acids. In:Pediatric Nutrition Handbook. 4th ed. Elk Grove Village, IL: American Academy of Pediatrics; 1998:213–220
30. Innis SM, Auestad N, Siegman JS. Blood lipid docosahexaenoic and arachidonic acid in term gestation infants fed formulas with high do-cosahexaenoic acid, low eicosapentaenoic acid fish oil.Lipids. 1996;31: 617– 625
31. Francois CA, Connor SL, Wander RC, Connor WE. Acute effects of dietary fatty acids on the fatty acids of human milk.Am J Clin Nutr. 1998;67:301–308
32. Connor SL, Zhu N, Anderson GJ, et al. Cheek cell phospholipids in human infants: a marker of docosahexaenoic and arachidonic acids in the diet, plasma and red blood cells.Am J Clin Nutr. 2000;71:21–27 33. Jensen RG, Lammi-Keefe CJ, Koletzko B. Representative sampling of
human milk and the extraction of fat for analysis of environmental lipophilic contaminants.Toxicol Environ Chem. 1997;62:229 – 47 34. Kocher L.Guide to Growth Assessment of Infants in Clinical Studies. Ross
Products Division; 1991
in infants and children: The acuity card procedure. Dev Med Child Neurol. 1986;28:779 –789
36. Fagan JF, Singer LT. Infant recognition memory as a measure of intel-ligence. Infant recognition memory as a measure of intelintel-ligence. In: Lipsitt LP, ed.Advances in Infancy Research. Vol. 2. Norwood, NJ: Ablex; 1983:31–72
37. Jacobson SW, Jacobson JL, Sokol RJ, Martier SS, Ager JW. Prenatal alcohol exposure and infant information processing ability.Child Dev. 1993;64:1706 –1721
38. Colombo J, Mitchell DW, Horowitz FD. Infant visual attention in the paired-comparison paradigm: Test-retest and attention-performance re-lations.Child Dev. 1988;59:1198 –1210
39. Bayley N.Bayley Scales of Infant Development. San Antonio, TX: Psycho-logical Corp; 1993
40. Fenson L, Dale PS, Reznick JS, et al.MacArthur Communicative Develop-ment Inventories: User’s Guide and Technical Manual. San Diego, CA: Singular Publishing Group; 1993
41. Rothbart MK. Measurement of temperament in infancy. Child Dev. 1981;52:569 –578
42. Hernandez DJ. Child development and the social demography of child-hood.Child Dev. 1997;68:149 –169
43. Ryan AS. The resurgence of breastfeeding in the United States.
Pediat-rics. 1997;99(4). URL: http://www.pediatrics.org/cgi/content/full/99/ 4/e12
44. Weistheimer G. Scaling of visual acuity measurements.Arch Ophthalmol. 1987;97:327–330
45. Courage ML, Adams RJ. Visual acuity assessment from birth to three years using the acuity card procedure: cross-sectional and longitudinal samples.Optom Vis Sci. 1990;67:713–718
46. Salomao SL, Ventura DF. Large sample population age norms for visual acuities obtained with Vistech-Teller acuity cards.Invest Ophthalmol Vis Sci. 1995;36:657– 670
47. Singer LT, Fagan JF. The cognitive development of the failure-to-thrive infant: a three-year longitudinal study.J Pediatr Psychol. 1984;9:363–384 48. Jacobson SW, Jacobson JL, Sokol RJ, Martier SS, Chiodo LS. New evi-dence for neurobehavioral effects of in utero cocaine exposure.J Pediatr. 1996;129:581–590
49. Chulei R, Xiaofang L, Hongsheng M, et al. Milk composition in women from five different regions of China: The great diversity of milk fatty acids.J Nutr. 1995;125:2993–2998
50. Golding J, Rogers IS, Emmett PM. Association between breast feeding, child development and behavior.Early Hum Dev. 1997;49:S175–S184 51. Jacobson SW, Chiodo LM, Jacobson JL. Breastfeeding effects on
intelli-gence quotient in 4- and 11-year old children.Pediatrics. 1999;103(5). URL: http://www.pediatrics.org/cgi/content/full/103/5/e71
TRAINED AND SOCIALIZED TO ACT
Occasionally I read in articles by medical professionals that their patients fear
uncertainty. No doubt true at times, and surely part of being human—and unwell.
But assertions about patients’ fear of uncertainty are often used to justify the
overprovision of treatments. Less occasionally, I read that clinicians also fear
uncertainty and that they are trained and socialized to act at all costs.
Hill S. From our coordinating editor,Cochrane Consumers and Communicating Review Group Newsletter,
January 2001