4437
An Efficient Patch Based Local Principal
Component Analysis Technique In Image
Denoising Process With Soft Computing Approach
Dr.A.Suresh, Saiyed Falayaz Waris
Abstract: Noise can be introduced at the time of creation or at the time of transmission. Technically, a noise can be defined as the replacement of the original intensity of a pixel by some other intensity. Noise removal algorithms help to remove or reduce the noise from the image. However, these methods can affect the fine and low contrast details. Some of the common noise that occurs in images is salt and pepper noise. Denoising can improved by the patch based filtering. Therefore, the Patch based Local-Principal Component Analysis is taken interest, since it better results. The patch size plays the major role in the process of denoising. A large patch size leads to artifacts in the image texture regions which is a major concern. . This has inspired to the development of the proposed Efficient PL-PCA algorithm in which the patch size is minimized by applying the empirical Wiener filter. Minimizing the patch size not only avoids the formation of artifacts but also saves the time consumed for denoising.
Keywords :In this chapter mainly focusing on Patch based denoising method (PL-PCA) and it Improvisations like adding some filtering concepts (E-PL-PCA).
——————————◆——————————
BACKGROUND STUDY
A proficient hybrid denoising algorithm was developed by Zhang et al. (2014) based on Adaptive Principal Component Analysis (PCA). A low rank approximation is primarily done using parallel evaluation and collaborative filtering. Eventually, the noise in the image is removed by the collaboration of Wiener filter. In addition, a novel technique for MRI denoising as proposed by Manjon et al. (2015) which considers the sparseness and self-similarity properties of the MRI picture for denoising. The proposed approach is a two stage method in which the non-local PCA thresholding is used in the noisy images to automatically estimate the neighborhood noise level. Next, this filtered image is used as a reference image within a rotationally invariant non local means filter. This approach corrects the Rician noise triggered locally.
Advanced-Non-Local Mean Filter
Image denoising is the process of rectification of image noise from a corrupted image. To achieve image denoising, various algorithms use various methods. The Non-Local Mean filter uses the weighted average edge preservation which deploys self-prediction and self-similarity analysis of the image to achieve denoising (Coupe et. al., 2008). When a noise arise, it is characterised by blurring, loss of refined structures at the edges of occurence. This research work presents a mix of NLM and Stationary Wavelet Transform (SWT) with adaptive thresholding (Nason et. al., 2000) to remove high noise and to preserve the structural information of the edges.
IMPROVED CELLULAR AUTOMATA
The Cellular Automata, when applied over the noisy image, uses a thresholding technique to identify and act over the noisy pixels. This is usually achieved by means of calculation of similarity weight. The current techniques in evaluating the similarity weight takes into consideration the median or mean of the neighbourhood pixels and replace it for the noisy pixel. This minimizes the accuracy of denoising. This can be eliminated by introduction of Wiener filter which overcomes the difficulties in the calculation of similarity weight, thereby yields better results.
PRINCIPAL
COMPONENT
ANALYSIS
TECHNIQUE
Principal Components Analysis (PCA) helps in identification of patterns in an image data (Wold et. al., 1987). This technique can also be used for image compression. It is an essential step to improve the image quality and image enhancement. Random noise removal is extensively studied as a low-level image processing procedure. To overcome the problem with conventional wavelets, a new method of Wavelet PCA is used. Multiple spatial scales wavelets are efficient and practical way of representing edges and image informations (Stenborg and Cobelli, 2003). Image features, at a given scale is directly enhanced by filtering the wavelet coefficients. Wavelet is a more useful image representation than pixels. Therefore, in order to maximize edge information in the reduced dimensionality set of images, PCA is considered as dimensionality reduction technique for wavelet coefficients (Yang et. al., 2004). Wavelet transform (WT) takes place spatially over each image band, while the PCA transform takes place spectrally over the set of images. Consequently, the two transforms operate over different domains. Yet, the approximation coefficients of PCA over a complete set of wavelet result is exactly the same as Eigen spectra as PCA over the pixels. Muresan and Parks, (2003) proposed a spatially adaptive Principal Component Analysis (PCA) based denoising scheme to overcome the problem of WT which computes the locally fitted basis to transform the image. Sparse redundant representation and (clustering -singular value decomposition) K-SVD proposed by Elad and Aharon (2006) is based on development of a denoising
______________________________
• Dr.A.Suresh is an Assistant Professor, Vel Tech Dr.Rangarajan Dr.Sagunthala R&D Institute of Science and Technology,(University) Chennai
algorithm by training a highly over-complete dictionary. For effective denoising Foi et al.(2007) applied a shape-adaptive discrete cosine transform (DCT) to the neighborhood, which achieve very sparse representation of the image and leads to better denoising. All these techniques demonstrate improved denoising techniques than the conservative WT-based denoising algorithms.
EFFICIENT
PATCH
BASED
LOCAL
PRINCIPAL
COMPONENT
ANALYSIS
TECHNIQUE
This approach relies on a descending window of size WS * WS in which the patches are chosen to propagate towards a local PCA. Due to the patch redundancy property of natural images PL-PCA offers a better performance. The PCA retrieves the most frequent patterns of the image by selecting the axis of highest variance. It is bound to use one single ortho-normal base for the whole image, with PL-PCA. This has two limitations with respect to denoising. Primarily, the PLPCA is unable represent rare patches, since they contribute weakly to the total variance. The representations are usually not sparse in this base. Furthermore, merely a small number of axis clarify the majority of the variance and are visually appropriate, the remaining ones resemble the noise. It is proposed to perform several PCAs on subsets of patches presenting less variability to overcome these drawbacks. The improvement of this approach is an effect not only personalized to the image but also to the region of the image including the patch of interest. In this view, the computation of PCA over descending square windows is processed. This has two disadvantages: overstating and increased computational burden. The precision of the axis assessment is depreciated because of the inadequate number of training patches to execute the PCA. On the other hand, the computational complexity is greater than before since PCA needs to be performed repeatedly. Two different local windows are given as an illustration of local axis obtained by PL-PCA method. Local approaches and different dictionaries are adapted to the local regions in the image because the global approach explains the set of patches with a small number of axis. Unfortunately, to handle common image sizes such approaches are highly time consuming and require to be accelerated. In view of the fact that searching is allowed in windows to overlap, the sliding window is moved with a step = WS*1/2 (so that there are still overlaps between the searching zones). Without any significant loss of performance, this sliding step allows dividing the computation time by a factor divisible by two. A source of redundancy is created by the sliding windows for patch estimation. Each sliding window contain a given patch that provides candidate to estimate the true noise-free patch. The uniform average of those candidates is estimated for the final patch. Additionally, a second level of redundancy exists. One gets multiple estimators for a given pixel because every pixel belongs to many patches. To reconstruct a two dimensional image, a re-projection step from the collection of patches to pixel estimators is required. The simplest solution is again to uniformly average the candidate estimates for all pixels. When the size of the patches is larger, the noise robustness is higher in PL-PCA. On the other hand, because of rare patch effect, development of artifacts in textured regions is higher. Therefore, to reduce the size of the patch, the PL-PCA is
modified by integrating the empirical Wiener filtering called Enhanced PLPCA (E-PL-PCA). The accuracy of the reconstruction details of the image is improved by this method. In this E-PL-PCA, for matching purpose, the identity of the patch and size of image denoising are jointly optimized. The smallest matching area is selected to denoise the images more accurately. The E-PL-PCA is performed as follows: Initially, the image is estimated by the similar blocks by means of searches. Subsequently, from the image sample, a second moment matrix is estimated using the third iteration. It is required to minimize the size of the patches by empirical Wiener filtering approach. In order to enhance the patch size reduction, the empirical Wiener filter is designed using wavelet decomposition. Two different decompositions namely decomposition scales and decomposition orientations are employed. The threshold is first made to attenuate the image noise depending on the variance of each wavelet transform coefficient. It is performed using the wavelet decomposition and then by regularization. Therefore, the wavelet-based empirical Wiener estimate is obtained by computing the inverse wavelet transform to reduce the image patch size.
PERFORMANCE EVALUATION
PSNRPeak Signal-to-Noise Ratio, often abbreviated PSNR, is a term for the ratio between the maximum possible powers of a signal. The fidelity of its representation affects the power of corrupting noise.
PSNR = 20 log 10 ( ) (1.1)
MSE
(1.2)
ENL (equivalent number of looks)
The higher ENL effectiveness for a filter, the upper potency in smoothing speckle noise over homogenized areas
(1.3)
SSI (Speckle Suppression Index)
Speckle similar to noise has the form of a set of comparatively small groups of pixels. Containment of this noise may also cause suppression of small image details. Therefore the capability to safeguard the vital part of an image is measured by SSI.
(1.4)
SMPI: Speckle Suppression and Mean Preservation Index (SMPI)
ENL and SSI are not dependable when the filter over calculate the mean value. It is urbanized an index called Speckle Suppression and Mean Preservation Index (SMPI).According to this index, lower values point out better concert of the filter in terms of mean conservation and noise reduction.
4439
Where
(1.6)
COC: Correlation coefficient
It is a statistical measure of the degree to which changes to the value of one variable predict change to the value of another.
(1.7)
In this section, the performance of the E-PL-PCA is evaluated in terms of PSNR, MSE, ENL, SSI, SMPI, SSIM and COC parameters.
PARAMETERS PERFORMANCE EVALUATION
Table 1.1 E-PL-PCA Technique- Salt & Pepper Noise
IMAGE PSN R
MS
E ENL SSI SMP I SSI M CO C Barbar
a 49.3
225 0.7 6 14.8 944 1.0 8 -0.00 48 0.9 885 0.9 6 Boat 49.3 158 0.7 612 14.9 874 1.0 135 -0.01 91 0.9 874 0.9 45 Bridge 48.4 985 0.9 188 13.2 803 1.0 574 -0.01 02 0.9 862 0.9 491 Camer
aman 48.6 636 0.8 845 5.38 56 0.8 064 -0.21 32 0.9 653 0.9 691 Couple 49.1
572 0.7 895 12.7 294 1.1 287 0.00 32 0.9 877 0.9 353 Flintsto
nes 46.3 206 1.5 171 27.2 239 1.0 252 -0.00 55 0.9 778 0.9 496 Hill 49.4 793 0.7 331 32.3 031 1.0 415 -0.00 67 0.9 891 0.9 557 House 50.3 968 0.5 935 14.2 603 1.1 24 -0.01 32 0.9 916 0.9 593 Lena 49.7 25 0.6 928 10.6 831 1.0 759 -0.00 39 0.9 896 0.9 556 Man 49.2 542 0.7 721 13.9 401 1.0 898 -0.00 37 0.9 882 0.9 48 Finger print 45.5 647 1.8 056 35.6 501 1.1 606 0.00 76 0.9 724 0.8 237 Glauco
ma 50.1 931 0.6 22 10.6 795 0.7 031 -0.08 57 0.9 847 0.8 475 Palm 51.1
569 0.4 982 5.34
1.0 84 5.49 E-06 0.9 918 0.9 709
The performance comparisons are visualized through the following figures.
Figure 1.1 PSNR for Salt & pepper noise
From the Figure 5.1, it is inferred that the performance of E-PL-PCA technique is better compare to that of A-NLM and ICA methods, in case of evaluation of PSNR for salt and Pepper noise. The more is the PSNR, the better is the denoising. This is evident from the graph in Figure 1.1. The performance is achieved because the E-PL-PCA method is reduces block size of the image into minimum size. The red line is the highest quality parameter, The value of the red line (E-PL-PCA) is starting from above 45 for all given input images. In case of comparing the PSNR values other methods, the value of ICA is moderately better than A-NLM method. Since the value of ICA is nearest to 40 in most of the input images, It is proved that ICA also good in denoising evaluation shown in the above graph 1.1.
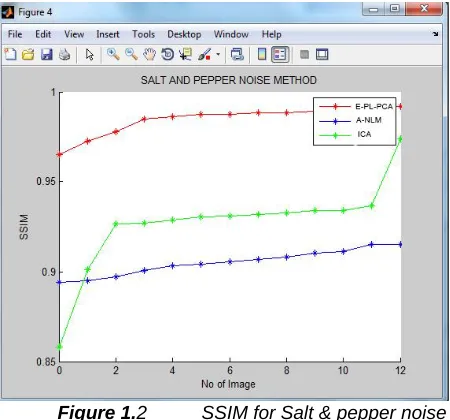
Figure 1.2 SSIM for Salt & pepper noise
The Similarity checking between reference and output images is evaluated by SSIM values. If the value is reached in and around 1, then the estimated denoised processes in the images are perfectly close to each other. The above plot represent between 0.95 to 1 for E-PL-PCA which produce best structural similarity among all other techniques, because the ICA method attainment level is below 0.95 as well as the A-NLM method indicated by green and blue lines.
Figure 1.3 MSE for Salt & pepper noise
Figure 1.3 shows that the comparative performance of the E-PL-PCA method with that A-NLM filter and ICA filters with respect to MSE to denoising the Salt and Pepper Noise. The lower the value of MSE, the higher is the denoising. The E-PL-PCA method shows the higher performance over the other two filters. The X axis is takes the number of images. The Y axis denotes the mean square error values. The output red line (E-PL-PCA) indicates less mean square error range from 0 to 1 compared to the other two filters. ICA and A-NLM mean error is imitated above 2. It causes less noise removal in case of pertaining the signal to noise ratio estimation.
The sample image results are shown as follows:
Figure 1.4 Lena image
Figure 1.4shows a sample output obtained through E-PL-PCA. The image in the left contains noise. The image in the right is the one denoised by the E-PL-PCA filter. It is observed that the image in the right is better, by means of
visual perception itself. This can be substantiated from the output shown in the tables and graphs which are discussed above.
Figure 5.11 shows the performance of E-PL-PCA with the Man image. The left one is the image containing noise and the right one is the image which is obtained as an outcome after application of E-PL-PCA. The outcome is supported by the graphs and tabulated values described above.
Figure 1.5 Man image
Conclusion
The performance of ICA and ANLM achieve reduction of the noise when compared to most of the recent filtering techniques in terms of parameters namely PSNR, MSE, SSIM and COC. However, the attainment of noise removal is not up to the best level. Therefore, the PL-PCA is applied which deploys a patch based operation for noise removal. The main focus of the current chapter is the development of a well-organized denoising filter based on PL-PCA. In this E-PL-PCA, for the identical reason, the individuality of the patch and size of the image to be denoised are mutually optimized. The least matching area is selected, which denoises the images more precisely. By empirical Wiener filtering approach the patch size is minimized. The empirical Wiener filter is designed using wavelet decomposition, in order to improve the reduction of patch size. The consequence is the deisgn of E-PL-PCA which has a superior performance than most other filter based denoising methods. The E-PL-PCA has a better denoisng performance. This could further be enhanced, if the state of the pixel is also considered. As previously discussed in Chapter 3, the state based techniques provide a better identification of noisy pixels. Therefore, this advantage could be utilized in obtaining a better result. Hence, a method which is obtained by fusing the Cellular Automata with the Enhanced PL-PCA can yield better denoising. Therefore, the research moves into another dimension which focus on obtaining the advantage of Cellular Automata with the E-PL-PCA.
REFERENCES
[1] Manjon, JV, Coup, P & Buades, A 2015, 'MRI noise estimation and denoising using non-local PCA', Medical Image Analysis, vol. 22, no. 1, pp. 35-47.
4441
and machine intelligence, vol. 26, no. 1, pp. 131-137.
[3] Muresan, DD & Parks, TW 2003, 'Adaptive principal components and image denoising', Proceedings 2003 International Conference on Image Processing, vol. 1, no. Dmmd, pp. 1-4. [4] Chen, G & Qian, S-E 2011, 'Denoising of
hyperspectral imagery using principal component analysis and wavelet shrinkage', IEEE Transactions on Geoscience and remote sensing, vol. 49, no. 3, pp. 973-980.
[5] Wold, S, Esbensen, K & Geladi, P 1987, 'Principal component analysis', Chemometrics and intelligent laboratory systems, vol. 2, no. 1-3, pp. 37-52. [6] Wollny, G & Kruggel, F 2002, 'Computational cost
of nonrigid registration algorithms based on fluid dynamics [mri time series application]', IEEE transactions on medical imaging, vol. 21, no. 8, pp. 946-952.
[7] Zhang, Y, Liu, J, Li, M & Guo, Z 2014, 'Joint image denoising using adaptive principal component analysis and self-similarity', Information Sciences, vol. 259, pp. 128-141
[8] A Suresh, P Malathi, S Nagarani An improved cellular automata (ca) based image denoising method for biometric applicationsBiomedical Research, 1-1, 2017
[9] A Suresh 2017 “An Adaptive Non-Local Mean Filtering for Image Denoising” International Journal for Scientific Research & Development| 5 (Issue 02 …2017
[10]“Mr.A.Suresh,A Hybrid CA-PL-PCA based Algorithm for Improving Image Denoising” International Journal of Printing, Packaging & Allied Sciences 4 (No 5)2016
[11]Spectral–Spatial Image Segmentation Of Hyperspectral Data Using Iterative Proportional Fitting And Semisupervised Adaptive Active Learning Dpm A Suresh Ijcse 5 (Issn: 2348 – 8387), 44-53 2015.
[12]“Suresh A, R N Devendra Kumar” A Survey on Various Form of Data Hiding TechniquesDPM IJSRD - International Journal for Scientific Research & Development| 3 (09,2015) [13]Data Compression and Hiding using Improved
Vector Quantization Techniques 2014PM A SureshInternational Journal of Computer Applications® (IJCA) (0975 – 8887) 2 (IJCA. [14]A Suresh “Data Compression and Hiding using