Impact of Limestone Mining and Cement
Production on Bulk Density, Porosity and
Moisture content of Soils in Yandev, Gboko,
Benue State, Nigeria
Lucy Onyikwu Edache, Department of Geography and Environmental Management, University of Abuja ([email protected]),
Ishaku Ibrahim Yari Mallo, Department of Geography and Environmental Management, University of Abuja ([email protected])
Abstract-This research is on the impact of limestone mining and cement production on soils in Yandev, Gboko Benue
State, Nigeria. The core cutter method was used to sample the soil physical parameters. Student’s t-test was used to compare the bulk density, porosity and moisture content of the control and impacted sites and the extent of compaction between the two sites. The results show mean bulk density at the impacted site to be 1.84g/cm3with a standard deviation of 0.03g/cm3while that of the control site is 1.54g/cm3, with a standard deviation of 0.3g/cm3. The mean porosity at the impacted site is 30.2% with a standard deviation of 1.32% and a mean porosity of 41.2% at the control site with a standard deviation of 1.23%. The mean moisture content at the impacted site is 3.4% with standard deviation of 1.77% while the mean moisture content at the control site is 9.4% with a standard deviation of 2.74%. Statistically it has been confirmed that there are high significant differences of bulk density, porosity and moisture content between the control and impacted sites at 0.05 level of significance due to vehicular traffic, human clearing for mining activities and fuel wood harvesting. The work revealed that limestone mining and cement production have impacted negatively on the environment. Thus, there is need for government to conduct an environmental impact assessment in the study area.
Keywords: Limestone Mining, Cement Production, Bulk Density, Porosity, Moisture Content
I. INTRODUCTION
The history of the ecological system as a source of man’s sustenance is as old as man himself. This dates back to the
primordial times as man’s dependency was solely on the environment. Man hunted for game and gathered wild fruit
to cater for his needs. History has also shown that ancient man had his shelter in caves and depended on the streams
and rivers for fishing and fetching of water. Mallo, (2007) [10]. Mallo (2007) [10], also stated that man’s attempt to
mine flint which was a hard stone used for the manufacturing of rudimentary tools and weapons is dated back to about
6000 BC. The construction of various tools with which man positively or negatively impacted on the environment
marked the three consecutive time periods of human prehistory recognized predominantly for tool making technology
(Matthew, 2011) [11]. The manufacturing of sophisticated implements, tools and weapons have increased in response
to increased civilization. Also, coupled with the human population growth, the environmental impact is on the increase
due to human activities and agriculture. The human activities such as road construction, building of houses, mining
and agriculture have led to land degradation, deforestation and pollution of the environment, as exemplified in the
In many developing countries, the exploitation of mineral resources has taken the lead, with Nigeria not being an
exception. Abundant mineral resources exist in large deposits in Nigeria, the exploration, mining and processing of
these resources have increased the wealth of the country with accompanying socio-economic benefits (Feasibility
Report of Limestone Milling in Nigeria, 2013) [8]. The land which is presently being used for mining activities in
Yandev area, in Gboko, Benue State was previously a natural forest, used for agriculture, grazing, and for harvesting
fuel wood and natural herbs for the locals' livelihood. However, the mining activities have resulted to removal of most
vegetation cover, through the process of forest clearing, pits creation, resettlement, road construction and soil
compaction as a result of vehicular traffic on the land. This has spurred this study in an attempt to examine the study
area and ascertain the effects of limestone mining on the physical condition of the soil.
Throughout the world, limestone mining activities have marked negative environmental impacts in view of the fact
that limestone mining involves extraction of limestone from the earth’s crust by removing vegetation cover, and rocks
that lie above the required limestone, hence exacerbate deforestation and land degradation (Mkaanem,2015) [12].
According to researchers like Aigbedion and Iyayi (2007), [3], natural landscape degradation has also been identified
as a negative effect of mineral exploration such as limestone mining. Areas where mining operations occur are
inevitably left with large irregular holes which invariably result in the problem of soil erosion, soil fall and slumping.
Another problem of limestone mining operation in such areas is degradation of natural vegetation and crop plantations
(Langer, 2001) [7]. Studies revealed that one of the major environmental impacts of limestone mining is a decline in
vegetation cover and output from crops within 2-3 kilometres radius of the operations (Adekoya, 2003[1]; Aigbedion,
2005[2]; Aigbedion and Iyayi, 2007) [3].
A research carried out by Ujoh and Alhassan (2014) [15] using Geoinformatic methods showed rapid decline in density
and quality of vegetation cover within the study area. Again, they observed that heavy metals and oxides originating
from limestone mining and cement production have polluted the soils in Yandev. Mkaanem (2015) [12] reported that
subsequent increase in mining activities especially around 2004, presented environmental problems among which are
extensive vegetal clearance/deforestation, conversion of lush green landscape into mine spoils as well as degradation
of agricultural lands. Therefore, the study aims at examining and comparing soil bulk density, porosity, and moisture
content, which are soil physical characteristics that affect plant growth, in the mining sites in Yandev, Benue State,
Nigeria: to see if they affect these physical properties of the soil.
II. DESCRIPTION OF THE STUDY ENVIRONMENT
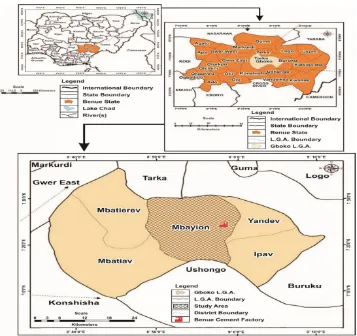
Yandev in Gboko Local Government Area in Benue State, Nigeria, is nestled within longitudes 9º 10' 00"E and 9º
30' 00"E and latitudes 7º 23' 00"N and 7º 21' 00"N(Figure1). The elevation of area is approximately 165m above
mean sea leve(msl) (Ujoh and Alhassan (2014) [15]. Mbayion, the impacted study site is located between longitudes
8º 48' E and 9º 00' E and latitudes 7º 16' N and 7º 28' N. This site is about 2km away from the Dangote Cement
Factory. It shares boundaries with Takar Local Government area in the North, Yandev District in the North-East, Ipav
District in the South-East, Ushongo Local Government Area in the South, Mbatiav District in the South-West and
(CMS), Buruku road, in Yandev District is the control area and it is 10km away from the Dangote Cement Factory
Plc quarry.
The geology of the study area shows a prevalence of Cretaceous continental and marine sediments within the Benue
trough (wright et al, 1985) [18]. Buchan and Pugh (1962) [6], noted that the geology is a blend of Pre-cambrian
Basement Complex rock formation which consist of Lower and Upper Cretaceous sediments combined with volcanic
deposits. The sediments have been categorized into Pre-cambrian limestones, marbles, dolomites, Cretaceous and
Tertiary limestones. The quantity of limestones in the study area are said by experts to be in excess of 70 million tones
(Ujoh and Alhassan, 2014). [15]
The topography is dominated by the River Benue, the second largest river in Nigeria which flows in the Benue Trough
with tributaries such as river Katsina-Ala, Guma, Dura, Amile 1 and Amile2 among others. The soil is Tropical
Ferruginous type produced by the process of laterisation. The climate is Aw type according to Köppen’s climatic
classification. The climate is characterized by a six months’ rainy season from May to October, and a dry season
which last from November to April. The vegetation is made up of scattered trees with deciduous crowns with a thick
grass cover forming the lower stratum of the vegetation. According to National Population Commission (2006) [13]
population census in Nigeria, the study area has an estimated population of about 358,936 persons chiefly made up of
Tiv people.
III. DATA COLLECTION PROCEDURE AND ANALYSIS
A. Field Experimentation and Laboratory Analysis
Data for this research were obtained mainly from primary sources. The core cutter method was used to sample soils
for compaction and porosity analyses. Twenty soil samples were collected randomly from the field using bulk density
core tubes. The number of samples chosen was based on the fact that bulk density does not vary much under similar
conditions. So, not too many samples were needed. Soil bulk density analysis method was carried out because the
result would show the effects of vehicular and human traffic on the soil.
All organic matter residues and vegetation on the top soil were carefully cleared, then the bulk density core tubes were
driven into the ground to a depth of 5.1cm with a small mallet and a block of wood which was used as buffer. The
cylindrical ring containing an undisturbed soil core was then removed by cutting and trimming to remove soil excesses
around the outside edge and bottom with a small bread knife to yield a core whose volume was calculated from its
length and diameter. The weight of the sample was taken and recorded. The process was repeated for nineteen other
samples at Mbayion (the impacted area) and at CMS Buruku Road (the control site), totaling twenty samples in all.
The samples were put in plastic sealable bags and labelled 1-20 for ease of identification. The Geographic Positioning
System (GPS) points of the samples location where also collected. The samples were transported to the laboratory and
oven dried for analysis of bulk density. To determine if soil was dry, the subsample was weighed in the cup after each
4-minute cycle. When the weight no longer changed after a drying cycle, it was considered to be dry, and the record
was taken. Thereafter, porosity and moisture content of the soil was calculated for the purpose of understanding the
capacity of the soil retention of water and air.
A null hypothesis to test the similarity or differences between the bulk density, porosity, and moisture content of the
impacted and control sites was set at the beginning of the research which states that: There is no significant difference
between the bulk density, porosity and moisture content of the soils at the impacted and control sites in and around
the Dangote Cement Factory Plc. The 0.05 level of significance or 95% confidence level was chosen to either accept
or reject the null hypothesis.
B. Computation of Soil Bulk Density and Porosity
Using the data of wet soil samples collected from the field and oven dried samples from the laboratory, soil compaction
or bulk density and porosity values were computed using the formulae adopted from Brady and Weil (1999) [5]. These
formulae were adopted because they are the most conventionally accepted methods used for computing bulk density,
porosity and moisture content of soils. The formulae and computation procedures are as follows:
Bulk density was computed using the formula in Equation 1, viz:
Db =W /V (1)
Where:
Db = Bulk Density, Mg/m3
W = Weight of oven dry soil
V = Volume of soil (Solids +Pores)
For calculating solid particle density Dp, the formula used is:
Dp = Ws /Vs (2)
Where:
Dp = Particle Density, Mg/m3
Ws = Weight of Solids
Vs = Volume of Solids
Pore spaces in the soil was computed using Equation 3 as follows:
Since % pore spaces (Sp) + % solid space Ss= 100%
and % pore space = 100 - % solid space, then
Sp= 100 - (Db/Dp ×100) % (3)
Where:
Sp = pore space %
Db= bulk density Mg/m3
Dp= particle density Mg/m3
C. Statistical Analysis
Student’s t-test from Statistical Package for Social Sciences (SPSS) was used to carry out statistical analysis to
compare the mean values of all data collected at the impacted and the control sites. The 0.05 level of significance or
IV. RESULTS AND DISCUSSION
A. Results of Soil Bulk Density
Table 1 shows the results of bulk density of the soils investigated at the impacted and control sites chosen for the
study.
TABLE 1. Descriptive Statistics of total Bulk Density of the Impacted and Control Sites
Sites No of Cases Mean Std. Deviation Std. Error Mean
Bulk density
Impacted site 10 1.8490 .02998 .00948
Control Site 10 1.5430 .02821 .00892
Source: Field Survey, 2017,
The results show that the mean bulk density at the impacted site at Mbayion is 1.85g/cm3 with a standard deviation of
0.03g/cm3 (Table 1), while that of the control site has a mean of 1.54g/cm3 with a standard deviation of 0.03g/cm3.
There is a difference in soil compaction between the impacted and the control sites, with a difference of 0.03g/cm3.
The mean bulk density values for the impacted and control sites are significantly different using the 0.05 level of
significance to compare the result. It is not surprising that a difference of 0.03g/cm3 is statistically highly significant.
This is because in a natural setting, bulk density does not vary significantly in a locality, so 0.03g/cm3 is a remarkable
difference in bulk density analysis. This result shows that vehicular traffic in the study area can impair plant growth
as suggested by the USDA (2008) [16] bulk density chart which reports that ideal bulk density chart for sandy loams
is less than1.60g/cm3 while bulk density that restricts growth is greater than 1.80g/cm3. The null hypothesis is therefore
being rejected, because the results show that there is a significant difference between the mean bulk densities of the
impacted site and control site.
TABLE 2. T- test Results of total Bulk Density of the Impacted and Control Sites Levene's Test for
Equality of Variances t-test for Equality of Means
F Sig. t df
Sig.
(2-tailed)
Mean
Difference
Std. Error
Difference
95% Confidence
Interval of the
Difference
Lower Upper
Bulk density Equal variances assumed .028 .869 22.355 18 .000 .29100 .01302 .26365 .31835
Equal variances not assumed 22.355 17.933 .000 .29100 .01302 .26364 .31836
B. Results of Soil Porosity
Tables 3 and 4 show porosity and t-test values for the impacted and control sites. Table 3 shows that the mean soil
porosity at the impacted site is 30.20% with a standard deviation of 1.32%. At the control site, the mean porosity is
41.20% with a standard deviation of 1.23%.
TABLE 3. Descriptive Statistics of Porosity of the Impacted and Control Sites.
Sites No of Cases Mean Std. Deviation Std. Error Mean
Porosity of the soil
Impacted site 10 30.2000 1.31656 .41633
Control site 10 41.2000 1.22927 .38873
Source: Field Survey.
There is a high significant difference between the porosity of the impacted site with that of the control site at 0.05
statistical level of significance using student t-test to compare the results (Table 4). The null hypothesis is rejected
because there is a significant difference between the mean porosity of the impacted and control sites. This is in
agreement with the findings of Nzunda (2013) [14], that soil porosity can be influenced by external impact. Intensive
vehicular movement at the Dangote Cement Factory in Yandev has increased soil compaction and reduction in the
volume of pore spaces, and moisture content which all have negative effects on plant growth.
TABLE 4. T- test Results of Porosity of the Impacted and Control Sites Levene's Test for
Equality of
Variances t-test for Equality of Means
F Sig. t Df
Sig.
(2-tailed)
Mean
Difference
Std. Error
Difference
95% Confidence Interval
of the Difference
Lower Upper
Porosity
of the soil
Equal variances
assumed .263 .614 19.312 18 .000 -11.00000 .56960 -12.19669 -9.80331
Equal variances
not assumed 19.312 17.916 .000 -11.00000 .56960 -12.19709 -9.80291
C. Results of Moisture Content of the Soil
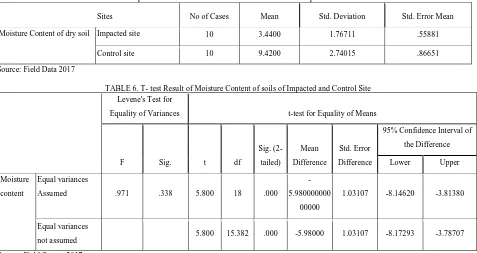
The descriptive statistics and t - test results of moisture content of the soils of impacted and control sites are
presented in Tables 5 and 6
Table 5: Descriptive Statistics of Moisture Content of Soils of the Impacted and Control sites
Source: Field Data 2017
TABLE 6. T- test Result of Moisture Content of soils of Impacted and Control Site Levene's Test for
Equality of Variances t-test for Equality of Means
F Sig. t df
Sig.
(2-tailed)
Mean
Difference
Std. Error
Difference
95% Confidence Interval of
the Difference
Lower Upper
Moisture
content
Equal variances
Assumed .971 .338 5.800 18 .000
-5.980000000
00000
1.03107 -8.14620 -3.81380
Equal variances
not assumed 5.800 15.382 .000 -5.98000 1.03107 -8.17293 -3.78707
Source: Field Survey 2017
The results reveal that the mean moisture content of the soil at the impacted site at Mbayion is 3.44% with a standard
deviation of 1.77%, while the result for the control site has a mean of 9.42% with a standard deviation of 2.74% (Table
5). These results show that soil is more compacted where there is vehicular and human traffic in the cement factory
area thus, has less infiltration because the pore spaces are destroyed. The null hypothesis is therefore being rejected.
The conclusion reached is that there is a significant difference between the mean moisture content of the soil of
impacted and control sites. The difference in porosity of the two sites is statistically significant at 0.05 alpha level
(Table 6). According to Voorhees (1992) [17], increase in soil moisture can be due to lack of activity on the soil.
Consequently, the moisture content of the soil in the control site is higher than that of the impacted site due to human
activities of mining and its operations in Mbayion the impacted site as shown in the results in Table 5.
Sites No of Cases Mean Std. Deviation Std. Error Mean
Moisture Content of dry soil Impacted site 10 3.4400 1.76711 .55881
D. Discussion of The Results
The results of this study agree with those of Bi et al., (2014) [4], in their study of dynamic monitoring of soil bulk
density and infiltration rate during coal mining in Bulianta mine in the Shenfu Dongsheng coalfield, which is in the
north eastern portion of the Ordos coal basin and southeastern Mu Us Sand land in China. The results indicated that
vegetation density had significant effects on soil bulk density, and that the tree–shrub–grass mode was better than
one single plantation for water conversation and vegetation recovery in sandy land subjected to mining. Soil
compaction caused by heavy machinery is known to result in increased soil bulk density, reduced porosity and
markedly limits root growth. For instance, bulk density and soil strength of plant row impacted by heavy machinery
traffic have been observed to be much greater compared to non-traffic area as stated by Voorhees (1992) [17].
Consequently, increase in soil bulk density due to mechanical compaction may alter root configuration and root-soil
interactions in the study area. Furthermore, higher bulk density may increase resistance to root penetration, alter root
development and proliferation, and thereby affect root distribution and biomass within soil profile. In addition to
restricting root growth into deeper soil layer, high bulk density may also interfere with the movement and distribution
of water in the profile (Lipiec, 1995) [9], nutrient availability, and uptake by plants, which may eventually affect plant
growth. Lipiec (1995)[9], also stated that soil compaction reduced crop yields due to increased resistance to root
growth and decrease in water and nutrient use efficiency.
V. CONCLUSIONS
Soil compaction has been shown to increase bulk density, reduce soil porosity, and moisture content of the soil. Thus,
the significantly higher bulk density of the compacted site in this study can be attributed to direct effect of soil
compaction due to compression of overburden substrates coupled with the movement of heavy machinery in the study
area. Pronounced changes in bulk density and total porosity in the study area has been noted as a result of compaction.
Furthermore, the bulk density at the compacted site exceeds the general range of 1.00 g/cm3 to 1.50 g/cm3reported for
uncompacted soils, whereas at the uncompacted site values varied around the upper limit. However, bulk density
values within soil profiles at the compacted site were within the range of 1.63 g/cm3 to 1.74 g/cm3 reported for top
20 cm depth.
Interestingly, bulk density within soil profile at the uncompacted site was around the range of 1.57 g/cm3 to 1.60 g/cm3.
The comparable bulk density with increasing soil depth at the uncompacted site may reflect the relatively homogenous
soil physical conditions with depth and presumably indicate that the degree of soil compaction is not up to the extent
of hindering root development and proliferation at such depths. It is hoped that environmental monitoring and
assessment efforts would be aided by the analyses carried out within this study with respect to soil compaction as
porosity, moisture content and bulk density which play vital roles in the availability of plants and high vegetation
VI. RECOMMENDATIONS
There is the need to review the legislations regulating the access to natural mineral resources and the environmental
concerns arising from the operations of the mining and quarrying industries in Nigeria. At present legal provisions for
penalties and punishments dealing with mining and environmental degradation through mining activities are at best
very derisory and as such, the fines and prison terms should be reviewed upward taking into consideration, the level
of damage, mineral type and location. Adequate and effective measures need to be adopted to reclaim the destroyed
lands and mitigate future degradation.
One of the measures suggested for adoption involves re – claiming through sand filling of the unproductive or abandon
pits with soil so as to make them useful for other future uses. There is need for Dangote Cement Company to employ
experts to monitor the environmental degradation and make a plan to regain resilience of already destroyed areas.
There is also need for intensive environmental awareness and sensitization campaigns and development of
environmental preserving programmes targeting the host community. Further study on the reclamations of the quarry
site should be done to know the extent of other damages caused by the activities of cement production in Yandev and
its environs.
ACKNOWLEDGMENT
I will like to express my gratitude to my husband, Ajeh Daniel Edache whose overwhelming support, helped me to
finalize this work within the limited time frame and financial resources. My special thanks go also to my brother, Rev
Fr Eric Enenche Agbara for being an inspiration at every point. Finally, I thank all those whose assistance gave me
the push to accomplish this work.
REFERENCES
[1] Adekoya, J.A., (2003):Environmental Effect of Solid Minerals Mining. J. Phys. Sci. Kenya pp 625–640.
[2] Aigbedion, I.N., (2005):Environmental Pollution in the Niger-Delta, Nigeria. Inter-DisciplinaryJ.Enugu-Nigeria: 3(4): 205–210
[3] Aigbedion, I.N., Iyayi, S.E. (2007): Environmental Effect of Mineral Exploitation in Nigeria”. International Journal of Physical
Sciences, Vol.2 (2), pp. 33-38
[4] Bi, Y., Zou, H. and Zhu, C.(2014). Dynamic monitoring of soil bulk density and Infiltration rate during coal mining in sandy land
with different vegetation, Internal Journal Coal Sci Technology1: 198. doi:10.1007/s40789-014-0025-2
[5] Brady, N.C. and Weil, R.R. (1999): The Nature and Properties of Soils, 12th Edition, prentice-hall Inc., New Jersey, USA, pp
134 – 149
[6] Buchanan, K.M. and Pugh J.C. (1962): Land And People In Nigeria : The Human Geography Of Nigeria And Its Background.
University of London press.
[7] Langer, W.H. (2001), A potential Environmental Impact of Quarrying Stone in Karst- A literature Review, U.S. Geological Survey,
Open-File Report OF-01-0484.
[8] Limestone Milling in Nigeria. The Feasibility Report (2013).
[9] Lipiec J and W. Stepniewski (1995), Effects of soil compaction and tillage systems on uptake and losses of nutrients, Soil and Tillage
Research, Vol. 35, no. 1-2, pp. 37–52.
[10] Mallo, I. I. Y. (2007). Environmental and Socio-Economic Effects of Tin Mining on the Jos Plateau, Nigeria The Abuja Journal of
Geography and Development, Vol. 1, No. 2, pp1-23.
[12] Mkaanem, A. N. (2015). Effect of Limestone Mining On Vegetation Cover InMbayion, Gboko Local Government Area, Benue State,
Nigeria. Unpublished M.sc. Thesis, Ahmadu Bello University, Zaria
[13] National Population Commission. (2006). National Bureau of Statistics. Accessed from www.nigerianstat.gov.ng on 2nd September,
2014
[14] Nzunda, H.P. (2013). Impacts of mining activities on land cover and forest stock in Mbozi district, Mbeya region, Tanzania.
Unpublished M.sc. Dissertation, Sokoine University of Agriculture. Morogoro, Tanzania.
[15] Ujoh, F. And Alhassan, M.M. (2014). Multitemporal Change detection at a Limestone mining and cement production facility in Central
Nigeria. American Journal of Environmental Protection, Vol.3 issue 3
[16] USDA Natural Resources Conservation Service (2008) Soil Quality Indicators: Bulk Density. A collaboration between NRCS East
National Technology Support Centre (http://www.nrcs.usda.gov/about/ntsc/east), NRCS National Soil Survey Centre
(www.soils.usda.gov/contact/nssc/), ARS National Labouratory for Agriculture and the Environment
(www.ars.usda.gov/main/sitemain/),NCERA59Scientist (http://igu.umd.edu/igu), and Departmentof Natural Resources and
Environmental Sciences (http://www.nres.uiu.edu/), University of Illinois at Urbana-Champaign (http://www.uiuc.edu/), April 12, 2016.
[17] Voorhees, W. A (1992) Wheel-induced soil physical limitations to root growth. In Limitations to Plant Root Growth, A. L. Hatfield and
B. A. Stewart, Eds., vol. 19 of Advances in Soil Science, pp. 73–95, Springer, New York, NY, USA.
[18] Wright, J.B., Hastings, D.A., Jones, W.B. and Williams, H.R. (1985). Geology and Mineral Resources of West Africa. Allen and Unwin,