Effect of Temperature and hypertonic solution
Concentration on Mass Transfer Kinetics of
Plum During Osmotic Dehydration
S. V Karadbhajne1*,P. A Satao2
1*
Assistant Professor ,2Research student,
Department of Food Technology, Laxminarayan Institute of Technology, Rashtrasant Tukadoji Maharaj Nagpur University, Nagpur (M.S.) India
Abstract
In this research work mass transfer kinetics of plum (P. Domestica) during osmotic dehydration was carried out at three different temperature and hypertonic solution concentration with 0.5% salt and 0.25% citric acid for colour retention. Main objectives of this research work were to examine the effect of temperature and hypertonic solution concentration on mass transfer kinetics of plum. The most important kinetics parameters are WL, WR, SG and osmotic dehydration efficiency indicators (RWL and RSG) was calculated. It was found that 500C temperature, 750B hypertonic solution concentration with 0.5% salt and 0.25% citric acid gives satisfactory results of WL, WR and SG.
Keywords: Hypertonic Solution, Concentration, Kinetics, dehydration
I. INTRODUCTION
Osmotic dehydration was first introduced by Ponting (1973), for dehydration of fruits and vegetables. Osmotic dehydration is achieved by the pressure difference (chemical potential) between food material (hypotonic solution) and concentrated osmotic solution (hypertonic solution) (Sugar syrup). It is also consider as a pretreatment of food which are going to freezing, air drying and other drying treatments with quality improvement of them by partial water loss and solid gain. This is also Osmotic dehydration reduces moisture content up to 30-50% (Josephine Selvi. N. etal, 2014). Osmoactive substance should be edible, non-toxic, and inert to food materials and produce the acceptable taste. Sugar (for fruits) and salt (NaCl) (vegetables, fish, meat and cheese). Mixture of osmoactive substances are also used to obtain higher ratio of water loss and solid gain. Salt (NaCl) shows synergetic effect on fruits.
In this present research work, osmotic
dehydration was applied to plum (Prunus domestica)
because it is highly perishable fruit and not available throughout the year. Thus, its preservation is necessary. Further, it has been chosen because it
provide vitamin C, antioxidants, phenolic content which are helpful to human nutrition as well as treatment of some diseases (leucorrhea, irregular menstruation, miscarriage) (Preeti Birwal and et al, 2017).
Considering the importance of osmotic dehydration pre-treatments for food preservation applications in food industry various model development was carried out which simply provide the information related to dehydration process. To fulfill this aim lewis model, hederson model, logarithmic model and parabolic model was used to define the relationship between water loss (WL), solid gain (SG) and weight reduction (WR). These models are further used to study the regression analysis.
Several research works were carried out osmotic dehydration kinetics of fruits and process influencing on process kinetics of slice and dice fruits. The present research was conducted to study influence of operating parameters like temperature and concentration of hypertonic solution on high moisture content whole fruit like plum. The study was aimed to predict the influence of temperature and concentration of hypertonic solution on the osmotic dehydration kinetic parameters like water loss (WL), solid gain (SG) and weight reduction (WR).
II MATERIALS AND METHODS
A. Sample Prepration
Fresh fully ripened plums (Prunus
domestica) with dark red outer skin were procured from market. The fruits were washing with chlorinated water to ensure removal of surface adherents. Further blanching (1000C was carried out for removal of tissue gases, inactivation of enzymes, softening of tissue and to facilitation of osmosis by rupturing the cell wall. The retention of colour was done by addition of 1% citric acid and 0.5% salt (NaCl) in combination during blanching.
B. Osmosis
Osmosis of whole blanch fruit was done with variant process conditions as temperature (450C, 500C and 550C) and (sucrose) concentration (650B, 700C and 750C) respectively at constant contact time of 24 hours. The whole blanch fruit with initial
moisture content (87.63%) and TSS (140B) was
immersed into hypertonic solution of sucrose maintaining fruit to hypertonic solution ratio (1:6). After every treatment fruit was removed from the solution and kept at constant temperature for 15 min to drain out the syrup, then gently blotted with tissue paper. Washing with water after osmosis may lead to fall in total TSS of fruit, thus avoided. The moisture content of all the samples was determined according to standard methods of AOAC, (AOAC, 2000). The soluble solid content was measured by hand refractometer ((“Atago” Digital pocket refractometer model pal-3).
C. Mass Transfer Determination
Osmotic dehydration is governed by mass exchange between osmotic solution and sample until the concentration gradient has reached. The mass exchange was evaluated using the parameters such as water loss (WL) (Lenart A. & Flink J.M., 1984; Hawkes J. & Flink J.M., 1978), solid gain (SG) (Lenart A. & Flink J.M., 1984) and weight reduction (WR) by using the following equations.
M.R =M1−MeM−Me
---(1)
Where,
MR= Moisture reduction ratio
M1 = Initial moisture content M = Moisture content after time t Me = The equilibrium moisture content
(WR) (𝑔 𝑔 ) = M1−MM1 ---(2)
(WL) (𝑔 𝑔 ) = WR + SG ---(3)
(SG) (𝑔 𝑔 ) = m−m1M1 -- --- -(4)
Where,
M1 = Initial mass of sample (g).
M = Mass of sample after dehydration (g). m 1 = Initial mass of solids in sample (g). m = Mass of solids after dehydration (g).
On the basis of this parameters rate of water loss
RWL (𝑔 𝑔. 𝑚𝑖𝑛) = WLt ---(5)
RSG (𝑔 𝑔. 𝑚𝑖𝑛) = SGt ---(6)
Where, t = time of osmotic dehydration (min). The graphs were drawn by using Microsoft Office Excel.
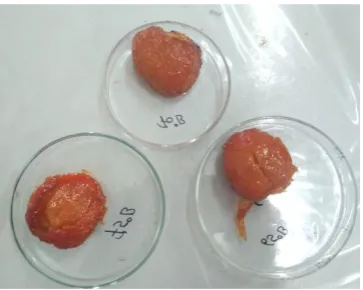
Fig. 1 Osmotically dehydrated plum at different sugar syrup concentration at temperature 500C
III. RESULT AND DISCUSSION
The effect of osmotic dehydration on plum fruit at various temperature (450C, 500C and 550C) and (sugar) hypertonic solution concentration (650B, 700C and 750C) respectively at constant contact time of 24 hours was represented in figure no. 2, 3 and 4. In osmotic dehydration process initially higher rate of mass transfer was observed than the later stage. This effect was due to higher osmotic pressure between fruit and hypertonic solution. Several researches was found on such a condition of osmotic dehydration (Kowalska & Lenart, 2001; Lazarides Et Al., 1995; R. Giangiacomoz, Danila Torreggiani and et al., 1986; R. N. Biswal, K. Bozorgmehr and et al., 1991) At fixed contact time (t), with temperature (450C, 500C and 550C) and osmotic solution concentration (650B, 700C and 750C) as variables the effect on the weight reduction (WR) accounts with water diffusion from the fruit to the solution were immersed, accompanied with simultaneous transfer of sucrose and other macromolecules from solution to
sample. With increase in temperature and
concentration of hypertonic solution, weight
wall structure was intact and act as a barrier for migration of solute. Similar results were reported by Gordana Koprivica and et al., (2010).
B 0 65
B 0 70
B 0 75 0.0
0.2 0.4 0.6 0.8
450C
500C
550C
Conc of syrup (0B)
W
R
(
g/
g)
Fig 2 Weight Reduction of plum during osmotic dehydration with respected to sugar syrup
concentration and process temperature
Water loss (WL) was also seems to be directly proposal to temperature and hypertonic solution concentration (C. R. Lerici, G. Pinnavaia, and et al, 1985; Patricia Moreira Azoubel, Fernanda Elizabeth Xidieh Murr, 2004; Kil Jin Park abd et al., 2002). With higher temperature water loss increases because obstruction of pours of fruits, that’s result into solute enter into fruit with diffusion stated by Gloria Panades and et al., (2006). The water loss was caused by driving force established between surrounding solution and fruit. From figure no. 3 it was observed that as the concentration of hypertonic solution increase then rate of water loss also increase. For plum, at 500C water loss is much higher than 450C and 550C processed batch. Further increase in temperature does not show that much effect on the water loss. Temperature above 550C results into lower water lass (WL) because modify tissue structure and result into impregnation process (Kulwinder Kaur, A. K. Singh, 2013). Further higher temperature result into enzymatic browning and colour, flavour and nutrients deterioration reported by Lenart and Flink, (1984). Thus best processing temperature should be chosen on the basis of food commodity. Similar results were reported by Misljenovic N. and et al., (2011), Figen Kaymak Erteki and Temel Cakaloz, (1995).
B 0 65
B 0 70
B 0 75
0.4 0.5 0.6 0.7 0.8
450C 500C 550C
Conc of syrup (0B)
W
L
(g/
g)
Fig. 3 Water loss of plum during osmotic dehydration with respected to sugar syrup
concentration and process temperature
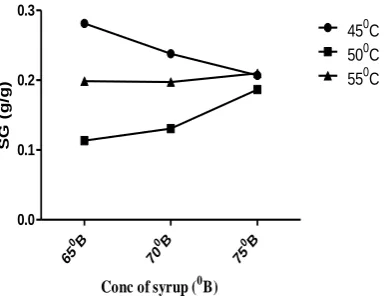
Solid gain (SG) value represent the amount of solute diffuse into the fruit (plum) in which it is immersed during osmotic dehydration. From figure no. 4 it was observe that solid gain decreases with increase in hypertonic solution concentration and temperature in case of plum. This result was obtained due to high polysaccharide content present in sugar syrup (Contreras and Smyrl, 1981; Bolin et al., 1983). Similar results for solid gain were reported by Oladejo Duduyemi (2015) for mango. The sample processed at 450C gives better results of solid gain (0.2379 at 700B) than sample processed at 500C and 550C. Objective of osmotic dehydration process is not to prepare candy (increase the SG) but extraction of more water from the treated sample. Thus the results obtain from this study are satisfactory. A similar result was reported by Gordana Koprivica and et al., (2010) and Misljenovic N. and et al., (2011) for carrot.
B 0 65
B 0 70
B 0 75
0.0 0.1 0.2 0.3
450C
500C
550C
Conc of syrup (0B)
S
G
(g
/g
)
Fig 4 Solid Gain of plum during osmotic dehydration with respected to sugar syrup
Important point to represent the efficiency of osmotic dehydration process is the ratio of water loss (RWL) and ratio of solid gain (RSG). The results obtain from the present experiments for RWL and RSG was represented in figure no. 5 and 6 respectively. Higher value of this ratio can be obtained by proper
application of osmotic dehydration process
conditions (temperature, concentration of hypertonic solution, time of contact and fruit to hypertonic solution ratio). From the figure no 5 and 6 it was observed that the rate of solid gain (RSG) is not that much significantly affected with concentration of hypertonic solution (650B, 700C and 750C) and process temperature (450C, 500C and 550C). But the rate of water loss (RWL) represents significant response to hypertonic solution concentration (650B, 700C and 750C) and process temperature (450C, 500C and 550C). At 500C and 750B rate of water loss was found to be 0.0308. it means that this condition could be consider as an optimal for osmotic dehydration of plum using sugar syrup as a hypertonic solution. A similar result was reported by Gordana Koprivica and et al., (2010).
B
0
65
B
0
70
B
0
75 0.015
0.020 0.025 0.030 0.035
450C 500C 550C
Conc of syrup (0B)
R
W
L
(
g
/g
mi
n
)
Fig 5: Ratio of Water Loss (RWL) of plum during osmotic dehydration of plum in
sugar syrup
B
0
65
B
0
70
B
0
75
0.000 0.005 0.010 0.015
450C
500C
550C
Conc of syrup (0B)
R
S
G
(
g
/g
m
in
)
IV. CONCLUSION
This research work provide the information about the effect of different hypertonic solution concentration and temperature (45, 50 and 550C) on the osmotic dehydration kinetics of plum) higher processing temperature (till specific limit) and higher hypertonic solution concentration gives better result on water loss and solid gain. In this present work better result of osmotic dehydration was obtained at 500C temperature and 750B hypertonic solution concentration. In this research work efficiency of osmotic dehydration (ratio of water loss (RWL) and ratio of solid gain (RSG) was obtained at 500C.
REFERENCES
[1] AOAC (2000). Official Methods of Analysis. Washington, USA Bolin, H.R. and Huxsoll, C.C. (1993). Partial drying of cut pears to improve freeze/thaw texture. Journal of Food Science, 58(2), 357–360.
[2] Bolin, H.R., Huxsoll , C.C., Jackson, R., and NG, K.C. (1983). Effect of osmo6c agents and concentration on fruit quality. Journal of Food Science, 48, 202.
[3] R. Lerici, G. Pinnavaia, M. Dalla Rosa, and Bartolucci (1985). Osmotic Dehydration of Fruit: Influence of Osmotic Agents on Drying Behavior and Product Quality. journal of food science, 50, 1217-1219.
[4] Contreras, J.E. and Smyrl, T.C. (1981). An evaluation of osmotic concentration of apple ring using corn syrup solid solutions. Can. Inst. Food Science and Technology, 14, 310. [5] Figen Kaymak Erteki and Temel Cakaloz. (1996). Osmotic
dehydration of peas: I. Influence of process variables on mass transfer, Journal of Food Processing and Preservation, 20, 7-104.
[6] Gloria Panades, Pedro Fito, Yania Aguiar, Margarita Nunez de Villavicencio and Victor Acosta, (2006). Osmotic dehydration of guava: Influence of operating parameters on process kinetics. Journal of food engineering, 72, 383-389. [7] Gordana Koprivica Nevena Misljenovic , Ljubinko Levic,
Lidija Jevric (2010), Mass transfer kinetics during osmotic dehydration of plum in sugar beet molasses, 634 (11), 664-854.
[8] Hawkes J. &Flink J.M. (1978). Osmotic concentration of fruit slices prior to freeze dehydration. Journal of Food Processing and preservation, 2, 265-284.
[9] J, Conway, F, Castaigne, G, Picard et x, Vovan. (1983). Mass Transfer Considerations in the Osmotic Dehydration of Apples, Journal of Food Science and Technology,, 16, 025-029.
[10] John X. Shi, Marc Le Maguer, Samuel L. Wang & Albert Liptay (1997). Application of osmotic treatment in tomato processing defect of skin treatments on mass transfer in osmotic dehydration of tomatoes, Food Research International, 30 (9), 669-674.
[11] Josephine Selvi.N, Aruna Singh and Baskar.G. (2014). Osmotic dehydration of fruits – an integrated approach, International Journal of Food and Nutrition, 3, 18-23. [12] Kil Jin Park, Adriana Bin, Fernando Pedro Reis Brod,
Tatiane Hae Kyung Brandini Park, (2002). Osmotic dehydration kinetics of pear D’anjou (Pyrus communis L.), Journal of Food Engineering, 52, 293–298.
[13] Kowalska, H., & Lenart, A. (2001). Mass exchange during osmotic pretreatment of vegetables, Journal of Food Engineering, 49, 137–140.
[15] Lazarides, H. N., Katsanidis, E., & Nickolaidis, A. (1995). Mass transfer during osmotic pre-concentration aiming at minimal solid uptake. Journal of Food Engineering, 25, 151– 166.
[16] Le Maruer, M and Biswall, CJ. (1988). Multicomponent diffusion and vapourliquid equilibria of dilute organic components in aqueous sugar solutions. American Institute of Chemical Engineering Journal, 18(3), 513-519.
[17] Lenart A. &Flink J.M. (1984). Osmotic dehydration of potato. I, Criteria for the end point of the osmosis process. Journal of Food technology, 19, 65-89.
[18] Misljenovic N., M. Koprivica ,G. B., Jevric, R., Levic lj., B. (2011). Mass transfer kinetics during osmotic dehydration of carrot cubes in sugar beet molasses, Romanian Biotechnological Letters, 16, 6790-6799.
[19] Oladejo Duduyemi, P.O. Ngoddy, B.I.O. Ade-Omowaye (2015). Optimal Osmotic Dehydration of Piece-form Mango in a Semi-continuous Operation, International Journal of Scientific & Engineering Research, 6(6), ISSN 2229-5518. [20] Patricia Moreira Azoubel, Fernanda Elizabeth Xidieh Murr.
(2004). Mass transfer kinetics of osmotic dehydration of cherry tomato, Journal of Food Engineering, 61, 291–295.
[21] Ponting, J. D. (1973). Osmotic dehydration of fruits – recent modify, Biochemistry, 8, 18–20.
[22] Preeti Birwal, Deshmukh G, Saurabh SP and Pragati S. (2017). Plums: A Brief Introduction, Journal of Food, Nutrition and Population Health, 1 (8), 1-5.
[23] R. Giangiacomoz, Danila Torreggiani And Elena Abbo. (1987). Osmotic Dehydration Of Fruit: Part 1. Sugars Exchange between Fruit And Extracting Syrups, Journal Of Food Processing And Preservation, 11, 183-195.
[24] R. N. Biswal, K. Bozorgmehr, F. D. Tompkins, And X. Liu. (1991). Osmotic Concentration of Green Beans Prior to Freezing, Journal of Food Science, 56 (4), 1008-1012. [25] Torreggiani, D and G. Bertolo. (2001). Osmotic
pretreatments in fruit processing: chemical, physicaland structural effects, Journal of Food Engineering, 49, 247-53. [26] Torres, J.D., P. Talens and I.A Escriche. Chiralt (2006).
Influence of process conditions onmechanical properties of osmoticallydehydratedmango, Journal of Food Engineering, 74, 240-246.