Page 183
APPROACHES TO LEARNING IN A HIGH-SCHOOL SETTING: FACTOR STRUCTURE AND INFLUENCE OF INDEPENDENT VARIABLES
Desislava Plamenova Petrova
Department of Social, Work, Clinical and Educational Psychology,
Sofia University “St. Kliment Ohridski”, 15 Tsar Osvoboditel Blvd., Sofia 1504, Bulgaria
Abstract
The aim of this paper is to present the results of a psychological study of students` approaches to learning in Bulgarian high-school setting. A total of 335 secondary students (157 males, 166 females), aged 14 – 18 years, were administered the Revised Approaches to Studying Inventory (Duff 1997), adapted for Bulgarian conditions by Y. Yankulova (Yankulova 2014). Factor analysis identified three factors explaining 41.4% of the total variance (KMO = .830, Bartlett's Test p = .000 < .05). At the first factor, deep approach, differences were found according to gender (t(323) = -2.965, p = .003 < .05), academic performance (F(302) = 6.285, p = .000 < .05), and extracurricular non-sporting activities (t(286) = -3.222, p = .001< .05). At the second factor, surface approach, differences were established in terms of gender (t(323) = -5.192, p = .000 < 0.05) and school grade (F(335) = 2.856, p = .037 < .05). And at the third factor, strategic approach, differences were observed according to gender (t(323) = -2.887, p = .004 < .05), school grade (F(335) = 3.286, p = .021 < .05), academic performance (F(302) = 10.838, p = .000 < .05), and extracurricular non-sporting activities (t(286) = -1.895, p = .059 > .05). The analysis and the conclusions derived from it can serve as a basis for further psychological research in the field, as well as for enhancing the quality of learning in secondary education.
Keywords: approaches to learning, approaches to studying, adolescents, secondary education, high-school setting, factor structure, individual differences, independent variables
1. INTRODUCTION
The last few decades have witnessed rapid and unpredictable scientific, socio-cultural and economic changes, often referred to as a transition from industrial to information society. This transition has had significant impact both at the individual and collective level. Individuals are now forced to continuously take part in a dynamic process of learning. As a result of this, there is a growing interest in re-evaluating and revising the leading educational priorities and policies so that youth can be effectively prepared for their transition to adulthood. In the light of all these events, a further exploration of what determines the quality of students’ learning products seems most timely.
Previous studies have shown that quality of learning is affected by various cognitive-personality factors including the way humans approach learning [1] [2] [3]. The concept of approaches to learning (or approaches to studying) originated from phenomenographic research and refers to how students typically learn in terms of a combination between type of learning strategy and motivational orientation [4] [5]. Throughout this paper we use the terms ‘approaches to learning’ and ‘approaches to studying’ interchangeably.
Page 184
There is an overall consensus that the deep approach appears to be the most preferable way to learn. However, findings [12] imply that the exclusive use of this approach might cause students to lose motivation to graduate. In this regard, it seems important to also help students cultivate skills associated with the strategic (achieving) approach [13].
Although student approaches to learning have been a popular research area in educational psychology, there is still a need for further investigation of the phenomenon in different cultures and contexts. Y. Yankulova is a pioneer in thoroughly exploring the characteristics of approaches to learning in Bulgarian academic setting [14]. However, no one to the best of our knowledge has studied Bulgarian secondary students’ approaches to learning.
This paper reports on a psychological study which examines students’ approaches to learning in a Bulgarian high-school setting. The study had two specific objectives or research questions: (1) to test the Bulgarian version of the Revised Approaches to Study Inventory - RASI [15] on a sample of secondary students and to establish the peculiarities in the factor structure; (2) to test if students’ approaches to learning are significantly affected by independent variables such as gender, age, school grade, type of school, academic performance and extracurricular activities.
2. METHOD
2.1.Participants
The sample consisted of 335 adolescents (157 males and 166 females) from three public high schools with a different profile, situated in Sofia, Bulgaria. Students’ ages ranged from 14 to 18 years with a mean of 16.11 years (SD = 1.07). The distribution by grade was as follows: 30.7% of the sample was in grade 9, 24.6% in grade 10, 34.8% in grade 11 and 9.9% in grade 12. There were no participants identified by their teachers as having special needs. Pupils who had completed fewer than 75% of the items on the RASI were classified as incomplete and their data were omitted from the subsequent analysis (N = 7).
2.2.Measure
Approaches to learning were appraised through the Revised Approaches to Studying Inventory – RASI [16] comprising 30 brief statements responded to on a 5-point scale, ranging from 1 (completely disagree) to 5 (completely agree). An example item is: “I organise my study time carefully to make the best use of it”. The instrument was translated into Bulgarian and adapted for Bulgarian conditions by Y. Yankulova [17] using a sample of 663 university students. For the purposes of the present study few items in the Bulgarian version were only slightly modified to fit the high school context (i.e. replacing “lectures/courses” with “classes”).
2.3.Procedure and statistical analysis
The aims and rationale of the study were explained to the headmasters in each school during a personal meeting or with the support of the school psychologists. Informed consent was obtained from parents/carers when necessary. The study itself was conducted in November 2018 as part of a regular school class (40-45 min). After a brief group explanation on confidentiality, the purpose of the activities, as well as the answer format, students were required to fill out an anonymous paper-based self-report questionnaire including the research instrument described below and sociodemographic questions. All the data was then transferred to and analysed with the computer program SPSS-19.
3. RESULTS
3.1.Internal reliability and factor structure of the RASI
Page 185
In the present study the KMO coefficient for the sample was above the 0.6 threshold suggested by Tabachnik and Fidell [18] and Bartlett's Test of Sphericity was significant
(KMO = .830, 2 (335) = 2356.7, p = .000 < .05). In addition, review of the diagonals on the anti-image correlations revealed that the lowest Measure of Sampling Adequacy (MSA) for individual variables equaled .590 > .5, so no items were removed prior to analysis.
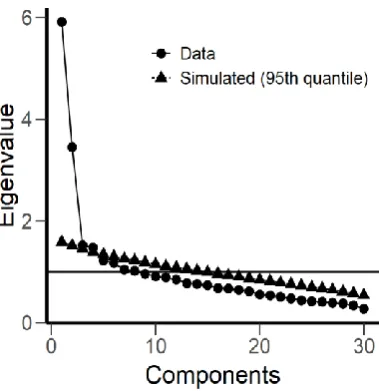
Exploratory factor analysis (EFA) was carried out in order to allow related variables to cluster and create factors [19]. The Principle Component Analysis (PCA) revealed a potential eight-factor model with all factors having eigenvalues above 1 (Kaiser’s K1 criterion) [20] and cumulatively explaining 62.1% of the total variance. Scree plot test [21] and Parallel Analysis (PA) [22] conducted using the syntax available from O’Connor’s website [23] were used to confirm the factor retention.
The visual inspection of the Scree plot involves identifying the cutoff for the numbers of factors to extract. Despite the simplicity and visual nature of the scree plot method, some researchers [24] believe that choosing a cutoff can be subjective when there are gradual or multiple changes in slope. Therefore it is recommended to combine Cattel’s test with PA. This analysis is also based on the scree test, yet at the same time it allows to minimize overidentification of factors due to sampling error. PA’s procedure includes a comparison between two correlation matrices: 1) a correlation matrix with eigenvalues from real data; 2) a computed correlation matrix with randomly generated eigenvalues based on the sample size of the actual data and number of variables. Factors from the actual data are retained as long as they are above the 95th percentile line generated by the random data matrices [25].
In the present study there was a dramatic change in slope of the screeplot at the third factor. Similarly, PA results indicated that the fourth factor is just at the threshold of the 95th percentile and thus does
not bear further investigation (Figure 1).
Fig. 1. Scree Plot and Parallel Analysis eigenvalues for RASI factors Note: RASI = Revised Approaches to Studying Inventory.
Page 186
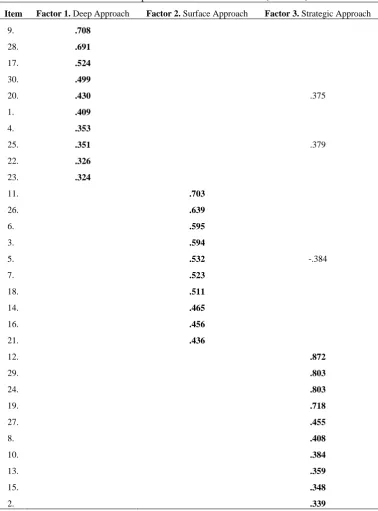
The factor pattern matrix is presented in Table 1. The examination of the item loadings between factors showed that there were a few items that had lower loadings on their respective factor. However, these were not viewed as problematic as they were not clustered on a single factor. In addition, it was found that three items loaded on more than one factor. Item 5 (‘I often have trouble making sense of the things I have to remember’) loaded on factors 2 and factor 3, while Item 20 (‘When I’m working on a new topic, I try to see in my own mind how all the ideas fit together.’) and Item 25 (‘When I’m reading, I examine the details carefully to see how they fit in with what’s being said.’) loaded on both factor 1 and factor 3. In spite of these cross-loadings, as well as two items (item 13 and item 22) being allocated to a different factor than the one we would expect based on the theoretical model, the three factors were substantively identical to the original structure [27] and were thus labeled accordingly: deep approach, surface approach, strategic approach.
Table 1. Factor pattern matrix for the RASI (N = 335)
Item Factor 1. Deep Approach Factor 2. Surface Approach Factor 3. Strategic Approach
9. .708
28. .691
17. .524
30. .499
20. .430 .375
1. .409
4. .353
25. .351 .379
22. .326
23. .324
11. .703
26. .639
6. .595
3. .594
5. .532 -.384
7. .523
18. .511
14. .465
16. .456
21. .436
12. .872
29. .803
24. .803
19. .718
27. .455
8. .408
10. .384
13. .359
15. .348
Page 187
Note: RASI = Revised Approaches to Studying Inventory. Coefficients that define each factor are displayed in bold. Item 25 was allocated to factor 1 in accordance with the original structure.
Extraction method: Principal Component Analysis. Rotation method: Promax with Kaizer Normalization
The final test of the applicability of a three-factor solution came through an analysis of the reliability coefficients of the proposed subscales. Results indicated that all the factors had solid internal reliabilities: 1) deep approach (items 1, 4, 9, 17, 2. 22, 23, 25, 28 and 30): α = .732; 2) surface approach (items 3, 5, 6, 7, 11, 14, 16, 18 and 26): α = .756; 3) strategic approach (items 2, 8, 10, 12, 13, 15, 19, 24, 27 and 29): α = .800. Therefore it could be concluded that a three-factor solution accounting for 41.4% of the total variance would be appropriate.
3.2.Descriptive statistics
Table 2 shows descriptive statistics for the RASI total scale and subscales. The Skewness and Kurtosis coefficients are within the acceptable range for normal distribution of data (-1,+1), indicating that both the subscales and the global score appear to be normally distributed. The examination of the mean scores of the three subscales indicated that the most preferred approach was strategic approach (M = 37.55, SD = 8.046), followed by deep approach (M = 34.62, SD = 6.084). The least preferred approach by participants turned out to be surface approach (M = 31.72, SD = 7.458). The findings are indicative of secondary students’ desire to actively and deeply participate in the learning process, as well as to effectively plan and organize their time and resources so that they can achieve maximum results.
Table 2. Descriptives for the RASI factors and global score (N = 335)
Factors (items) M SD Min Max
Me
dian
Mode
Sk
ewness
Kurtoses
Deep approach (10) 34.62 6.084 17 50 35.00 36 -.174 -.003
Surface approach (10) 31.72 7.458 10 48 32.00 31 -.192 -.297
Strategic approach (10) 37.55 8.046 15 55 37.00 37 -.152 -.109
Approaches to studying (30) 100.45 13.454 49 139 100.00 101 -.211 .766
Note: RASI = Revised Approaches to Studying Inventory.
3.3.Independent variables
Page 188
Table 3. Independent Samples T-test results for the mean scores obtained from the RASI general scale and subscales based on gender
Gender N M SD df t p
Deep approach 323 -2.965 .003
Male 157 33.58 5.738
Female 166 35.56 6.238
Surface approach 323 -5.192 .000
Male 157 29.59 6.938
Female 166 33.77 7.494
Strategic approach 323 -2.887 .004
Male 157 36.18 7.341
Female 166 38.77 8.698
Note: RASI = Revised Approaches to Studying Inventory.
Mean scores that are significantly different from one another are displayed in bold.
An analysis of variance showed that the effect of age on any of the RASI dimensions was not significant: deep approach (F (335) = 1.000, p = .408 > .05), surface approach (F (335) = 1.923, p = 1.106 > .05), strategic approach (F (335) = 1.739, p = 1.141 > .05). However, the One-way ANOVA-test results indicated that school grade explained 2.5% of the differences in the preferences for surface approach and 2.9% of the varience in strategic approach (Table 4).
Table 4. One-way ANOVA-test results for the mean scores obtained from the RASI general scale and subscales based on grade.
Grade N M SD df F p
Deep approach 335 1.191 .313
9th 105 34.60 6.176
10th 81 33.63 6.268
11th 116 35.28 5.545
12th 33 34.82 7.042
Surface approach 335 2.856 .037
9th 105 32.83 6.213
10th 81 31.62 7.534
11th 116 31.71 7.997
12th 33 28.52 8.292
Strategic approach 335 3.286 .021
9th 105 36.57 8.030
10th 81 36.05 7.837
11th 116 39.16 7.529
12th 33 38.70 9.449
Note: RASI = Revised Approaches to Studying Inventory. Mean scores that are significantly different from one another, as indicated by the Post Hoc Test (Dunnett T3 or Tukey HSD), are displayed in
Page 189
Post hoc analyses using the Tukey HSD post hoc criterion for significance showed that the surface approach mean score of 9-th grade students was significantly higher (M = 32.83, SD = 6.213) than the one of 12th grade students (M = 28.52, SD = 8.292) (p = .05). And in regards to differences in strategic
approach, Post hoc analyses using the Dunett T3 post hoc criterion for significance found evidence for significant changes happening in the period 10th grade (M = 36.05, SD = 7.837) – 11th grade (M=
39.16, SD = 7.529) (p = .045). Together the present results confirm that throughout the course of secondary education students acquire relevant self-regulated learning skills that allow them to approach studying strategically rather than superficially.
Contrary to the findings of Y. Yankulova [30] we did not find any significant variance based on the
educational institution participants study at: deep approach (F (335) = 2.410, p = .091 > .05), surface approach (F (335) = 2.567, p = .078 > .05), strategic approach (F (335) = .574, p = .564 > .05). On the one hand, these contradictions may be caused by limitations of the present study, as well as specific differences between the secondary and higher education systems in Bulgaria. On the other hand, previous research [31] suggests that students’ approaches to studying are more directly affected by their perceptions of contextual factors rather than the context itself.
Another promising finding was that 5.4% of the variance for deep approach (F (302) = 6.285, p = .000 < .05) and 8.9% of the variance for strategic approach (F (302) = 10.838, p = .000 < .05) could be explained by academic performance (measured by self-reported Grade Point Average (GPA) from the previous school year) (Table 5). Post hoc analyses using the Tukey HSD post hoc criterion for significance indicated that students with a GPA bellow 4.5
reported a significantly lower average score on deep approach
(M = 31.46, SD = 6.450) than did students with a GPA between 4.5 and 5.5 (M = 34.54, SD = 5.568) (p = .015 < .05) or students with a GPA above 5.5 (M = 36.10, SD = 6.349) (p = .000 < .05). Similarly, it was found that students with higher GPA scores approached studying more strategically than did students with lower GPA scores. Significant differences were identified between the mean scores of all the three groups: GPA bellow 4.5. (M = 33.00, SD = 6.725), GPA between 4.5 and 5.5 (M = 36.67, SD = 8.001) and GPA above 5.5 (M = 40.33; SD = 7.792) (p = .000 or p = .018 < 0.05). These findings were in line with previous research in Bulgarian academic setting [32] [33].
Table 5. One-wayANOVA-test results for the mean scores obtained from the RASI general scale and subscales based on Grade Point Average (GPA) from the previous school year
GPA from previous school year N M SD df F p
Deep approach 302 6.285 .000
Bellow 4.5 45 31.64 6.450
Between 4.5 and 5.5 142 34.54 5.568
Above 5.5 115 36.10 6.349
Surface approach 302 .452 .716
Bellow 4.5 45 30.64 8.389
Between 4.5 and 5.5 142 31.92 7.292
Above 5.5 115 31.69 7.627
Strategic approach 302 10.838 .000
Bellow 4.5 45 33.00 6.725
Between 4.5 and 5.5 142 36.67 8.001
Above 5.5 115 40.33 7.792
Note: RASI = Revised Approaches to Studying Inventory. Mean scores that are significantly different from one another are displayed in bold. Grading Scale in Bulgaria is based on grades of 5 numbers ranging from 2 to 6: 2.00-2.99 – failed, 3.00- 3.50 – satisfactory, 3.50-4.50 – good, 4.50-5.50 – very
Page 190
Independent samples T-tests were used in order to investigate whether extracurricular activities
significantly affect the approaches to studying preferences. The analysis did not identify any significant differences based on the participation in extracurricular SPORTING activities: deep approach (t (286) = .518, p = .605 > .05), surface approach (t (286) = .989, p = .323 > .05), strategic approach (286) = -.136, p = .892 > .05). However, extracurricular NON-SPORTING activities were
found to significantly affect student’s preferences for deep approach
(t (286) = -3.222, p = 0.001< 0.05) and strategic approach (t (286) = -1.895; p = 0.059 > 0.05), explaining 3.5% and 1.3% of the variance in the respective factors (Table 6). Results revealed that students participating in school clubs, vocational activities, volunteering, student council and different types of courses scored higher scores than did those only taking part in curricular activities. Overall the present study provides additional support for the role of extracurricular activities on learning. On the one hand, sports participation was found to have both positive and negative effect on academic outcomes [34]. On the other hand, earlier research [35] indicated that constructive non-academic activities at school or in the community can act as a facilitator of positive adolescent development in terms of academic performance, school engagement etc.
Table 6. T-test results for the mean scores obtained from the RASI general scale and subscales based on extracurricular NON-SPORT activities.
Extracurricular NON-SPORT activities N M SD df T p
Deep approach 286 -3.222 .001
No 151 33.73 5.495
Yes 135 36.01 6.501
Surface approach 286 .200 .841
No 151 31.53 6.861
Yes 135 31.35 8.308
Strategic approach 286 -1.895 .059
No 151 36.89 7.402
Yes 135 38.72 8.723
Note: RASI = Revised Approaches to Studying Inventory. Mean scores that are significantly different from one another are displayed in bold.
4. DISCUSSION
To sum up, this work has been a preliminary attempt to investigate the factor structure and differential features of approaches to learning in Bulgarian high-school setting. Although previous research [36] [37] identified four factors in the factor structure of the Revised Approaches to Study Inventory in Bulgarian academic environment, the original three-factor embodiment (deep, surface and strategic approaches) [38] was replicated in the studied context.
Regarding the differential features not all expected theoretical conceptions were detected. No significant differences were revealed between students based on school, age and extracurricular sporting activities. On the other hand, student’s approaches to learning were found to be affected by gender (all approaches), school grade (surface and strategic approaches), academic record (deep and strategic approaches), as well as extracurricular non-sporting activities (deep and strategic approaches).
Page 191
schools in Sofia, so findings might not necessarily be generalized to the larger population. Despite this the author believes that the provided evidence has important implications for further research in the field of educational psychology and could support policy makers and education practitioners in the process of developing effective learning programs, as well as improving the quality of secondary school education in Bulgaria.
ACKNOWLEDGMENTS
The author gratefully acknowledges her PhD supervisor Prof. Yoana Yankulova for her ongoing guidance, feedback and assistance. Thanks are also due to Sofia University “St. Kliment Ohridski”, which sponsored conference participation.
REFERENCES
1. Biggs, JB 1979, ‘Individual Differences in Study Processes and the Quality of Learning Outcomes’, Higher Education, vol. 8, no. 4, pp. 381-394.
2. Haggis, T 2003, ‘Constructing images of ourselves? A critical investigation into 'approaches to learning' research in higher education’, British Educational Research Journal, vol. 29, pp. 89-104.
3. Ramsden, P 1992, Learning to Teach in Higher Education, Routledge, London.
4. Biggs, JB 1987, Student approaches to learning and studying, Australian Council for Educational Research, Melbourne.
5. Entwistle, NJ & Ramsden, P (1983), Understanding student learning, Croom Helm, London.
6. Entwistle, NJ & McCune, V 2004, ‘The conceptual bases of study strategy inventories’, Educational Psychology Review, vol. 16, no. 4, pp. 325-345.
7. Ramsden, P 1981, ‘A study of the relationship between student learning and its academic context’, Ph.D. thesis, University of Lancaster, Lancaster (as cited in Entwistle, N 1991, ‘Approaches to learning and perceptions of the learning environment - Introduction to the Special Issue’, Higher Education, vol. 22, pp. 201-2014.).
8. Biggs, JB 1987, Student approaches to learning and studying, Australian Council for Educational Research, Melbourne.
9. Biggs, JB 1990, ‘Teaching for desired learning outcomes’, in NJ Entwistle (ed.), Handbook of educational ideas and practices, Routledg, London and New York, pp. 681-693.
10. Entwistle, N 1987, ‘Motivation to learn: Conceptualizations and practicalities’, British Journal of Educational Studies, vol. 35, no. 2, pp. 129-148.
11. Richardson, J TE 2000, Researching student learning: approaches to studying in campus-based and distance education, SRHE and Open University Press, Buckingham.
12. Lonka, K, Olkinuora, E & Mäkinen, J 2004, ‘Aspects and prospects of measuring studying and learning in higher education’, Educational Psychology Review, vol. 16, no. 4, pp. 301-323.
13. Duarte, A, 2007, ‘Conceptions of Learning and Approaches to Learning in Portuguese Students’, Higher Education, vol. 54, no. 6, pp. 781-794.
14. Yankulova, Y 2014, ‘Kognitivno-lichnostni determinanti na samoreguliranoto uchene v akademichna sreda’, D.Sc. thesis, Sofia University “St. Kliment Ohridski”, Sofia.
Page 192
16. Duff, A 1997, ‘A note on the reliability and validity of a 30-item version of Entwistle & Tait`s revised Approaches to Studying Inventory’, British Journal of Educational Psychology, vol. 67, pp. 529-539.
17. Yankulova, Y 2014, ‘Kognitivno-lichnostni determinanti na samoreguliranoto uchene v akademichna sreda’, D.Sc. thesis, Sofia University “St. Kliment Ohridski”, Sofia.
18. Tabachnick, BG & Fidell, LS 2013, Using multivariate statistics, 6th ed., Pearson, Boston.
19. Child, D 2006, The Essentials of Factor Analysis, 3rd ed., Continuum, London.
20. Kaiser, HF 1960, ‘The Application of Electronic Computers to Factor Analysis’, Educational and
Psychological Measurement, vol. 20, pp. 141-151,
<https://doi.org/10.1177/001316446002000116>.
21. Cattell, RB 1966, ‘The Scree test for the number of factors’, Multivariate Behavioral Research, vol. 1, pp. 245–276.
22. Horn, JL 1965, ‘A rationale and test for the number of factors in factor analysis’, Psychometrika, vol. 30, pp. 179–185.
23. O'Connor, BP n.d., SPSS, SAS, MATLAB, and R Programs for Determining the Number of Components and Factors Using Parallel Analysis and Velicer's MAP Test, viewed 14 February 2019, <www.people.ok.ubc.ca/brioconn/nfactors/nfactors.html>.
24. O'Connor, BP 2000, ‘SPSS and SAS programs for determining the number of components using parallel analysis and Velicer's MAP test’, Behavior Research Methods, Instrumentation, and Computers, vol. 32, pp. 396-402.
25. Wood, ND et al. 2015, ‘Combining Parallel and Exploratory Factor Analysis in Identifying Relationship Scales in Secondary Data’, Marriage & family review, vol. 51, no. 5, pp. 385-395, <doi:10.1080/01494929.2015.1059785>.
26. Tabachnick, BG & Fidell, LS 2013, Using multivariate statistics, 6th ed., Pearson, Boston.
27. Duff, A 1997, ‘A note on the reliability and validity of a 30-item version of Entwistle & Tait`s revised Approaches to Studying Inventory’, British Journal of Educational Psychology, vol. 67, pp. 529-539.
28. Yankulova, Y 2016, Emotsii i samoregulatsia na ucheneto, Paradigma, Sofia.
29. Bugler, M, McGeown, S & Thompson, H 2013, ‘Gender differences in adolescents’ academic motivation and classroom behavior’, Educational Psychology, vol. 35, pp. 1-16, <doi:10.1080/01443410.2013.849325>.
30. Yankulova, Y 2016, Emotsii i samoregulatsia na ucheneto, Paradigma, Sofia.
31. Entwistle, NJ 2015, ‘Annual Conference 2014 paper: The origins and evolution of the concept of ‘approaches to learning’’, The Psychology of Education Review, vol. 39, pp. 9-12.
32. Yankulova, Y 2016, Emotsii i samoregulatsia na ucheneto, Paradigma, Sofia.
33. Yankulova, Y 2014, ‘Kognitivno-lichnostni determinanti na samoreguliranoto uchene v akademichna sreda’, D.Sc. thesis, Sofia University “St. Kliment Ohridski”, Sofia.
34. Munoz-Bullon, F, Sanchez-Bueno, M & Vos-Saz, A 2017, ‘The influence of sports participation on academic performance among students in higher education’, Sport Management Review, vol. 20, no.4, pp.365-378.
35. Eccles, J, Barber, B, Stone, M & Hunt, J 2003, ‘Extracurricular activities and adolescent development’, Journal of Social Issues, vol. 59, no. 4, pp. 865-889.
Page 193
37. Yankulova, Y 2014, ‘Kognitivno-lichnostni determinanti na samoreguliranoto uchene v akademichna sreda’, D.Sc. thesis, Sofia University “St. Kliment Ohridski”, Sofia.